 Arctic SDI catalogue
Authoritative
Type of resources
Categories
Available actions
Topics
Keywords
Contact for the resource
Provided by
Years
Formats
Representation types
Update frequencies
status
Service types
Scale
Resolution
-
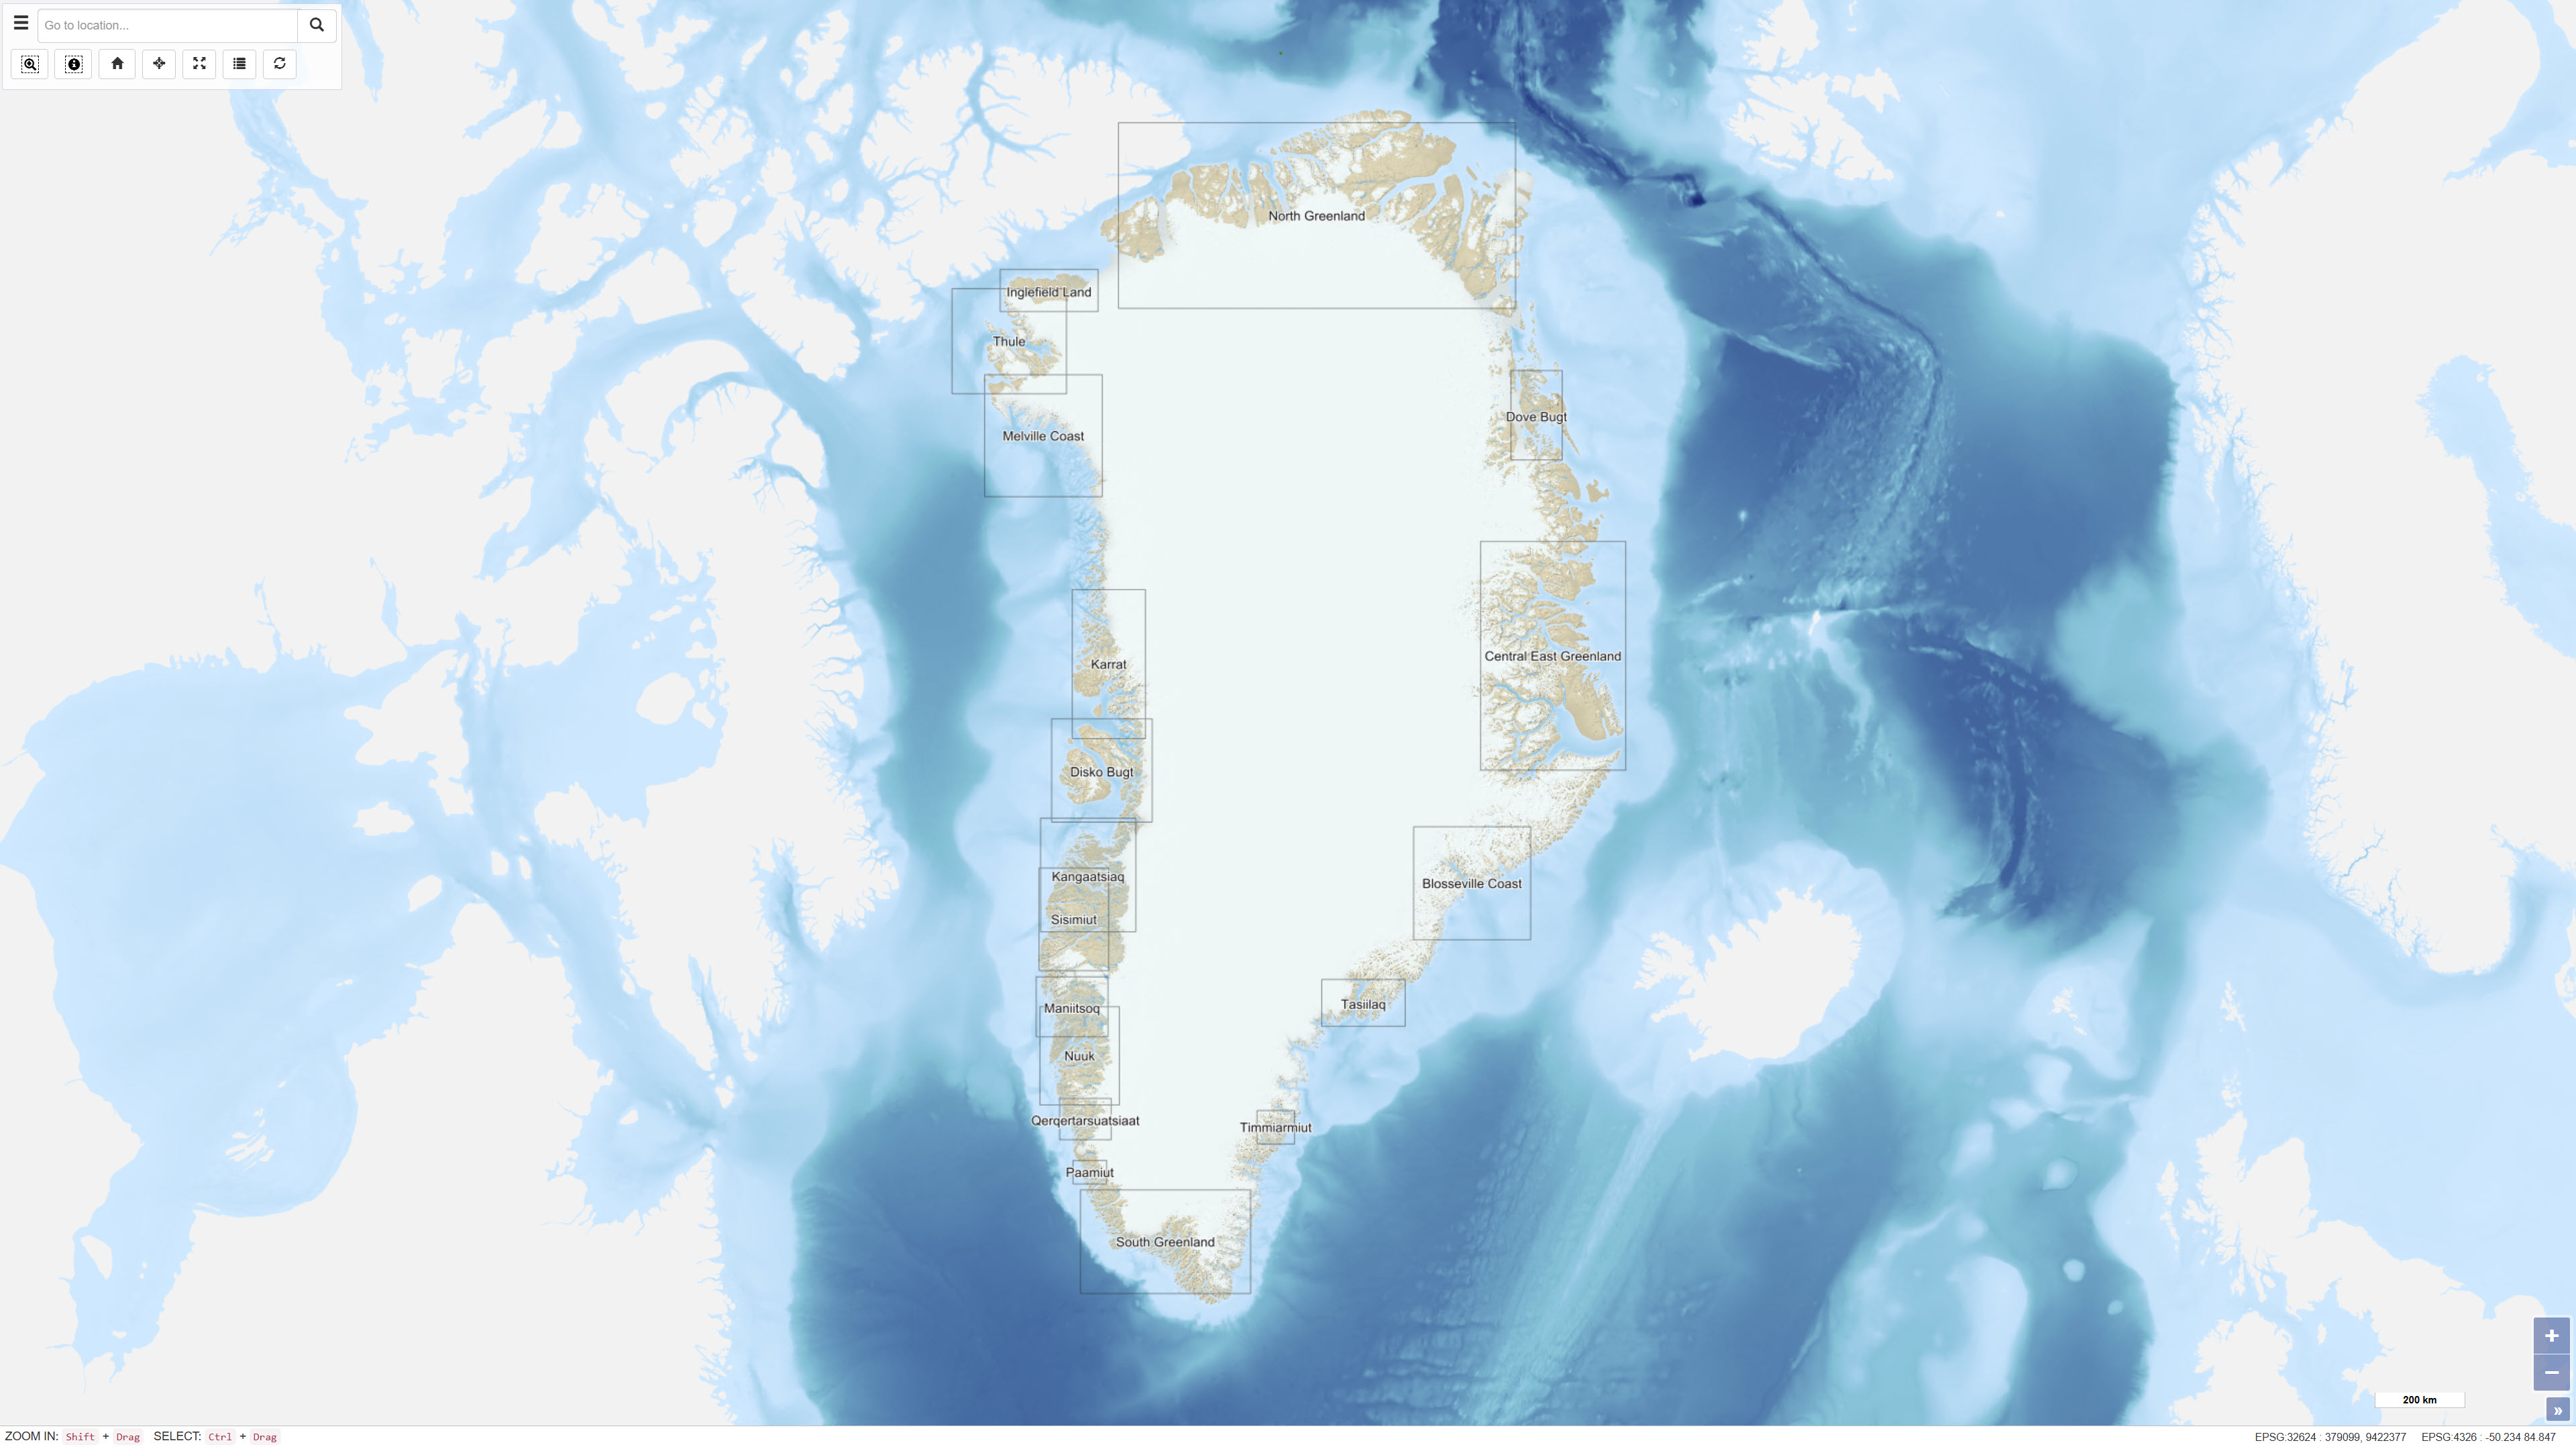
The dataset contains a summary of geological information for known mineral occurrence regions in Greenland. The information includes the geographic location, size, mineral commodities, mineralisation type, exploration history and a geological description of each occurrence or deposit. The data have been collected and compiled from field investigations conducted by geological surveys, academic researchers and mineral exploration companies. The dataset represents a regional synthesis of mineral occurrence information and provides an overview of the spatial distribution and geological context of known mineral resources in Greenland.
-
The Watershed Boundary Dataset (WBD) from The National Map (TNM) defines the perimeter of drainage areas formed by the terrain and other landscape characteristics. The drainage areas are nested within each other so that a large drainage area, such as the Upper Mississippi River, will be composed of multiple smaller drainage areas, such as the Wisconsin River. Each of these smaller areas can further be subdivided into smaller and smaller drainage areas. The WBD uses six different levels in this hierarchy, with the smallest averaging about 30,000 acres. The WBD is made up of polygons nested into six levels of data respectively defined by Regions, Subregions, Basins, Subbasins, Watersheds, and Subwatersheds. For additional information on the WBD, go to http://nhd.usgs.gov/wbd.html. The USGS National Hydrography Dataset (NHD) service is a companion dataset to the WBD. The NHD is a comprehensive set of digital spatial data that encodes information about naturally occurring and constructed bodies of surface water (lakes, ponds, and reservoirs), paths through which water flows (canals, ditches, streams, and rivers), and related entities such as point features (springs, wells, stream gages, and dams). The information encoded about these features includes classification and other characteristics, delineation, geographic name, position and related measures, a "reach code" through which other information can be related to the NHD, and the direction of water flow. The network of reach codes delineating water and transported material flow allows users to trace movement in upstream and downstream directions. In addition to this geographic information, the dataset contains metadata that supports the exchange of future updates and improvements to the data. The NHD is available nationwide in two seamless datasets, one based on 1:24,000-scale maps and referred to as high resolution NHD, and the other based on 1:100,000-scale maps and referred to as medium resolution NHD. Additional selected areas in the United States are available based on larger scales, such as 1:5,000-scale or greater, and referred to as local resolution NHD. For more information on the NHD, go to http://nhd.usgs.gov/index.html. Hydrography data from The National Map supports many applications, such as making maps, geocoding observations, flow modeling, data maintenance, and stewardship. Hydrography data is commonly combined with other data themes, such as boundaries, elevation, structures, and transportation, to produce general reference base maps. The National Map viewer allows free downloads of public domain WBD and NHD data in either Esri File or Personal Geodatabase, or Shapefile formats.
-
The USGS National Hydrography Dataset (NHD) service from The National Map (TNM) is a comprehensive set of digital spatial data that encodes information about naturally occurring and constructed bodies of surface water (lakes, ponds, and reservoirs), paths through which water flows (canals, ditches, streams, and rivers), and related entities such as point features (springs, wells, stream gages, and dams). The information encoded about these features includes classification and other characteristics, delineation, geographic name, position and related measures, a "reach code" through which other information can be related to the NHD, and the direction of water flow. The network of reach codes delineating water and transported material flow allows users to trace movement in upstream and downstream directions. In addition to this geographic information, the dataset contains metadata that supports the exchange of future updates and improvements to the data. The NHD is available nationwide in two seamless datasets, one based on 1:24,000-scale maps and referred to as high resolution NHD, and the other based on 1:100,000-scale maps and referred to as medium resolution NHD. Additional selected areas in the United States are available based on larger scales, such as 1:5,000-scale or greater, and referred to as local resolution NHD. The NHD from The National Map supports many applications, such as making maps, geocoding observations, flow modeling, data maintenance, and stewardship. For additional information on the NHD, go to http://nhd.usgs.gov/index.html. The Watershed Boundary Dataset (WBD) is a companion dataset to the NHD. It defines the perimeter of drainage areas formed by the terrain and other landscape characteristics. The drainage areas are nested within each other so that a large drainage area, such as the Upper Mississippi River, will be composed of multiple smaller drainage areas, such as the Wisconsin River. Each of these smaller areas can further be subdivided into smaller and smaller drainage areas. The WBD uses six different levels in this hierarchy, with the smallest averaging about 30,000 acres. The WBD is made up of polygons nested into six levels of data respectively defined by Regions, Subregions, Basins, Subbasins, Watersheds, and Subwatersheds. For additional information on the WBD, go to http://nhd.usgs.gov/wbd.html. The National Map hydrography data is commonly combined with other data themes, such as boundaries, elevation, structures, and transportation, to produce general reference base maps. The National Map viewer allows free downloads of public domain NHD and WBD data in either Esri File or Personal Geodatabase, or Shapefile formats.
-

Notagildi: Reitakerfi eru nauðsynlegt til að birta upplýsingar sem af einhverjum ástæðum er ekki hægt að birta stakar s.s. vegna persónuverndar, umfangs verkefnis eða nákvæmni þeirra upplýsinga sem fyrir liggja. Reitakerfi Íslands er með mismunandi reitastærðum til að mæta mismunandi þörfum notenda við upplýsingamiðlun. Mælt er með notkun reitakerfisins m.a. þegar verið er að bera gögn saman milli stofnana. Reitakerfið er byggt á Lambert Azimuthal Equal Area vörpun sem tryggir að allir reitir sé jafn stórir. En það er helsta skilyrði þess að reitakerfið sé Inspire tækt. Viðmiðun er ISN 2004 Ef reitakerfið er notað í einhverjum af ISN Lambert vörpunum er það ferhyrnt. Orðskýringar: Heildarkerfið er nefnt reitakerfi. Hvert lag í því er nefnt net. Einingar í netinu eru nefndar reitir. Heiti reitana: Hver reitur hefur nafn sem er einkvæmt og er m.a. byggt upp á stærðareiningunni. 1km 10km og 100m skrárnar ná yfir strandlínu og eyjar landsins en 100km skráin nær yfir alla efnahagslögsöguna. grid_100k grid_50k grid_25k grid_10k grid_5k grid_2_5k grid_1k grid_500m grid_250m grid_100m Frekari tækniupplýsingar er að finna hér https://inspire.ec.europa.eu/id/document/tg/gg
-
A vector representation of stream networks is a crucial dataset for the modelling the surface water and groundwater components of the hydrologic cycle. For many usages a crucial attribute of the drainage network is a digital topology and hierarchal stream order attribute (e.g., Strahler stream order). In Canada jurisdictional stream networks are available for the provinces and territories and nationally for Canada in the National Hydrological Network (NHN) dataset. Unfortunately, the NHN data lacks the same topological and attribute information that is available for numerous provinces due to standardization for the entire country. For Canada1Water it was also necessary to have a harmonized dataset with the United States, for both the southern transboundary watersheds and the Alaskan watersheds. This report documents the processes completed to upgrade the topological and graph network support for NHN and provide continuous connectivity with US datasets. It also highlights and corrects a number of stream density and stream order issues that occur within Canada across provincial and territorial borders and NTS tiles. All vector processing was completed in RivEX software extension for ArcMap. Following complete topological correction stream classification was assigned and a table of the node graph network developed. Additional work was then completed to normalize stream density particularly amongst low-order streams between British Columbia and the Yukon and amongst local NTS tiles in Quebec and Ontario. Corrected NHN Strahler stream order assignment was validated against a number of provincial and watershed datasets, all of which already have Strahler stream order attributed. These datasets are the same underlying digitized vector data, so there are no differences in node or polyline positions. Strahler stream order assignment validation was only done by visual comparison as due to differences in vector segments a statistical comparison is complicated. The transboundary integrated C1W stream network with complete classification provides a seamless national dataset to support transdisciplinary studies (fisheries, wildlife, health, pesticide and nutrient issues, mining impact, ecosystem restoration, numeric modelling) that involve a knowledge of stream distribution and ranking.
-

The Corine Land Cover datasets CLC2000, CLC2006and CLC change 2000-2006 are produced within the frame of the GMES land monitoringproject.Corine Land Cover (CLC) provides consistent information on land cover and land cover changes across Europe. This inventory was initiated in 1985 (reference year 1990) and established a time series of land cover information with updates in 2000 and 2006.CLC products are based on photointerpretation of satellite images by national teams of participating countries - the EEA member and cooperating countries – following a standard methodology and nomenclature with the following base parameters: 44 classes in the hierarchical three level Corine nomenclature; minimum mapping unit (MMU) for status layers is 25 hectares; minimum width of linear elements is 100 metres; minimum mapping unit (MMU) for Land Cover Changes (LCC) for the change layers is 5 hectares. The resulting national land cover inventories are further integrated into a seamless land cover map of Europe.Land cover and land use (LCLU) information is important not only for land change research, but also more broadly for the monitoring of environmental change, policy support, the creation of environmental indicators and reporting. CLC datasets provide important datasets supporting the implementation of key priority areas of the Environment Action Programmes of the European Union as protecting ecosystems, halting the loss of biological diversity, tracking the impacts of climate change, assessing developments in agriculture and implementing the EU Water Framework Directive, among others.More about the Corine Land Cover (CLC) and Copernicus land monitoring data in general can be found at http://land.copernicus.eu/.
-

The Corine Land Cover datasets CLC2000, CLC2006 and CLC change 2000-2006 areproduced within the frame of the GMES land monitoring project. Corine Land Cover (CLC) provides consistent information on land cover and land cover changes across Europe. This inventory was initiated in 1985 (reference year 1990) and established a time series of land cover information with updates in 2000 and 2006.CLC products are based on photointerpretation of satellite images by national teams of participating countries - the EEA member and cooperating countries – following a standard methodology and nomenclature with the following base parameters: 44 classes in the hierarchical three level Corine nomenclature; minimum mapping unit (MMU) for status layers is 25 hectares; minimum width of linear elements is 100 metres; minimum mapping unit (MMU) for Land Cover Changes (LCC) for the change layers is 5 hectares. The resulting national land cover inventories are further integrated into a seamless land cover map of Europe.Land cover and land use (LCLU) information is important not only for land change research, but also more broadly for the monitoring of environmental change, policy support, the creation of environmental indicators and reporting. CLC datasets provide important datasets supporting the implementation of key priority areas of the Environment Action Programmes of the European Union as protecting ecosystems, halting the loss of biological diversity, tracking the impacts of climate change, assessing developments in agriculture and implementing the EU Water Framework Directive, among others.More about the Corine Land Cover (CLC) and Copernicus land monitoring data in general can be found at http://land.copernicus.eu/.
-
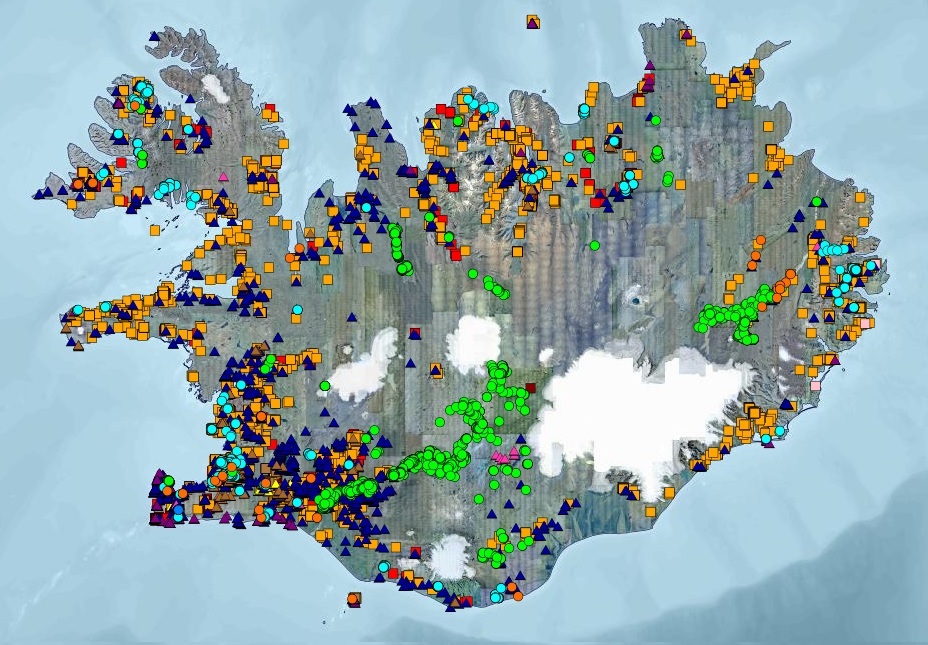
Gagnasett sem sýnir yfirlitsupplýsingar úr Borholugrunni Umhverfis- og orkustofnunar um borholur á Íslandi. Fram koma meðal annars: auðkennisnúmer borholu, borholunafn, staðarheiti, bortími, dýpi, sveitarfélag, eldra hreppsnafn, landnúmer, tilgangur og tegund borunar, bor og borfyrirtæki, staðsetningarhnit í ISN93 og WGS84, gæði hnita, fóðringardýpi og holuvídd. Í töflunni eru yfir 15.000 færslur. Upplýsingar úr gagnatöflunni eru bæði aðgengilegar á vefsíðu UOS og í Kortasjá UOS.
-

Compiled by Alberta Data Partnerships Ltd. (ADP), on behalf of the Government of Alberta, the Alberta Provincial Boundary ATS v4.1 polygon layer contains the polygon that represents the location of the boundaries of the Province of Alberta. This version of the Province of Alberta boundaries should be considered definitive for Government of Alberta use, and supersedes all previous versions.
-
The USGS Elevation Contours service from The National Map (TNM) consists of contours generated for the conterminous United States from 1- and 1/3 arc-second elevation data. Small scale contours derived from 1 arc-second data are displayed at scales ranging from 1:577K to 1:72K in The National Map viewer. Contour intervals are 100 foot between 1:577K and 1:144K, and 50 foot at 1:72K. Large scale contours derived from 1/3 arc-second data are displayed at 1:50K (and larger). Large scale contour intervals are variable across the United States depending on complexity of topography. The National Map viewer allows free downloads of public domain contour data in either Esri File Geodatabase or Shapefile formats. The 3D Elevation Program (3DEP) provides elevation data for The National Map and basic elevation information for earth science studies and mapping applications. Scientists and resource managers use elevation data for global change research, hydrologic modeling, resource monitoring, mapping and visualization, and many other applications. For additional information on 3DEP, go to http://nationalmap.gov/3DEP/.