Arctic and Antarctic Research Institute, Roshydromet (Saint-Petersburg)
Type of resources
Available actions
Topics
Keywords
Contact for the resource
Provided by
Years
Formats
Resolution
-
Gridded fields of salinity for 50 N - 67 N, 41,5 W - 61,5 W geographic region (yearly, 2000 - 2016), 29 standard depths
-
Measurement data on the "Rossiya" icebreaker.This dataset is included the following parameters:temperature of water,salinity,dencity.Additionally, meteorological data are presented:wind speed,wind direction, air temperature, visibility.
-
This dataset is included the following parameters: water temperature, salinity,air temperature,visibility (code). Research vessel:"Mikhail Somov".
-
The tasks of the expedition: - conducting complex hydrometeorological observations in the spring-summer period in the Arctic basin of the Arctic Ocean; - obtaining data on the morphometry of the ice cover, the physical and mechanical properties of ice; - study of hydrometeorological and oceanographic conditions.
-
This dataset is included the following parameters: Meteorological: air tTemperature,humidity,pressure,wind speed,wind direction. Hydrology: temperature,salinity,density. Hydrochemistry: oxygen,phosphate,silicate,oxygen,pH,alkalinity.
-
Measurements data on "North Pole-36" station.This dataset is included the following hydrology parameters:temperature,salinity,density. Meteorological parameters: wind direction,wind speed,air temperature,visibility,air pressure,humidity,cloud cover,cloud cover of the form,ice:type,ice:form,ice:concentration.
-
This dataset is included the following parameters: water temperature, sound velocity in the water body .
-
Data of the 27th cruise of the research vessel "Akademik Fyodorov ".
-

Units: umol/l. Method: spatial interpolation produced with DIVA (Data-Interpolating Variational Analysis). URL: http://modb.oce.ulg.ac.be/DIVA. Comment: Every year of the time dimension corresponds to a 10-year centred average for each season : - winter season (December-February), - spring (March-May), - summer (June-August), - autumn (September-November). Diva settings: Snr=1.0, CL=0.7
-

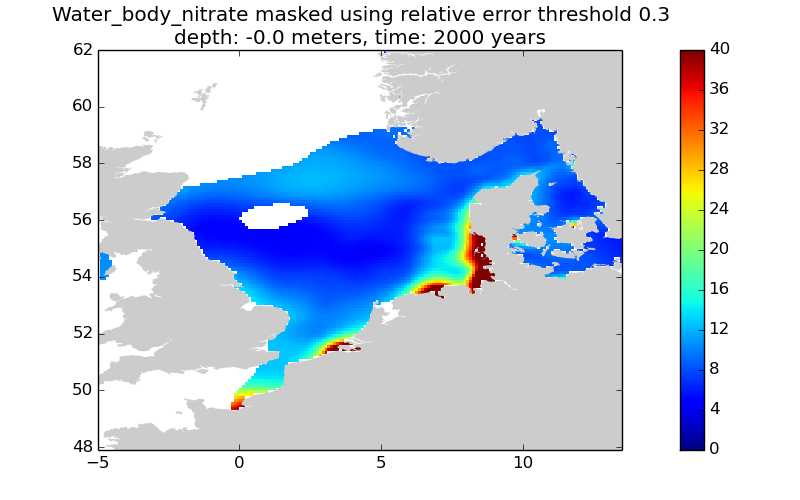
This gridded product visualizes 1960 - 2014 water body nitrate concentration (umol/l) in the North Sea domain, for each season (winter: December – February; spring: March – May; summer: June – August; autumn: September – November). It is produced as a Diva 4D analysis, version 4.6.9: a reference field of all seasonal data between 1960-2014 was used; results were logit transformed to avoid negative/underestimated values in the interpolated results; error threshold masks L1 (0.3) and L2 (0.5) are included as well as the unmasked field. Every step of the time dimension corresponds to a 10-year moving average for each season. The depth dimension allows visualizing the gridded field at various depths.
 Arctic SDI catalogue