 Arctic SDI catalogue
State Agency for Environment, Nature and Geology, Mecklenburg-Vorpommern
Type of resources
Available actions
Topics
Keywords
Contact for the resource
Provided by
Years
Formats
Scale
Resolution
-

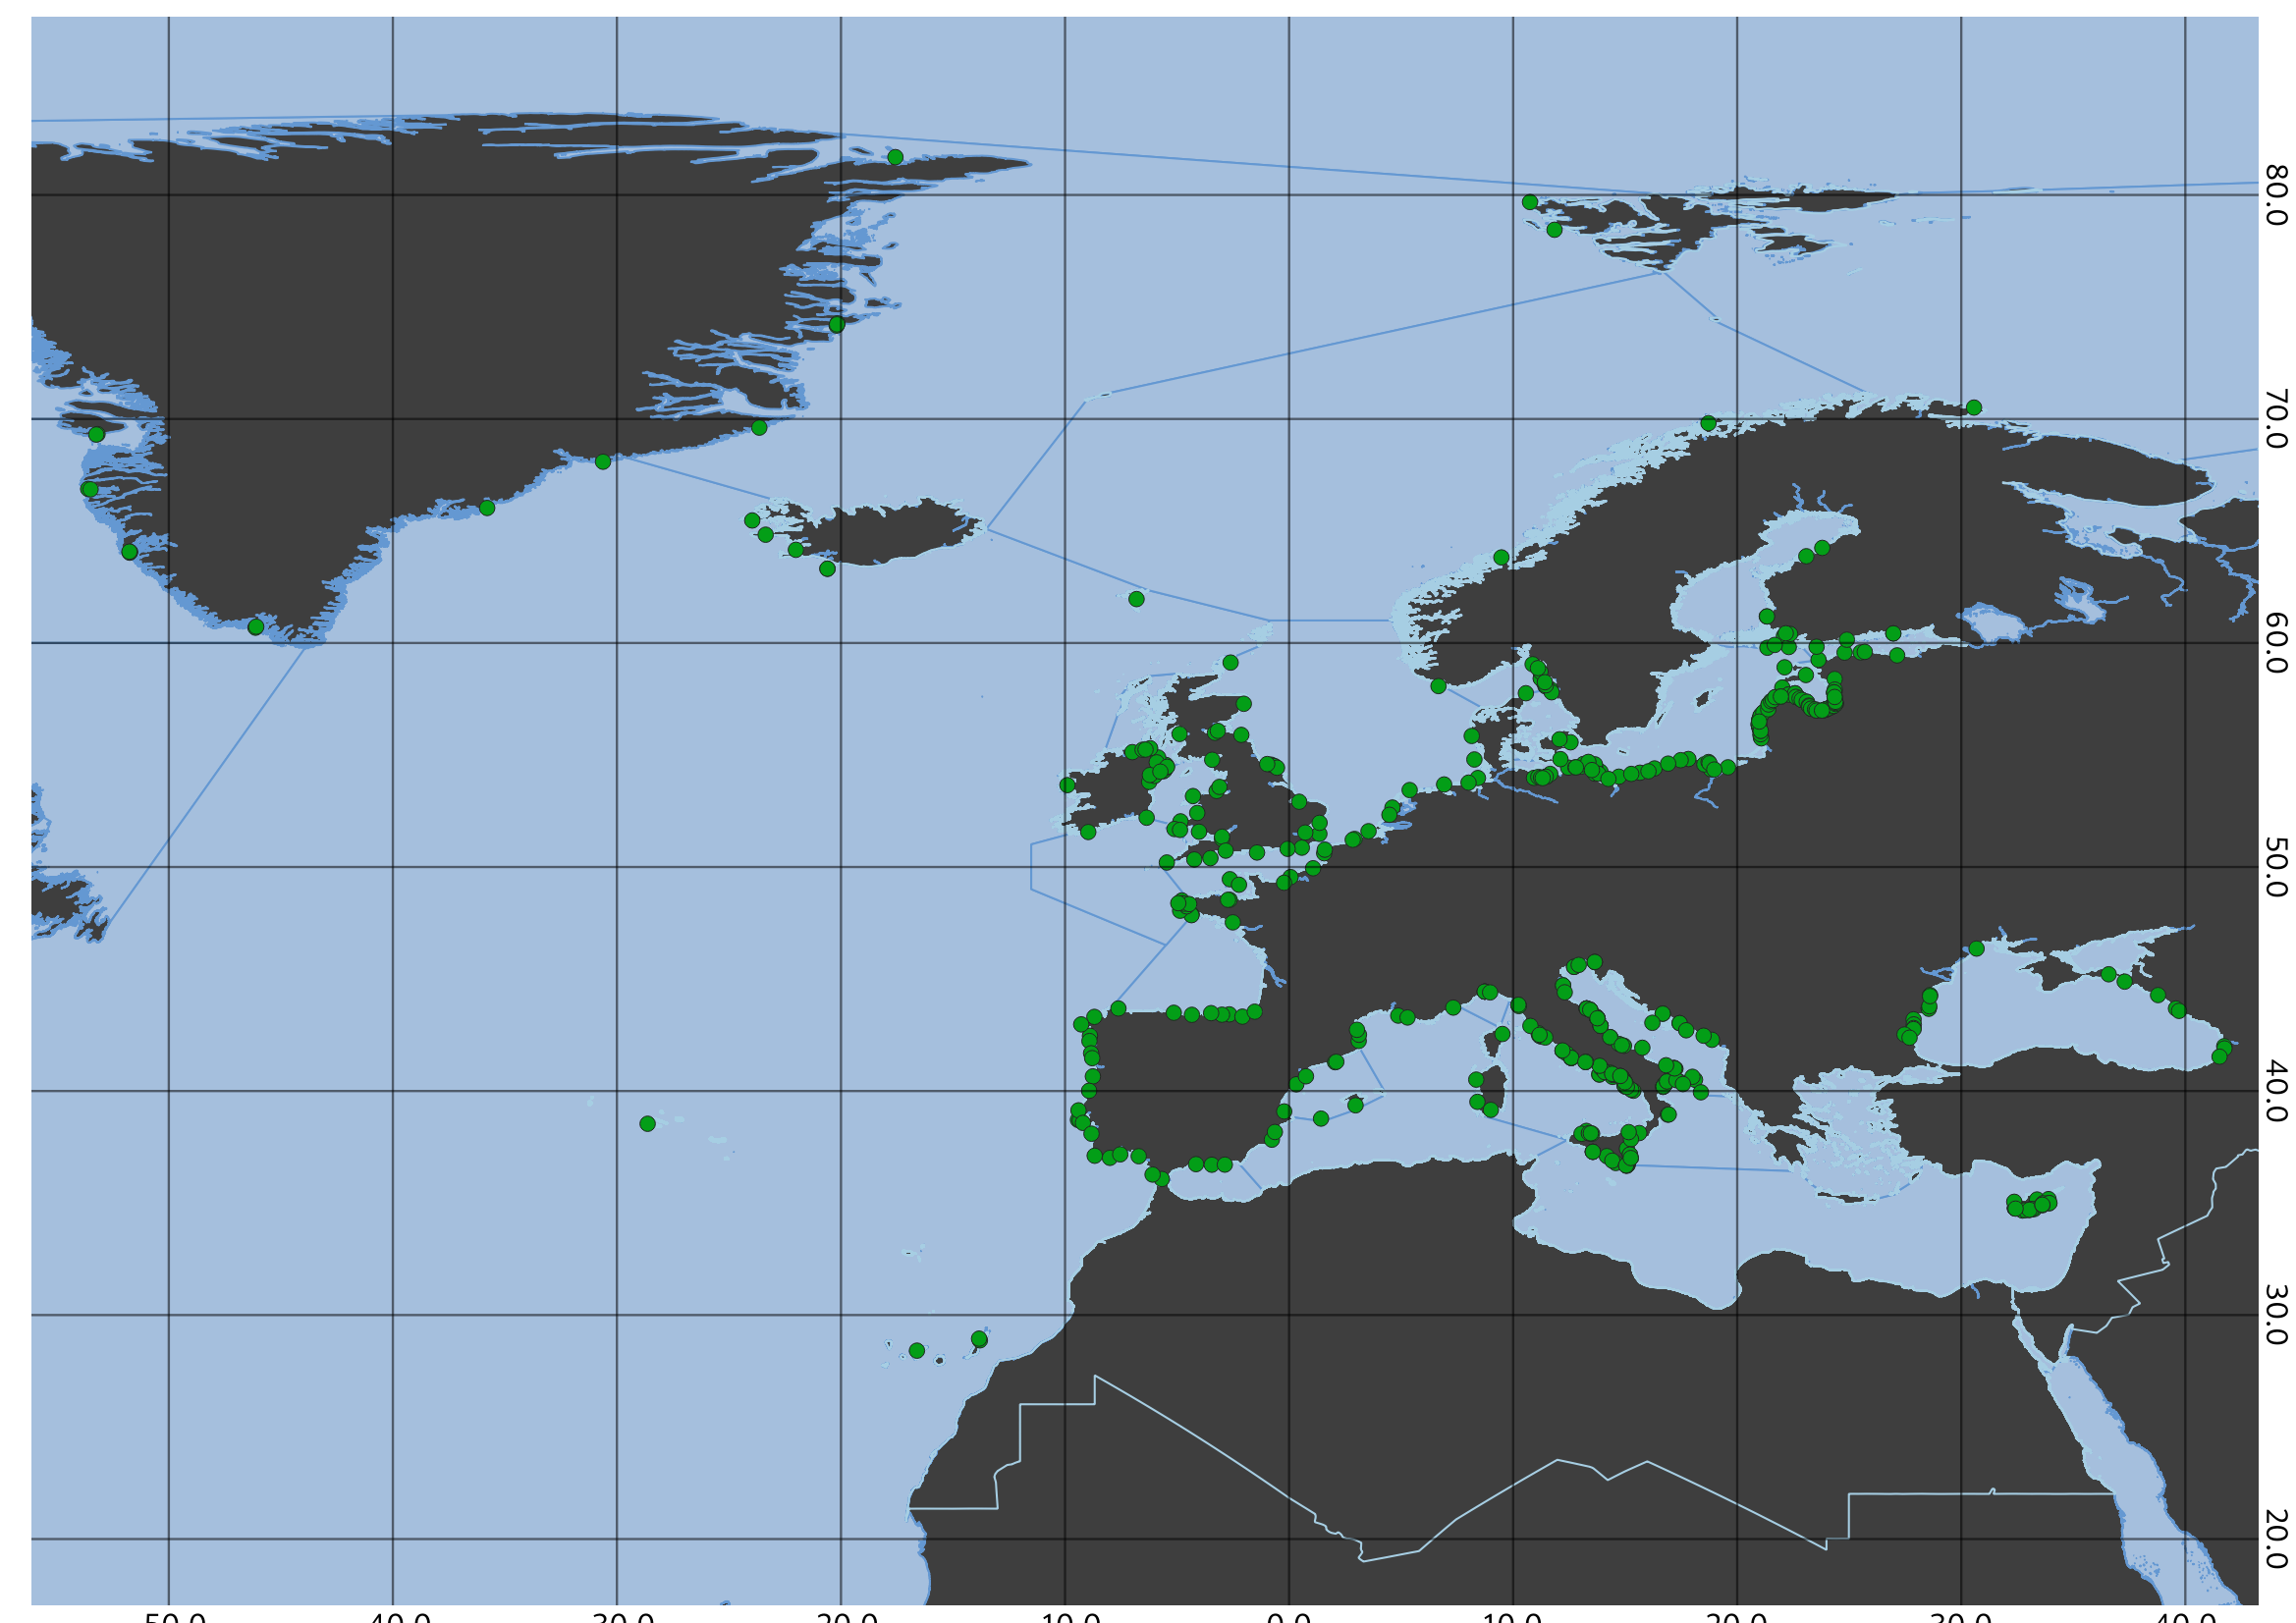
EMODnet Chemistry aims to provide access to marine chemistry data sets and derived data products concerning eutrophication, acidity and contaminants. The chemicals chosen reflect importance to the Marine Strategy Framework Directive (MSFD). ITS-90 water temperature and Water body salinity variables have been also included (as-is) to complete the Eutrophication and Acidity data. This aggregated dataset contains all unrestricted EMODnet Chemistry data on Eutrophication and Acidity (12 parameters with quality flag indicators), and covers the Baltic Sea with 187597 CDI stations. Data were aggregated and quality controlled by "Swedish Meteorological and Hydrological Institute (SMHI)" from Sweden. Regional datasets concerning eutrophication and acidity are automatically harvested and resulting collections are aggregated and quality controlled using ODV Software and following a common methodology for all Sea Regions ( https://doi.org/10.6092/9f75ad8a-ca32-4a72-bf69-167119b2cc12). When not present in original data, Water body nitrate plus nitrite was calculated by summing up the Nitrates and Nitrites. Same procedure was applied for Water body dissolved inorganic nitrogen (DIN) which was calculated by summing up the Nitrates, Nitrites and Ammonium. Parameter names are based on P35, EMODnet Chemistry aggregated parameter names vocabulary, which is available at: https://www.bodc.ac.uk/resources/vocabularies/vocabulary_search/P35/ Detailed documentation is available at: https://doi.org/10.6092/ec8207ef-ed81-4ee5-bf48-e26ff16bf02e The aggregated dataset can be downloaded as ODV worksheet, which is composed of metadata header followed by tab separated values. This worksheet can be imported to ODV Software for visualisation (More information can be found at: https://www.seadatanet.org/Software/ODV ) The original datasets can be searched and downloaded from EMODnet Chemistry Download Service: https://emodnet-chemistry.maris.nl/search
-
EMODnet Chemistry aims to provide access to marine chemistry data sets and derived data products concerning eutrophication, ocean acidification, contaminants and litter. The chosen parameters are relevant for the Marine Strategy Framework Directive (MSFD), in particular for descriptors 5, 8, 9 and 10. The dataset contains standardized, harmonized and validated data collections from beach litter (official monitoring and other sources). Datasets concerning beach and seafloor litter data are loaded in a central database after a semi-automated validation phase. Once loaded, a data assessment is performed in order to check data consistency and potential errors are corrected thanks to a feedback loop with data originators. For beach litter, the harmonized datasets contain all unrestricted EMODnet Chemistry data on beach litter data, including 6503 CDI records, in which 6199 refer monitoring data and 304 to other sources (cleaning and research). The temporal range for monitoring data is from 2001-01-01 to 2018-07-26 and include data from 311 beaches. For data from other sources, the temporal range is from 2014-05-10 to 2017-05-12 and include 226 beaches. EMODnet beach litter data and databases are hosted and maintained by ‘Istituto Nazionale di Oceanografia e di Geofisica Sperimentale, Division of Oceanography (OGS/NODC) from Italy. Data are formatted following Guidelines and forms for gathering marine litter data, which can be found at: https://doi.org/10.6092/15c0d34c-a01a-4091-91ac-7c4f561ab508. The updated lists of admitted values are available in https://nodc.ogs.it/marinelitter/vocab. The harmonized datasets can be downloaded as EMODnet Beach litter data format Version 1.0, which is a spreadsheet file composed of 4 sheets: beach metadata, survey metadata, animals and litter. The original datasets can be searched and downloaded from EMODnet Chemistry Chemistry CDI Data and Discovery Access Service: https://emodnet-chemistry.maris.nl/search
-
Units: umol/l. Method: spatial interpolation produced with DIVA (Data-Interpolating Variational Analysis). URL: http://modb.oce.ulg.ac.be/DIVA. Comment: Every year of the time dimension corresponds to a 10-year centred average for each season : - winter season (December-February), - spring (March-May), - summer (June-August), - autumn (September-November).
-
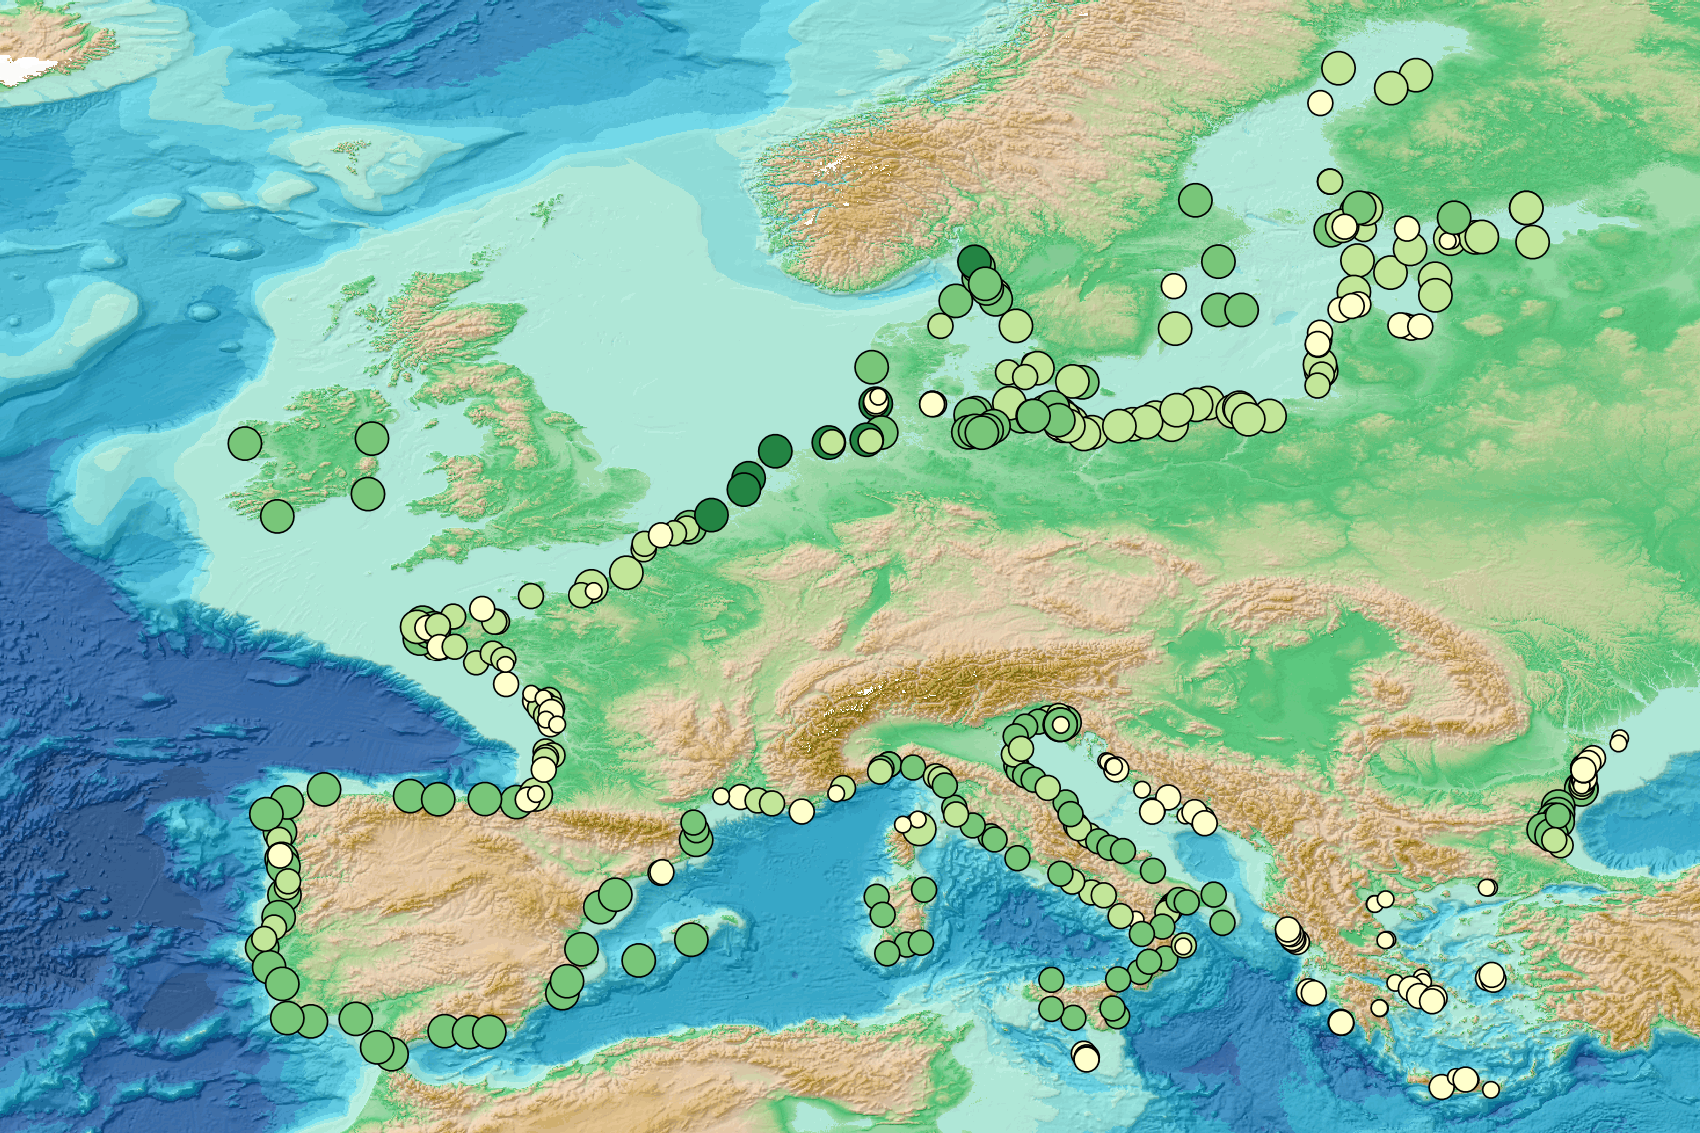
This visualization product displays the single use plastics (SUP) related items abundance of marine macro-litter (> 2.5cm) per beach per year from Marine Strategy Framework Directive (MSFD) monitoring surveys. EMODnet Chemistry included the collection of marine litter in its 3rd phase. Since the beginning of 2018, data of beach litter have been gathered and processed in the EMODnet Chemistry Marine Litter Database (MLDB). The harmonization of all the data has been the most challenging task considering the heterogeneity of the data sources, sampling protocols and reference lists used on a European scale. Preliminary processing were necessary to harmonize all the data: - Exclusion of OSPAR 1000 protocol: in order to follow the approach of OSPAR that it is not including these data anymore in the monitoring; - Selection of MSFD surveys only (exclusion of other monitoring, cleaning and research operations); - Exclusion of beaches without coordinates; - Selection of SUP related items only. The list of selected items is attached to this metadata. This list was created using EU Marine Beach Litter Baselines for Macro Litter on Coastlines from JRC (this document is attached to this metadata); - Normalization of survey lengths to 100m & 1 survey / year: in some case, the survey length was not exactly 100m, so in order to be able to compare the abundance of litter from different beaches a normalization is applied using this formula: Number of SUP items of the survey (normalized by 100 m) = Number of SUP related items of the survey x (100 / survey length) Then, this normalized number of¨SUP related items is summed to obtain the total normalized number of SUP related items for each survey. Finally, the median abundance of SUP related items for each beach and year is calculated from these normalized abundances of SUP related items per survey. Sometimes the survey length was null or equal to 0. Assuming that the MSFD protocol has been applied, the length has been set at 100m in these cases. Percentiles 50, 75, 95 & 99 have been calculated taking into account SUP related items from MSFD data for all years. More information is available in the attached documents. Warning: the absence of data on the map doesn't necessarily mean that they don't exist, but that no information has been entered in the Marine Litter Database for this area.
-
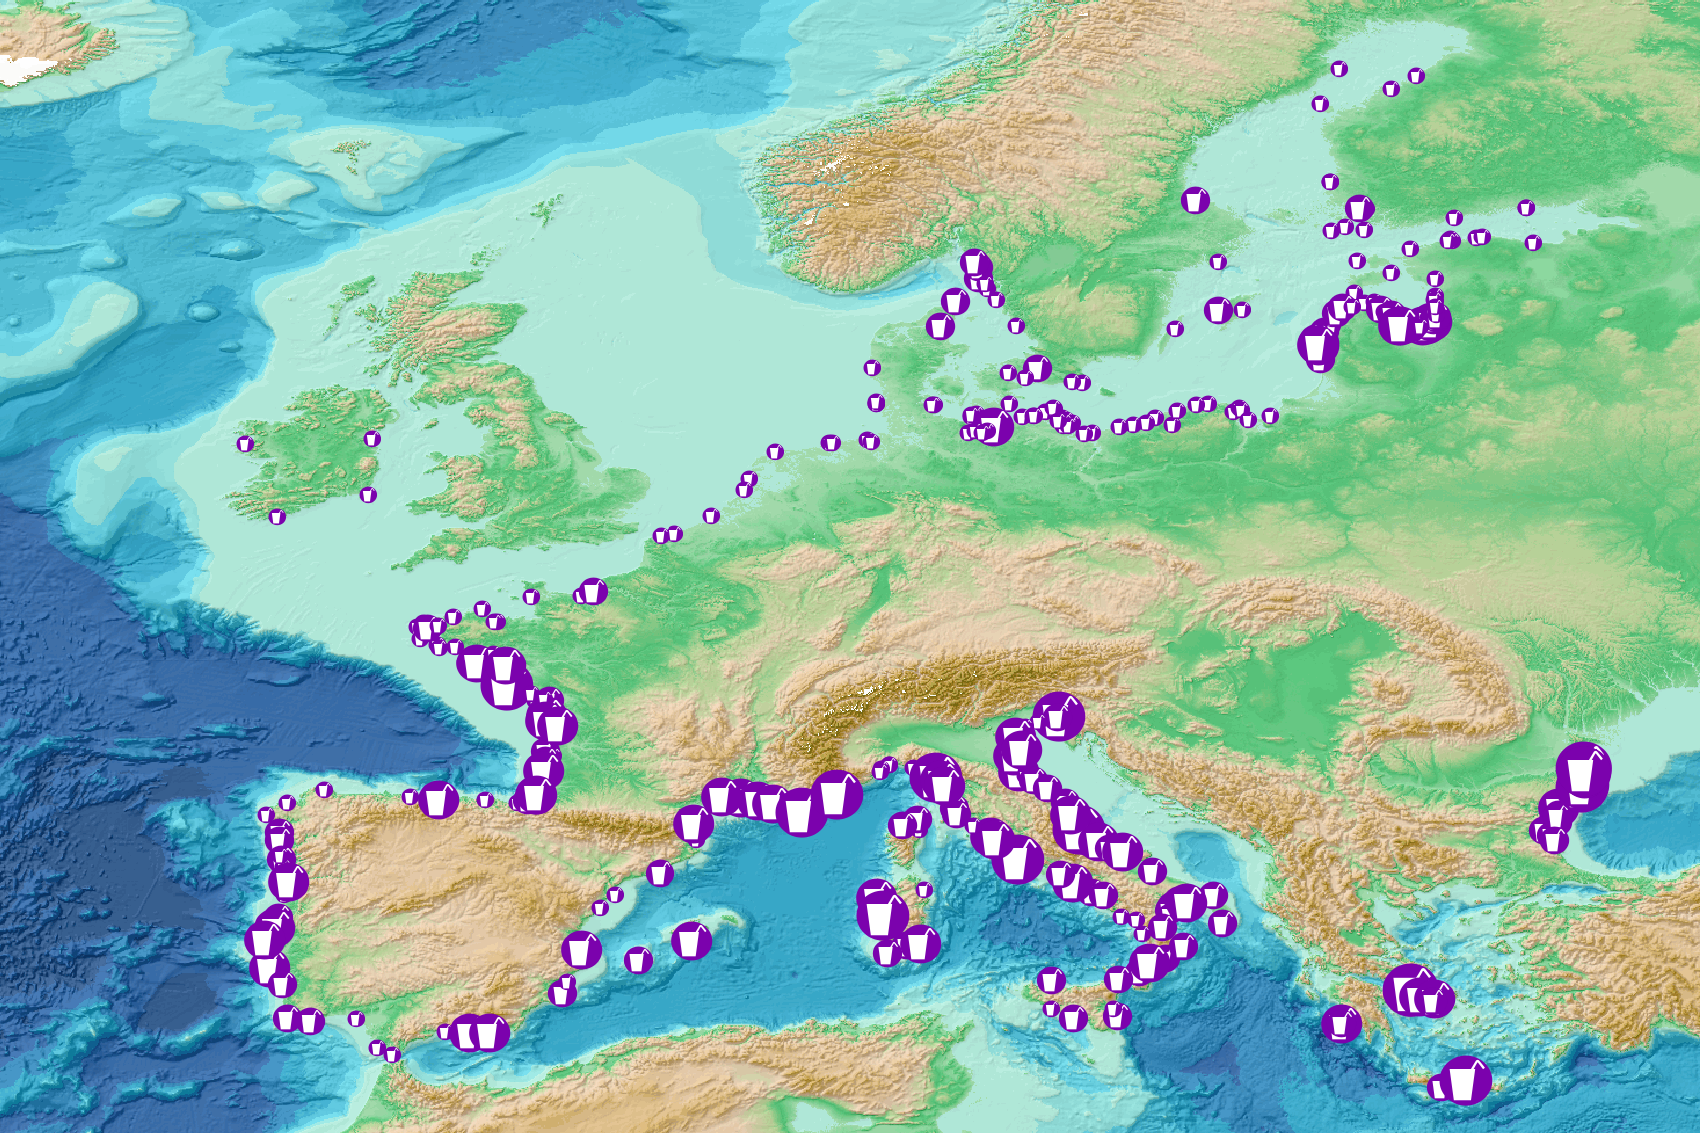
This visualization product displays the number of Marine Strategy Framework Directive (MSFD) monitoring surveys and the associated temporal coverage per beach. EMODnet Chemistry included the collection of marine litter in its 3rd phase. Since the beginning of 2018, data of beach litter have been gathered and processed in the EMODnet Chemistry Marine Litter Database (MLDB). The harmonization of all the data has been the most challenging task considering the heterogeneity of the data sources, sampling protocols and reference lists used on a European scale. Preliminary processing were necessary to harmonize all the data: - Exclusion of OSPAR 1000 protocol: in order to follow the approach of OSPAR that it is not including these data anymore in the monitoring; - Selection of MSFD surveys only (exclusion of other monitoring, cleaning and research operations); - Exclusion of beaches without coordinates. More information is available in the attached documents. Warning: the absence of data on the map doesn't necessarily mean that they don't exist, but that no information has been entered in the Marine Litter Database for this area.
-
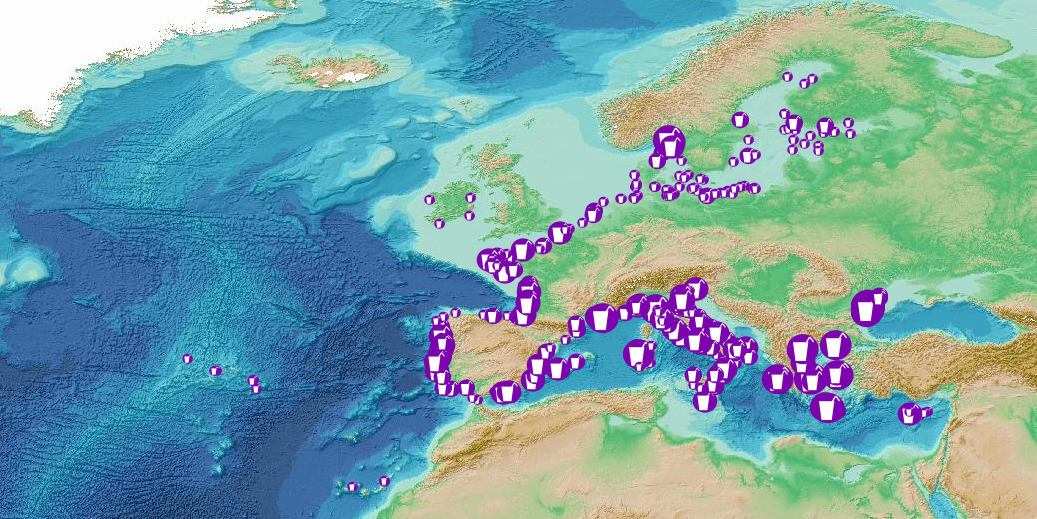
This visualization product displays the single use plastics (SUP) related items abundance of marine macro-litter (> 2.5cm) per beach per year from Marine Strategy Framework Directive (MSFD) monitoring surveys. EMODnet Chemistry included the collection of marine litter in its 3rd phase. Since the beginning of 2018, data of beach litter have been gathered and processed in the EMODnet Chemistry Marine Litter Database (MLDB). The harmonization of all the data has been the most challenging task considering the heterogeneity of the data sources, sampling protocols and reference lists used on a European scale. Preliminary processing were necessary to harmonize all the data: - Exclusion of OSPAR 1000 protocol: in order to follow the approach of OSPAR that it is not including these data anymore in the monitoring; - Selection of MSFD surveys only (exclusion of other monitoring, cleaning and research operations); - Exclusion of beaches without coordinates; - Selection of SUP related items only. The list of selected items is attached to this metadata. This list was created using EU Marine Beach Litter Baselines for Macro Litter on Coastlines from JRC (this document is attached to this metadata); - Normalization of survey lengths to 100m & 1 survey / year: in some case, the survey length was not exactly 100m, so in order to be able to compare the abundance of litter from different beaches a normalization is applied using this formula: Number of SUP items of the survey (normalized by 100 m) = Number of SUP related items of the survey x (100 / survey length) Then, this normalized number of¨SUP related items is summed to obtain the total normalized number of SUP related items for each survey. Finally, the median abundance of SUP related items for each beach and year is calculated from these normalized abundances of SUP related items per survey. Sometimes the survey length was null or equal to 0. Assuming that the MSFD protocol has been applied, the length has been set at 100m in these cases. Percentiles 50, 75, 95 & 99 have been calculated taking into account SUP related items from MSFD data for all years. More information is available in the attached documents. Warning: the absence of data on the map doesn't necessarily mean that they don't exist, but that no information has been entered in the Marine Litter Database for this area.
-
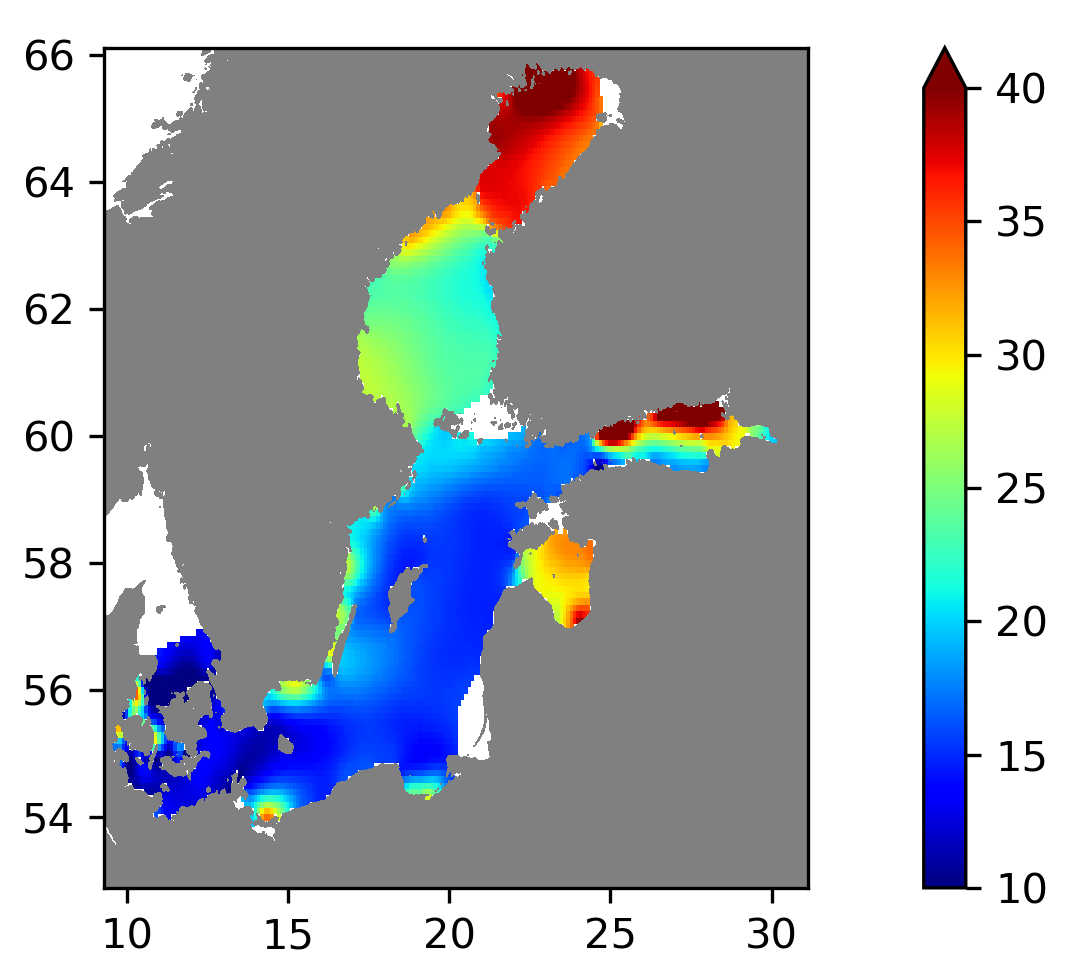
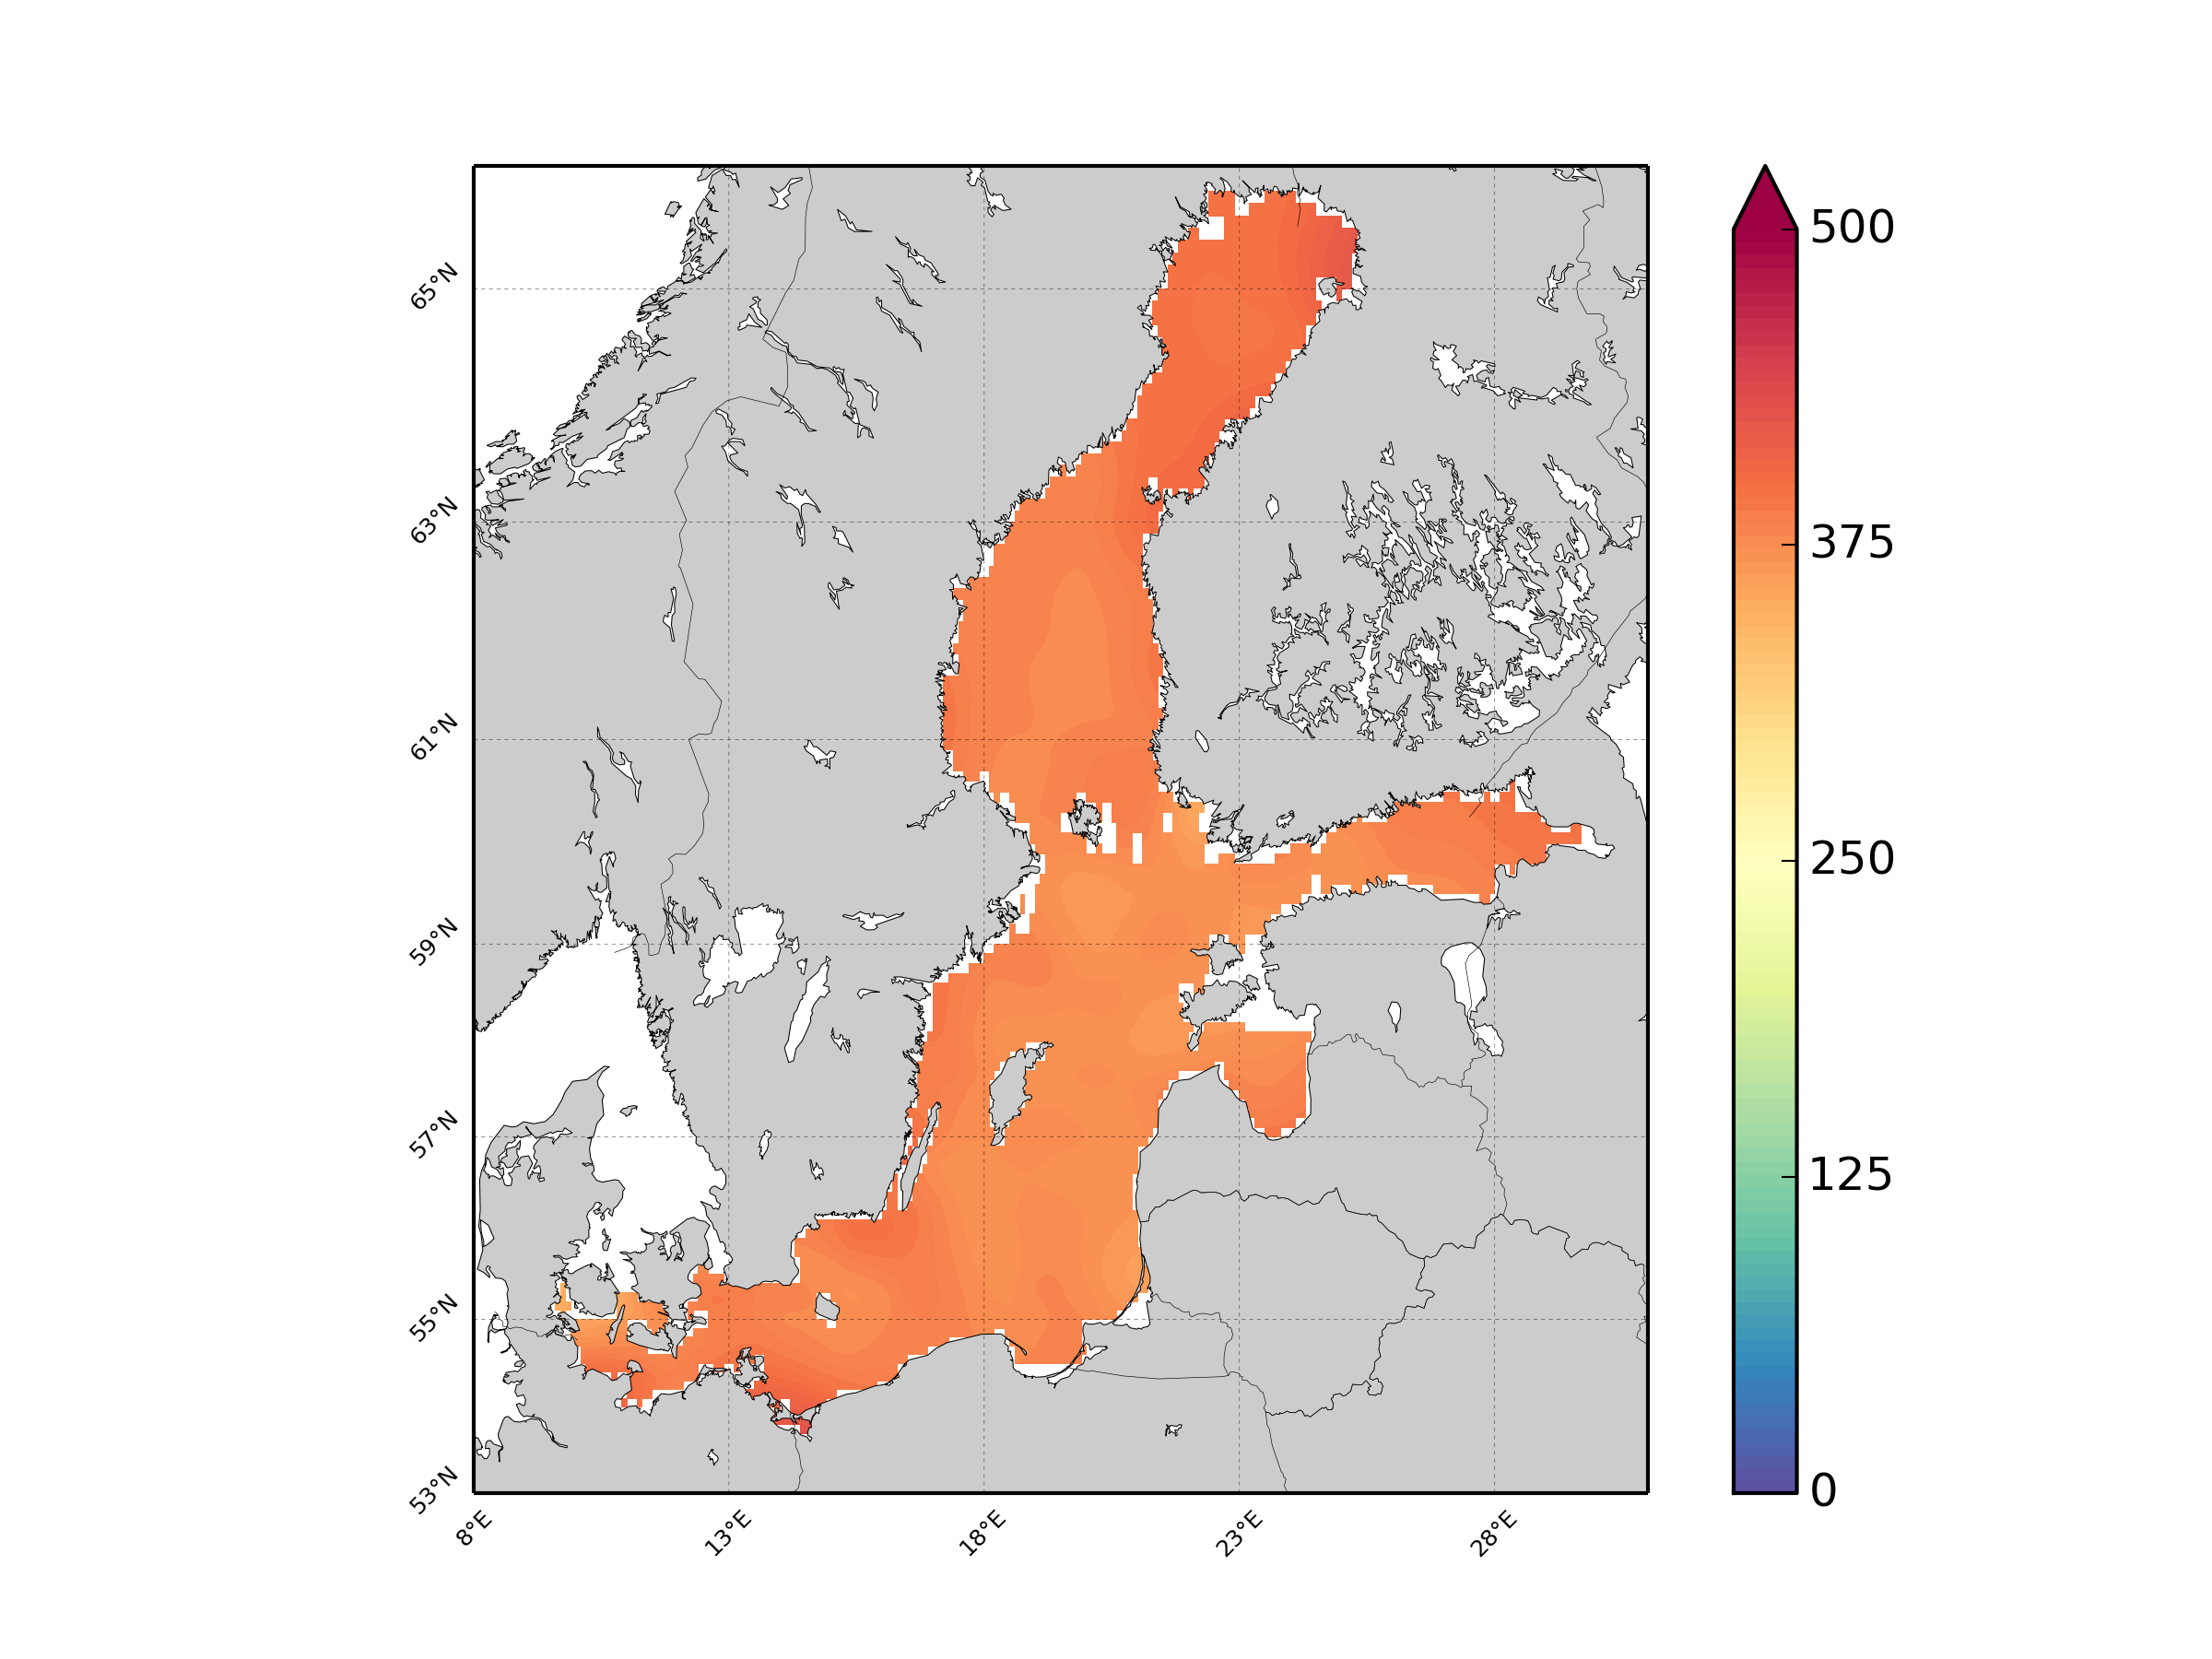
Running 6-year analysis of Water body silicate in the Baltic Sea. Four seasons (March-May, June-August, September-November, December-February). Every year of the time dimension corresponds to a 6-year centred average. Periods span between 1965-2021. Analyses for depths (m) (HELCOM standard depths): 0, 5, 10, 15, 20, 30, 40, 50, 60, 70, 80, 90, 100, 125, 150, 175, 200, 225, 250, 275, 300. Data Sources: observational data from SeaDataNet/EMODnet Chemistry Data Network. Description of DIVA analysis: Geostatistical data analysis by DIVAnd (Data-Interpolating Variational Analysis in n dimensions) tool. GEBCO_08 Grid (30 arc-seconds) topography is used for the contouring preparation. Files contain analysed fields, error fields and combined field with the deepest value for each grid point selected. Also pre-masked fields using relative error threshold 0.3 and 0.5 are included. In the analyses the horizontal correlation length is fixed to 80 km and decreasing towards the coastline, the vertical correlation length is varying with depth. Signal to noise ratio is fixed to 1.0. Background fields were created using data for the given time period and season. Log transformation was used in the analyses. No detrending, advection constraints or weighting are applied. Unit is umol/l.
-
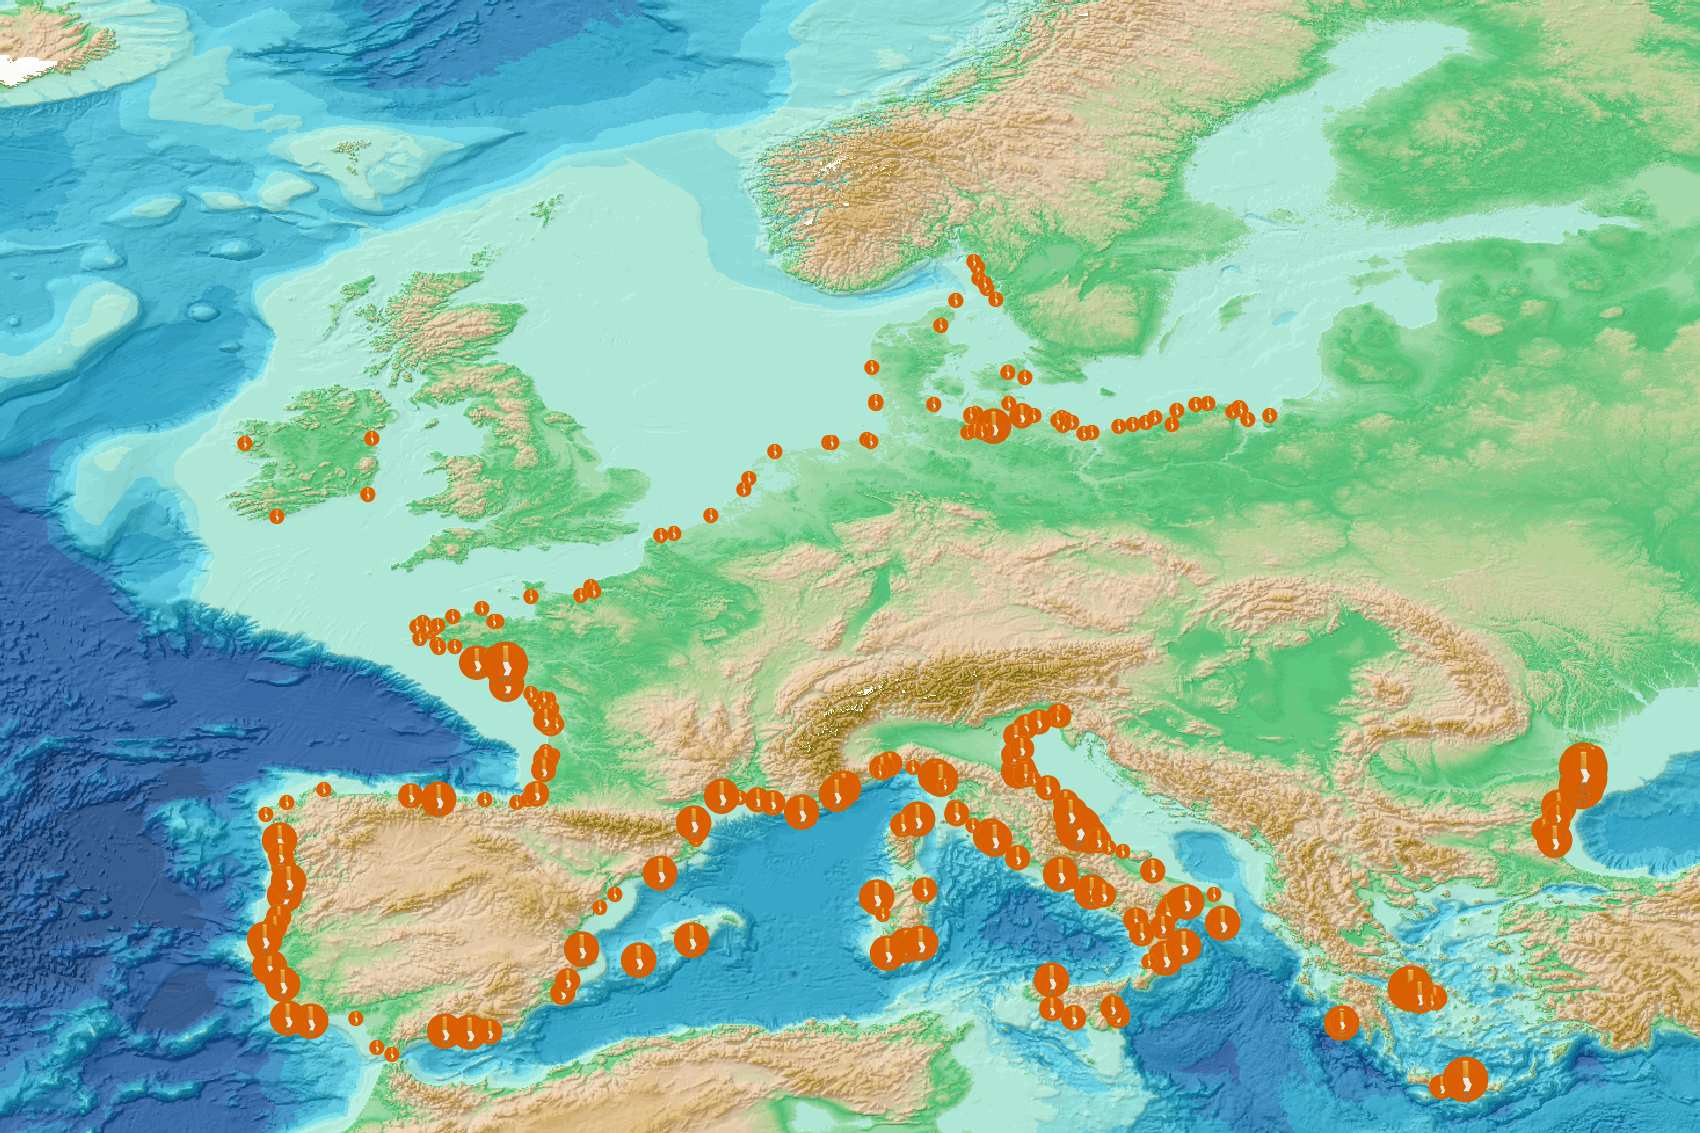
This visualization product displays the cigarette related items abundance of marine macro-litter (> 2.5cm) per beach per year from Marine Strategy Framework Directive (MSFD) monitoring surveys without UNEP-MARLIN data. EMODnet Chemistry included the collection of marine litter in its 3rd phase. Since the beginning of 2018, data of beach litter have been gathered and processed in the EMODnet Chemistry Marine Litter Database (MLDB). The harmonization of all the data has been the most challenging task considering the heterogeneity of the data sources, sampling protocols and reference lists used on a European scale. Preliminary processing were necessary to harmonize all the data: - Exclusion of OSPAR 1000 protocol: in order to follow the approach of OSPAR that it is not including these data anymore in the monitoring; - Selection of MSFD surveys only (exclusion of other monitoring, cleaning and research operations); - Exclusion of beaches without coordinates; - Selection of cigarette related items only. The list of selected items is attached to this metadata. This list was created using EU Marine Beach Litter Baselines and EU Threshold Value for Macro Litter on Coastlines from JRC (these two documents are attached to this metadata); - Exclusion of surveys referring to the UNEP-MARLIN list: the UNEP-MARLIN protocol differs from the other types of monitoring in that cigarette butts are surveyed in a 10m square. To avoid comparing abundances from very different protocols, the choice has been made to distinguish in two maps the cigarette related items results associated with the UNEP-MARLIN list from the others; - Normalization of survey lengths to 100m & 1 survey / year: in some case, the survey length was not exactly 100m, so in order to be able to compare the abundance of litter from different beaches a normalization is applied using this formula: Number of cigarette related items of the survey (normalized by 100 m) = Number of cigarette related items of the survey x (100 / survey length) Then, this normalized number of cigarette related items is summed to obtain the total normalized number of cigarette related items for each survey. Finally, the median abundance of cigarette related items for each beach and year is calculated from these normalized abundances of cigarette related items per survey. Sometimes the survey length was null or equal to 0. Assuming that the MSFD protocol has been applied, the length has been set at 100m in these cases. Percentiles 50, 75, 95 & 99 have been calculated taking into account cigarette related items from MSFD monitoring data (excluding UNEP-MARLIN protocol) for all years. More information is available in the attached documents. Warning: the absence of data on the map doesn't necessarily mean that they don't exist, but that no information has been entered in the Marine Litter Database for this area.
-
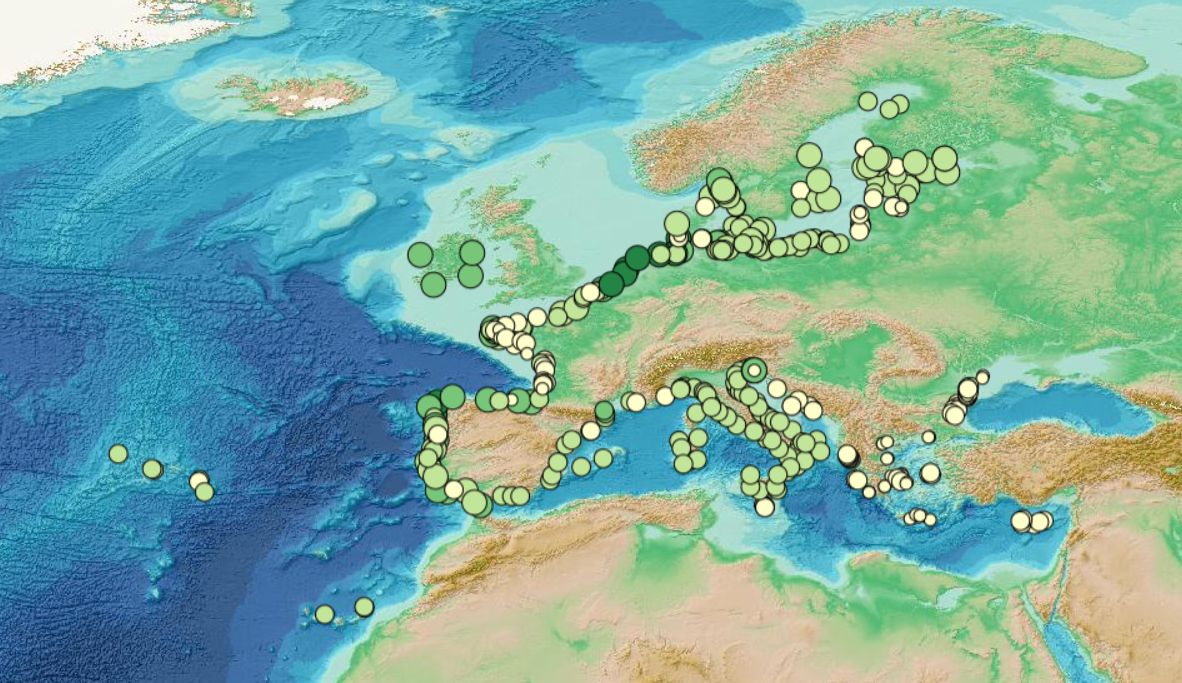
This visualization product displays the number of Marine Strategy Framework Directive (MSFD) monitoring surveys and the associated temporal coverage per beach. EMODnet Chemistry included the collection of marine litter in its 3rd phase. Since the beginning of 2018, data of beach litter have been gathered and processed in the EMODnet Chemistry Marine Litter Database (MLDB). The harmonization of all the data has been the most challenging task considering the heterogeneity of the data sources, sampling protocols and reference lists used on a European scale. Preliminary processing were necessary to harmonize all the data: - Exclusion of OSPAR 1000 protocol: in order to follow the approach of OSPAR that it is not including these data anymore in the monitoring; - Selection of MSFD surveys only (exclusion of other monitoring, cleaning and research operations); - Exclusion of beaches without coordinates. More information is available in the attached documents. Warning: the absence of data on the map doesn't necessarily mean that they don't exist, but that no information has been entered in the Marine Litter Database for this area.
-
Moving 6-year analysis of Water body silicate in the Baltic Sea. Four seasons (March-May, June-August, September-November, December-February). Every year of the time dimension corresponds to a 6-year centred average. Periods span between 1980-1985 and 2013-2018. Analyses for depths (m) (HELCOM standard depths): 0, 5, 10, 15, 20, 30, 40, 50, 60, 70, 80, 90, 100, 125, 150, 175, 200, 225, 250, 275, 300. Data Sources: observational data from SeaDataNet/EMODnet Chemistry Data Network. Description of DIVA analysis: Geostatistical data analysis by DIVA (Data-Interpolating Variational Analysis) tool. GEBCO Grid (30 arc-seconds) topography is used for the contouring preparation. Files contain analysed fields, error fields and combined field with the deepest value for each grid point selected. Also pre-masked fields using relative error threshold 0.3 and 0.5 are included. In the analyses the Correlation length in the horizontal direction were fixed to 80 km and in the vertical direction to 25 m. Signal to noise ratio were fixed to 1.0. Background fields were created using data for the given time period and season. Log transformation was used in the analyses. No detrending, advection constraints or weighting are applied. Unit is umol/l.