 Arctic SDI catalogue
Cultures fourragères
Type of resources
Keywords
Contact for the resource
Provided by
Years
Formats
Representation types
Update frequencies
status
Service types
-
The Grassland Inventory provides a standardized, high-resolution land cover classification for the grassland ecosystems in Canada. Developed using a random forest classification on multi-temporal Sentinel-1 SAR and Sentinel-2 Optical imagery, the series differentiates intact native grasslands from high-disturbance, tame perennial forage systems; two classes that are spectrally and phenologically similar, yet critical to differentiate and quantify accurately for carbon and biodiversity modelling. Each release in the series includes a categorical 10 m land cover raster and a companion continuous likelihood layer representing model confidence in the native grassland class. As new classifications are added (semi-decadal) and geographic extent increased, the series will enable consistent temporal comparisons to track grassland dynamics and land cover change to support operational and research applications within AAFC and stakeholders.
-

In 2016, the Earth Observation Team of the Science and Technology Branch (STB) at Agriculture and Agri-Food Canada (AAFC) repeated the process of generating annual crop inventory digital maps using satellite imagery to for all of Canada, in support of a national crop inventory. A Decision Tree (DT) based methodology was applied using optical (Landsat-8, Sentinel-2, Gaofen-1) and radar (RADARSAT-2) based satellite images, and having a final spatial resolution of 30m. In conjunction with satellite acquisitions, ground-truth information was provided by: provincial crop insurance companies in Alberta, Saskatchewan, Manitoba, & Quebec; point observations from the BC Ministry of Agriculture, & the Ontario Ministry of Agriculture, Food and Rural Affairs; and data collection supported by our regional AAFC Research and Development Centres in St. John’s, Kentville, Charlottetown, Fredericton, Guelph, and Summerland.
-
The Agriculture and Agri-Food Canada (AAFC) Annual Crop Inventory (ACI) is produced at a national scale, covering Canada’s entire agricultural extent. It has been generated operationally since 2011 for the entire country (2009 for the Prairie Provinces). This product is spatially continuous and maps the most probable crop type for every field in Canada, along with the land cover of non-agricultural lands (e.g. wetlands, forest, urban, etc.). It allows AAFC to study and model crop rotation patterns at the field level. To develop the Quantitative Crop Rotation Characteristics of Canada, historical ACI data representing the time series of crops at agricultural field level with annual intervals were applied. They provided the time series of categories of crops for statistical analyses. The results of this work included spatial data sets with several calculated attributes representing crop rotation statistical characteristics. Specifically, a crop sequence turbulence index was shown to be an efficient quantitative measure of mapping the spatial distribution of the sustainability of crop rotation in regions where dominantly annual crops were the active crop rotation. In addition, based on characteristics of observed crops in their time series sequence and the quantitative sequence dynamics represented by the turbulence index, major spatial clusters of crop rotation styles were calculated. To analyze the turbulence index, crop rotation cluster class representing the general style of crop rotation must also be considered. The crop rotation quantitative attributes calculated in this project which are at the field level, can be converted into useful information directing us towards the health and sustainability of crop rotations.
-

In 2022, the Earth Observation Team of the Science and Technology Branch (STB) at Agriculture and Agri-Food Canada (AAFC) repeated the process of generating annual crop inventory digital maps using satellite imagery for all Canadian provinces, in support of a national crop inventory. New this year, a map of the agricultural regions in the Yukon Territory was also produced. A Decision Tree (DT) based methodology was applied using optical (Landsat-8, Landsat-9, Sentinel-2), and radar (RCM) based satellite images, and having a final spatial resolution of 30m. In conjunction with satellite acquisitions, ground-truth information was provided by: provincial crop insurance companies in Alberta, Saskatchewan, Manitoba, & Quebec; point observations from the PEI Department of Environment, Water and Climate Change; Ontario Ministry of Agriculture, Food and Rural Affairs; University of Guelph - Ridgetown campus; British Columbia Ministry of Agriculture; and data collection supported by our regional AAFC Research and Development Centres in St. John's, Kentville, Fredericton, Guelph, Summerland and Whitehorse.
-
In 2024, the Earth Observation Team of the Science and Technology Branch (STB) at Agriculture and Agri-Food Canada (AAFC) repeated the process of generating annual crop inventory digital maps using satellite imagery for all Canadian provinces and the Yukon Territory, in support of a national crop inventory. A Decision Tree (DT) based methodology was applied using optical (Landsat-8, Landsat-9, Sentinel-2), and radar (RCM) based satellite images, and having a final spatial resolution of 30m. In conjunction with satellite acquisitions, ground-truth information was provided by: provincial crop insurance companies in Alberta, Saskatchewan, Manitoba, & Quebec; point observations from the PEI Department of Environment, Water and Climate Change; and data collection supported by our regional AAFC Research and Development Centres in St. John's, Kentville, Fredericton, Guelph, Summerland and Whitehorse. Forest Fire Perimeter Estimate polygons from Natural Resources Canada’s Canadian Forest Service are used to show burned areas of landcover (Class - 60).
-
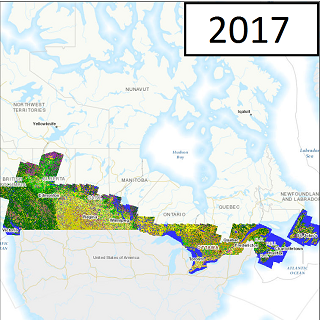
In 2017, the Earth Observation Team of the Science and Technology Branch (STB) at Agriculture and Agri-Food Canada (AAFC) repeated the process of generating annual crop inventory digital maps using satellite imagery to for all of Canada, in support of a national crop inventory. A Decision Tree (DT) based methodology was applied using optical (Landsat-8, Sentinel-2, Gaofen-1) and radar (RADARSAT-2) based satellite images, and having a final spatial resolution of 30m. In conjunction with satellite acquisitions, ground-truth information was provided by: provincial crop insurance companies in Alberta, Saskatchewan, Manitoba, & Quebec; point observations from the BC Ministry of Agriculture, & the Ontario Ministry of Agriculture, Food and Rural Affairs; and data collection supported by our regional AAFC Research and Development Centres in St. John’s, Kentville, Charlottetown, Fredericton, Guelph, and Summerland
-

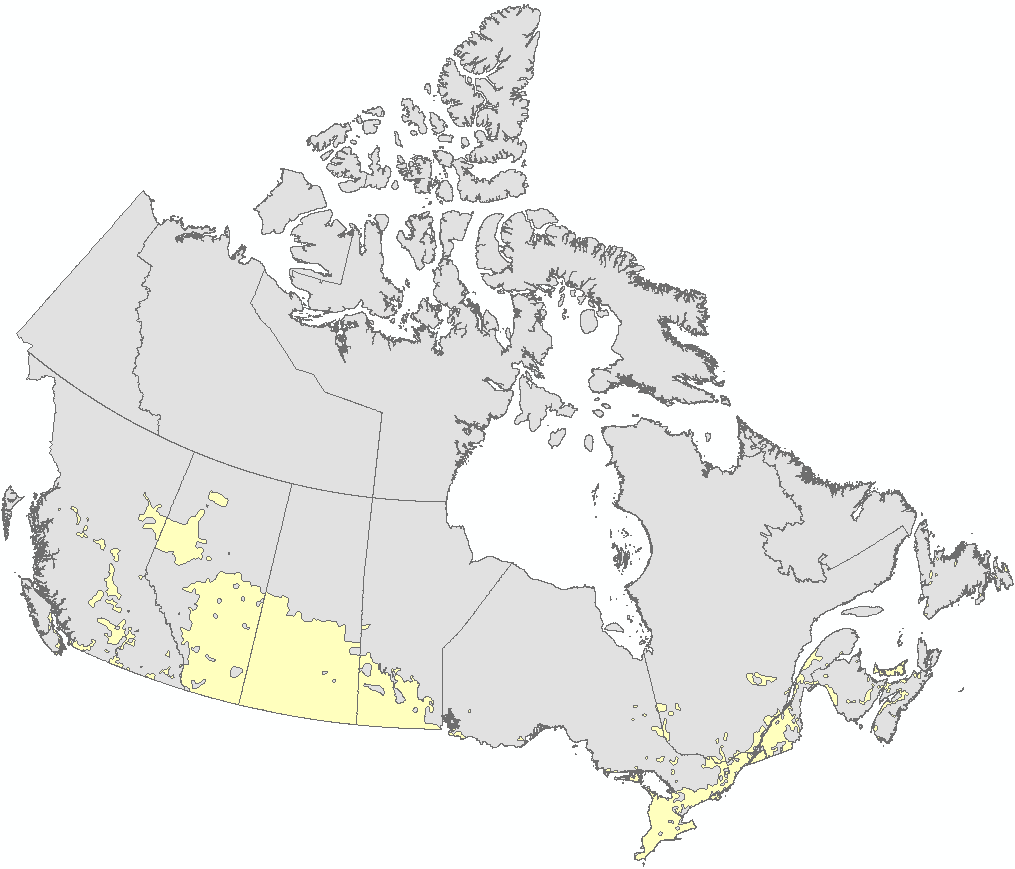
The national agricultural ecumene includes all dissemination areas with 'significant' agricultural activity. Agricultural indicators, such as the ratio of agricultural land on census farms relative to total land area, and total economic value of agricultural production, are used. Regional variations are also taken into account. The ecumene is generalized for small-scale mapping. A new version of the agricultural ecumene is generated every census years (in vector format) since 1986. This file was produced by Statistics Canada, Agriculture Division, Remote Sensing and Geospatial Analysis section, 2017, Ottawa.
-
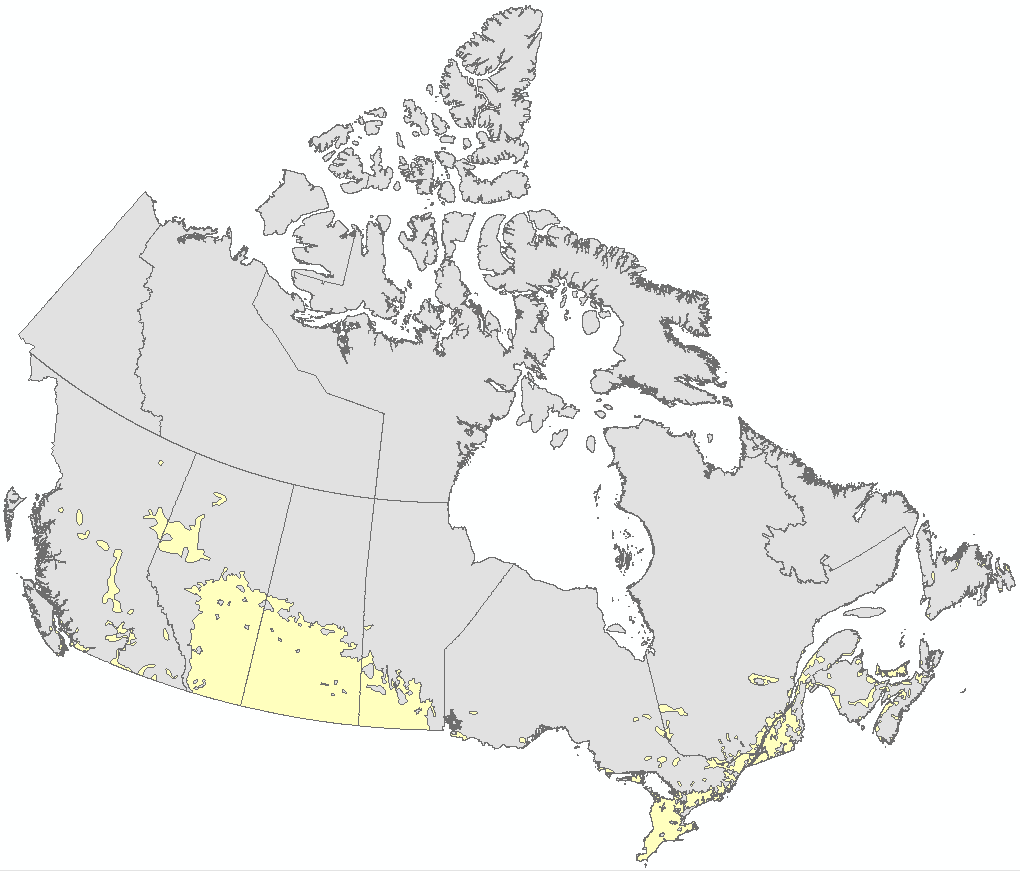
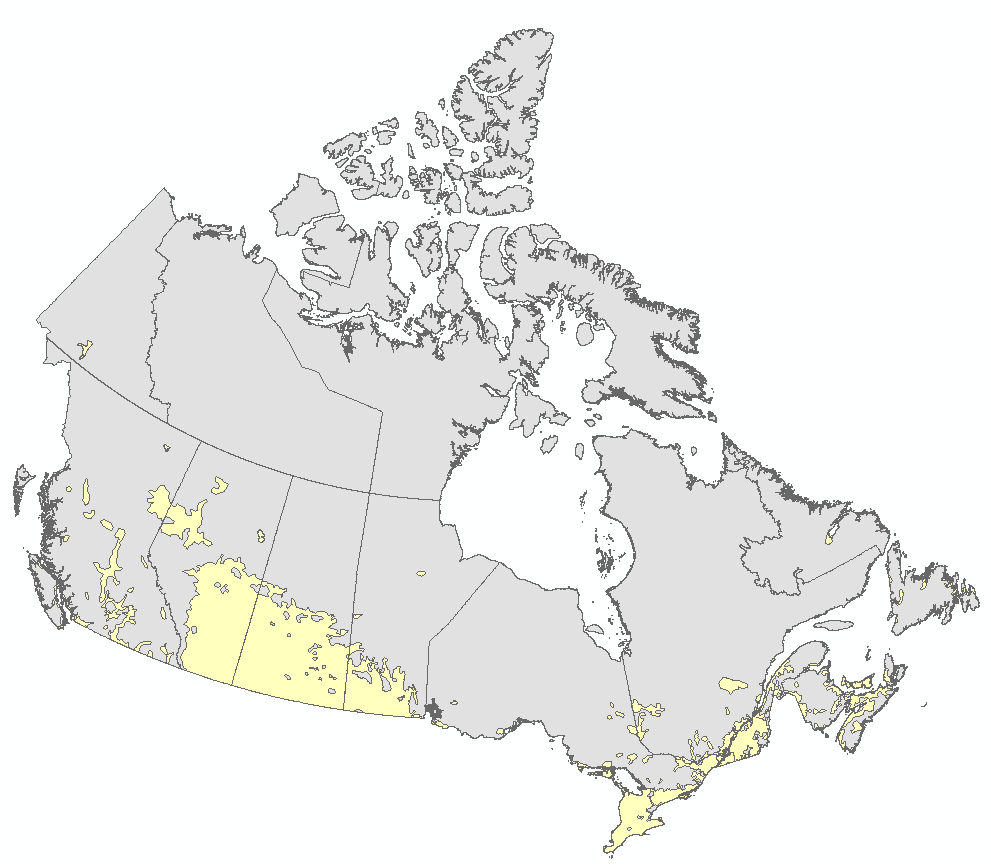
The national agricultural ecumene includes all dissemination areas with 'significant' agricultural activity. Agricultural indicators, such as the ratio of agricultural land on census farms relative to total land area, and total economic value of agricultural production, are used. Regional variations are also taken into account. The ecumene is generalized for small-scale mapping. A new version of the agricultural ecumene is generated every census years (in vector format) since 1986. This file was produced by Statistics Canada, Agriculture Division, Remote Sensing and Geospatial Analysis section, 2017, Ottawa.