 Arctic SDI catalogue
Geological maps
Type of resources
Available actions
Topics
Keywords
Contact for the resource
Provided by
Formats
Representation types
Update frequencies
status
Scale
Resolution
-

The map displays bedrock formations at or near the surface of the land, on the sea floor above the continental crust that forms the Canadian landmass, and oceanic crust surrounding the landmass. The bedrock units are grouped and coloured according to geological age and composition. The colours of offshore units and oceanic crust are paler and more generalized than those on land, although the constituent units offshore are still easily discernible from their dashed boundaries. This colour design, coupled with the use of a white buffer zone at the coast allows the coastline of Canada to be readily distinguished and still show the grand geological architecture of the Canadian landmass. The map also shows major faults that have disrupted the Earth's crust, onshore and offshore, and a variety of special geological features such as kimberlite pipes, which locally contain diamonds, impact structures suspected to have been caused by meteorites, and extinct and active spreading centres in the surrounding oceans.
-

In 1949 a magnitude 8.1 earthquake occurred on the Queen Charlotte Fault, off the west coast of the Haida Gwaii archipelago. This magnitude 8.0 scenario along the Queen Charlotte Fault is slightly different and closer to population centres than the magnitude 7.8 earthquake that occurred in 2012.
-

In 1997, a magnitude 4.6 earthquake occurred 3 to 4 km beneath the Strait of Georgia, near Vancouver. This scenario visualizes the effects of that event if it occurred today with a magnitude of 4.9. A magnitude 7.0 Georgia Strait scenario is also provided, and represents a less likely but more consequential case for comparison.
-

A magnitude 5.6 rupture scenario near Ottawa along the Gloucester Fault in the south of the city. This fault is not known to be active, but this scenario is representative of seismicity in the Ottawa Valley.
-
In 2015, a magnitude 4.7 earthquake occurred 60 km beneath Sidney, BC. This scenario visualizes the effects of that event if it had a magnitude of 7.1.
-

In September 1732 a damaging earthquake occurred immediately beneath the Island of Montréal. This scenario visualizes the effects of that event if it occurred today with a magnitude of 5.0, and represents a strong ground shaking event that could strike Montréal.
-

In 1997, a magnitude 4.6 earthquake occurred 3 to 4 km beneath the Strait of Georgia. This scenario visualizes the effects of that event if it had a magnitude of 7.0, and represents a strong ground shaking event that could strike Metro Vancouver.
-

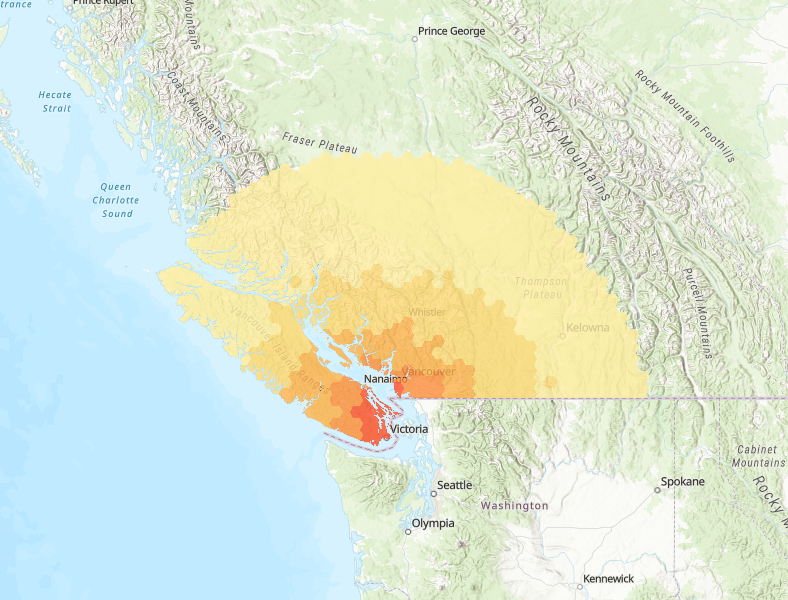
Full rupture of the Leech River Fault, a fault that cuts southern Vancouver Island and extends beneath Greater Victoria. Based on current science, this magnitude 7.3 earthquake scenario represents the strongest ground shaking event that could strike the region, and is one of Greater Victoria’s most severe events.
-

A magnitude 5.9 earthquake near Montreal, along the Milles-Îles Fault. This fault is not known to be active, but this scenario represents a small but damaging event near the City of Montreal.
-

Magnitude 4.9 earthquake scenario along the Vedder Fault which runs northeast along Vedder Mountain. This earthquake is located about 18 km east of Abbotsford City Hall. This fault is not known to be active, but this scenario represents a small but damaging event near Abbotsford town centre.