 Arctic SDI catalogue
Kvartærgeologi
Type of resources
Available actions
Keywords
Contact for the resource
Provided by
Years
Representation types
Update frequencies
status
Service types
Scale
-
Løsmassepolygoner har vært samlet, generalisert og harmonisert fra alle tilgjengelige kvartære kart utgitt av Norges geologiske undersøkelse i Norge. Løsmassene er klassifisert i henhold til dannelsesmåte og tykkelse. I ikke-kartlagte områder har forekomstene blitt tolket fra flyfoto i kombinasjon med feltkontroller. På grunn av variasjon i kvalitet og målestokk fra ulike kartleggingsepoker, er kvaliteten i det resulterende datasettet variabel
-
Marin grense (MG) angir det høyeste nivå som havet nådde etter siste istid. Dette vil avhenge av hvor man er i Norge. Noen steder nådde havet hele 200 m over dagens havnivå. Data for MG består av punktregistreringer og en linje og et areal modellert fra punktene og N50 høydekoter fra Kartverket. Skraverte områder ligger over MG.
-
Løsmassepolygoner har vært samlet, generalisert og harmonisert fra alle tilgjengelige kvartære kart utgitt av Norges geologiske undersøkelse i Norge. Løsmassene er klassifisert i henhold til dannelsesmåte og tykkelse. I ikke-kartlagte områder har forekomstene blitt tolket fra flyfoto i kombinasjon med feltkontroller. På grunn av variasjon i kvalitet og målestokk fra ulike kartleggingsepoker, er kvaliteten i det resulterende datasettet variabel
-
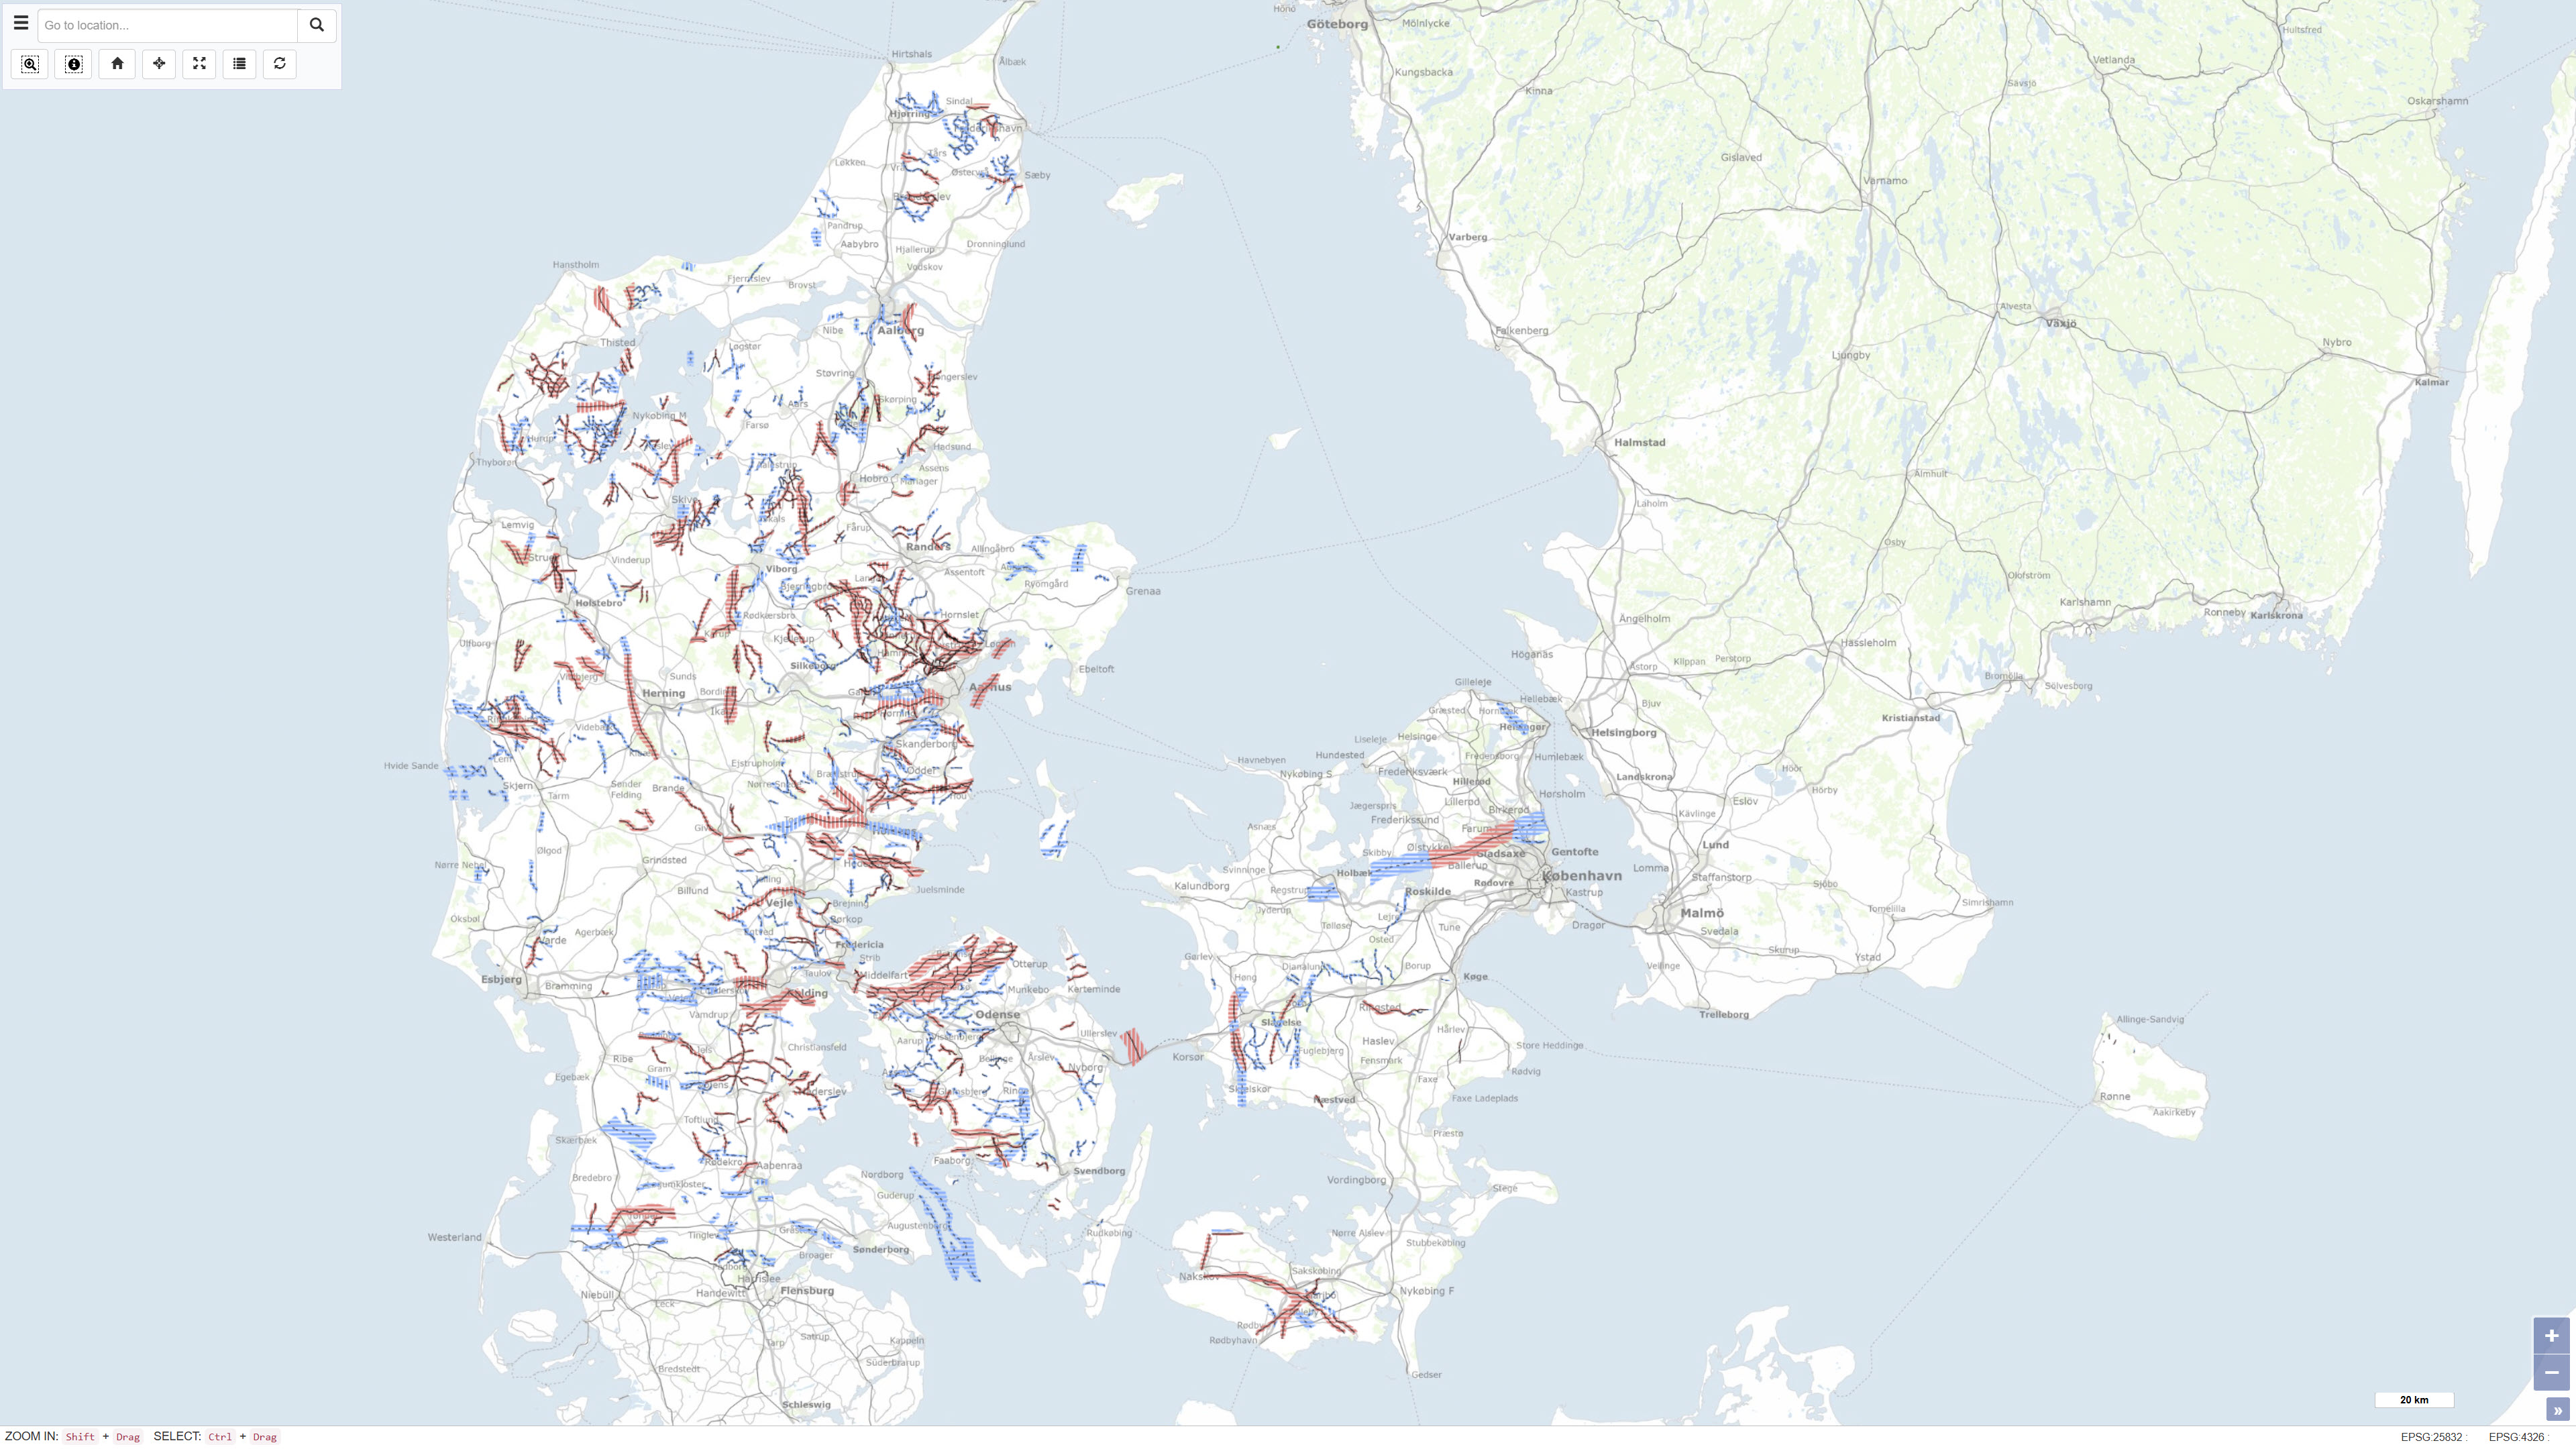
The dataset represents a nationwide mapping of buried valleys in Denmark. The map depicts the occurrence, distribution and general geometry of mapped buried valleys in the Danish subsurface. Buried valleys are elongated depressions in the subsurface that are today fully or partly infilled with younger sediments. In Denmark, the majority of mapped buried valleys are interpreted to have formed during repeated glaciations in the Quaternary period. The valleys are typically 0.5–2 km wide and may reach depths of up to approximately 400 m. The dataset is based on interpretation of geophysical data, primarily TEM and SkyTEM surveys, supplemented by seismic data and borehole information. The mapping provides a national overview of buried valleys and forms a key basis for understanding the geological framework of the subsurface.
-
Marin grense (MG) angir det høyeste nivå som havet nådde etter siste istid. Dette vil avhenge av hvor man er i Norge. Noen steder nådde havet hele 200 m over dagens havnivå. Data for MG består av punktregistreringer og en linje og et areal modellert fra punktene og N50 høydekoter fra Kartverket. Skraverte områder ligger over MG.
-
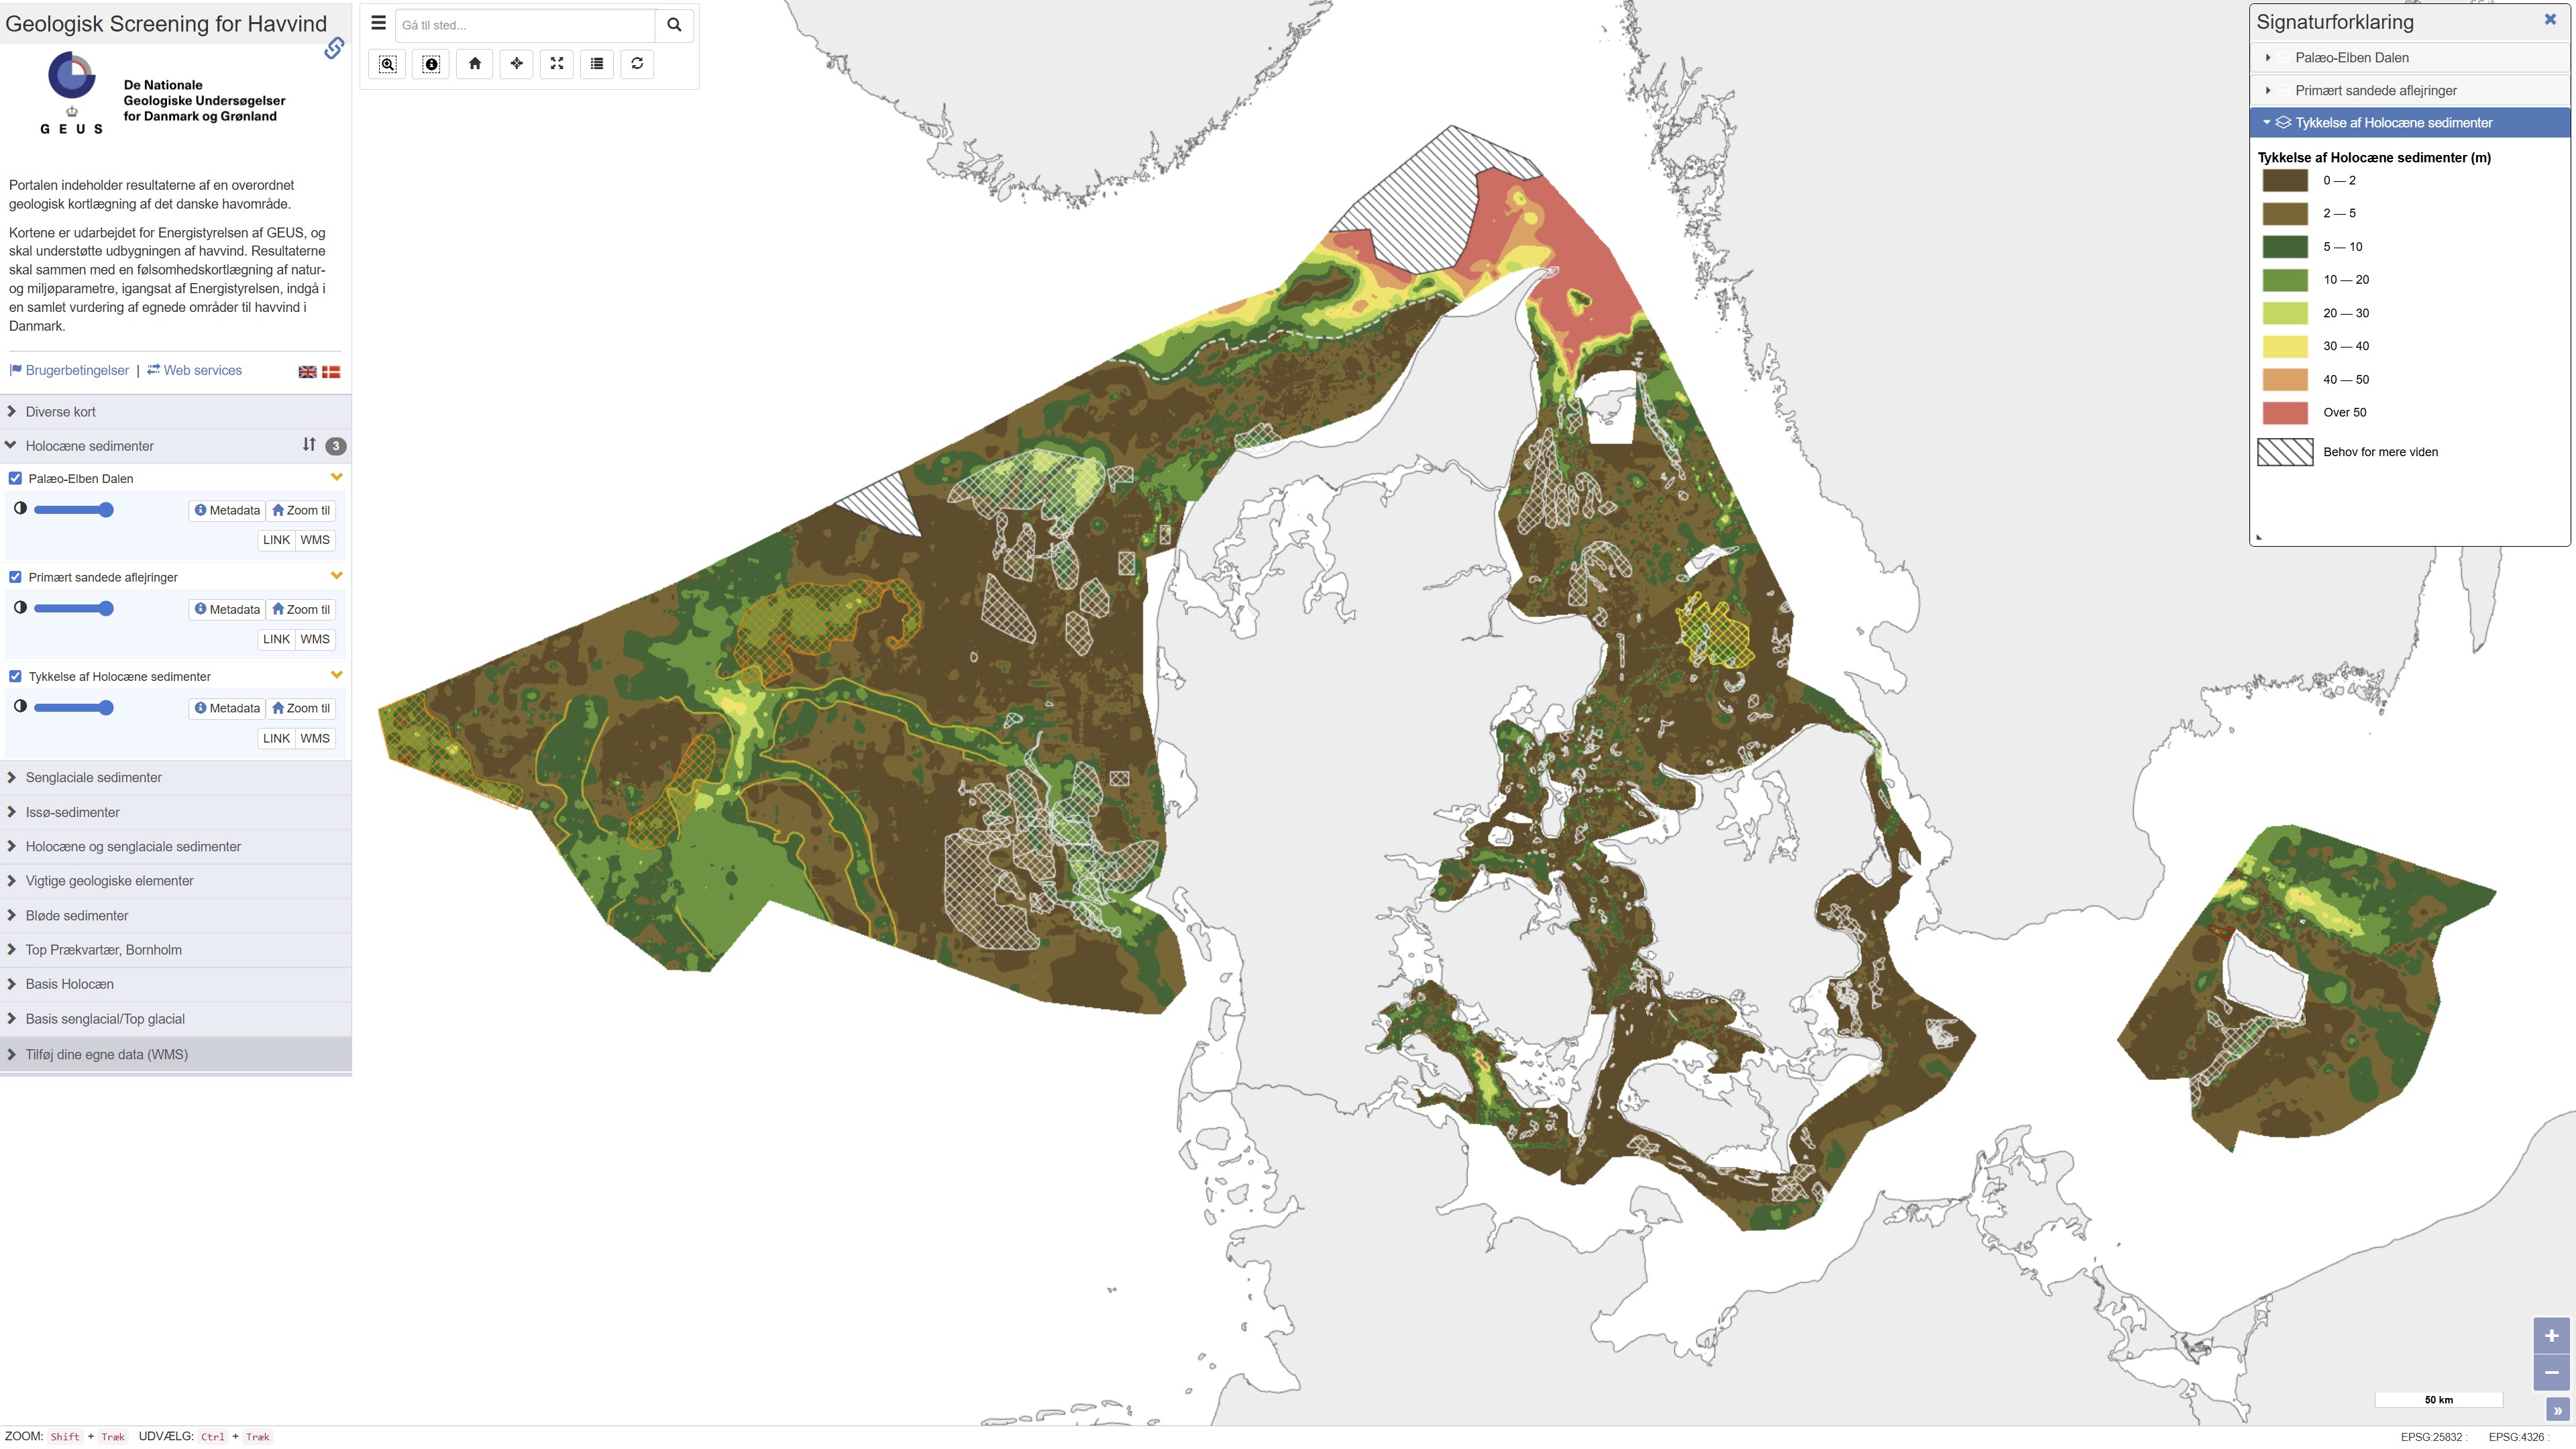
This repository contains maps of the thickness of late glacial and Holocene deposits in the Danish sea area, prepared as a basis for planning offshore wind. These are unconsolidated sediments that have not been overrun by the ice sheets of the ice ages, and therefore may have low geotechnical strength parameters. This is a large-scale and very general mapping, and no detailed interpretation of the distribution of sand and clay/mud/silt, respectively, has been made. In relation to the foundations of offshore wind turbines, sandy deposits will typically not pose a challenge, while soft deposits of clay, mud and silt in large thicknesses are assumed to pose foundation challenges. In addition to separate maps of the thickness of late glacial and Holocene deposits, a map of the total thickness of these two units has also been prepared, which thus constitutes a map of the total thickness of potentially soft sediments. Finally, the thickness of potentially soft sediments is used to divide the Danish sea area into categories in relation to the probability of larger thicknesses of soft sediments that could give rise to foundation challenges. Other maps are the thickness of potentially soft glacial lake sediments in the North Sea, the depth to the Pre-Quaternary surface in the waters around Bornholm, as well as the depth to the base of the Holocene deposits and the depth to the base of the late glacial deposits/top of the glacial deposits in the Danish sea area. As a supplement to the maps, a number of themes show where the late glacial and Holocene deposits are primarily expected to consist of sandy sediments. In addition, a number of themes show the Danish exclusive economic zone (EEZ), the location of conceptual geological models that can be seen in the overall report, all interpreted seismic lines, areas with near-surface gas in the sediments, interpreted distribution of the Palaeo-Elbe Valley in the North Sea, distribution of the Weichsel ice and ice-affected sediments in the North Sea, buried valleys (Prins & Andresen 2019; van der Vegt et al. 2012; Ottesen et al. 2020; Kirkham et al. 2024; Sandersen & Jørgensen 2016), structural elements (Al Hseinat & Hübscher 2017; Jensen et al. 2002), ice margin lines (Lange 1984; Kjær et al. 2003; Pedersen 2005; Phillips et al. 2018, 2022; Kirkham et al. 2024; Szuman et al. 2024; Pedersen & Boldreel 2017). The data basis for the work has primarily been new and existing near-surface seismic data and vibrocore drilling. The mapping was carried out for the Danish Energy Agency by GEUS, and is intended to support the development of offshore wind. The results, together with a sensitivity mapping of natural and environmental parameters, initiated by the Danish Energy Agency, are to be included in an overall assessment of suitable areas for offshore wind in Denmark.
-
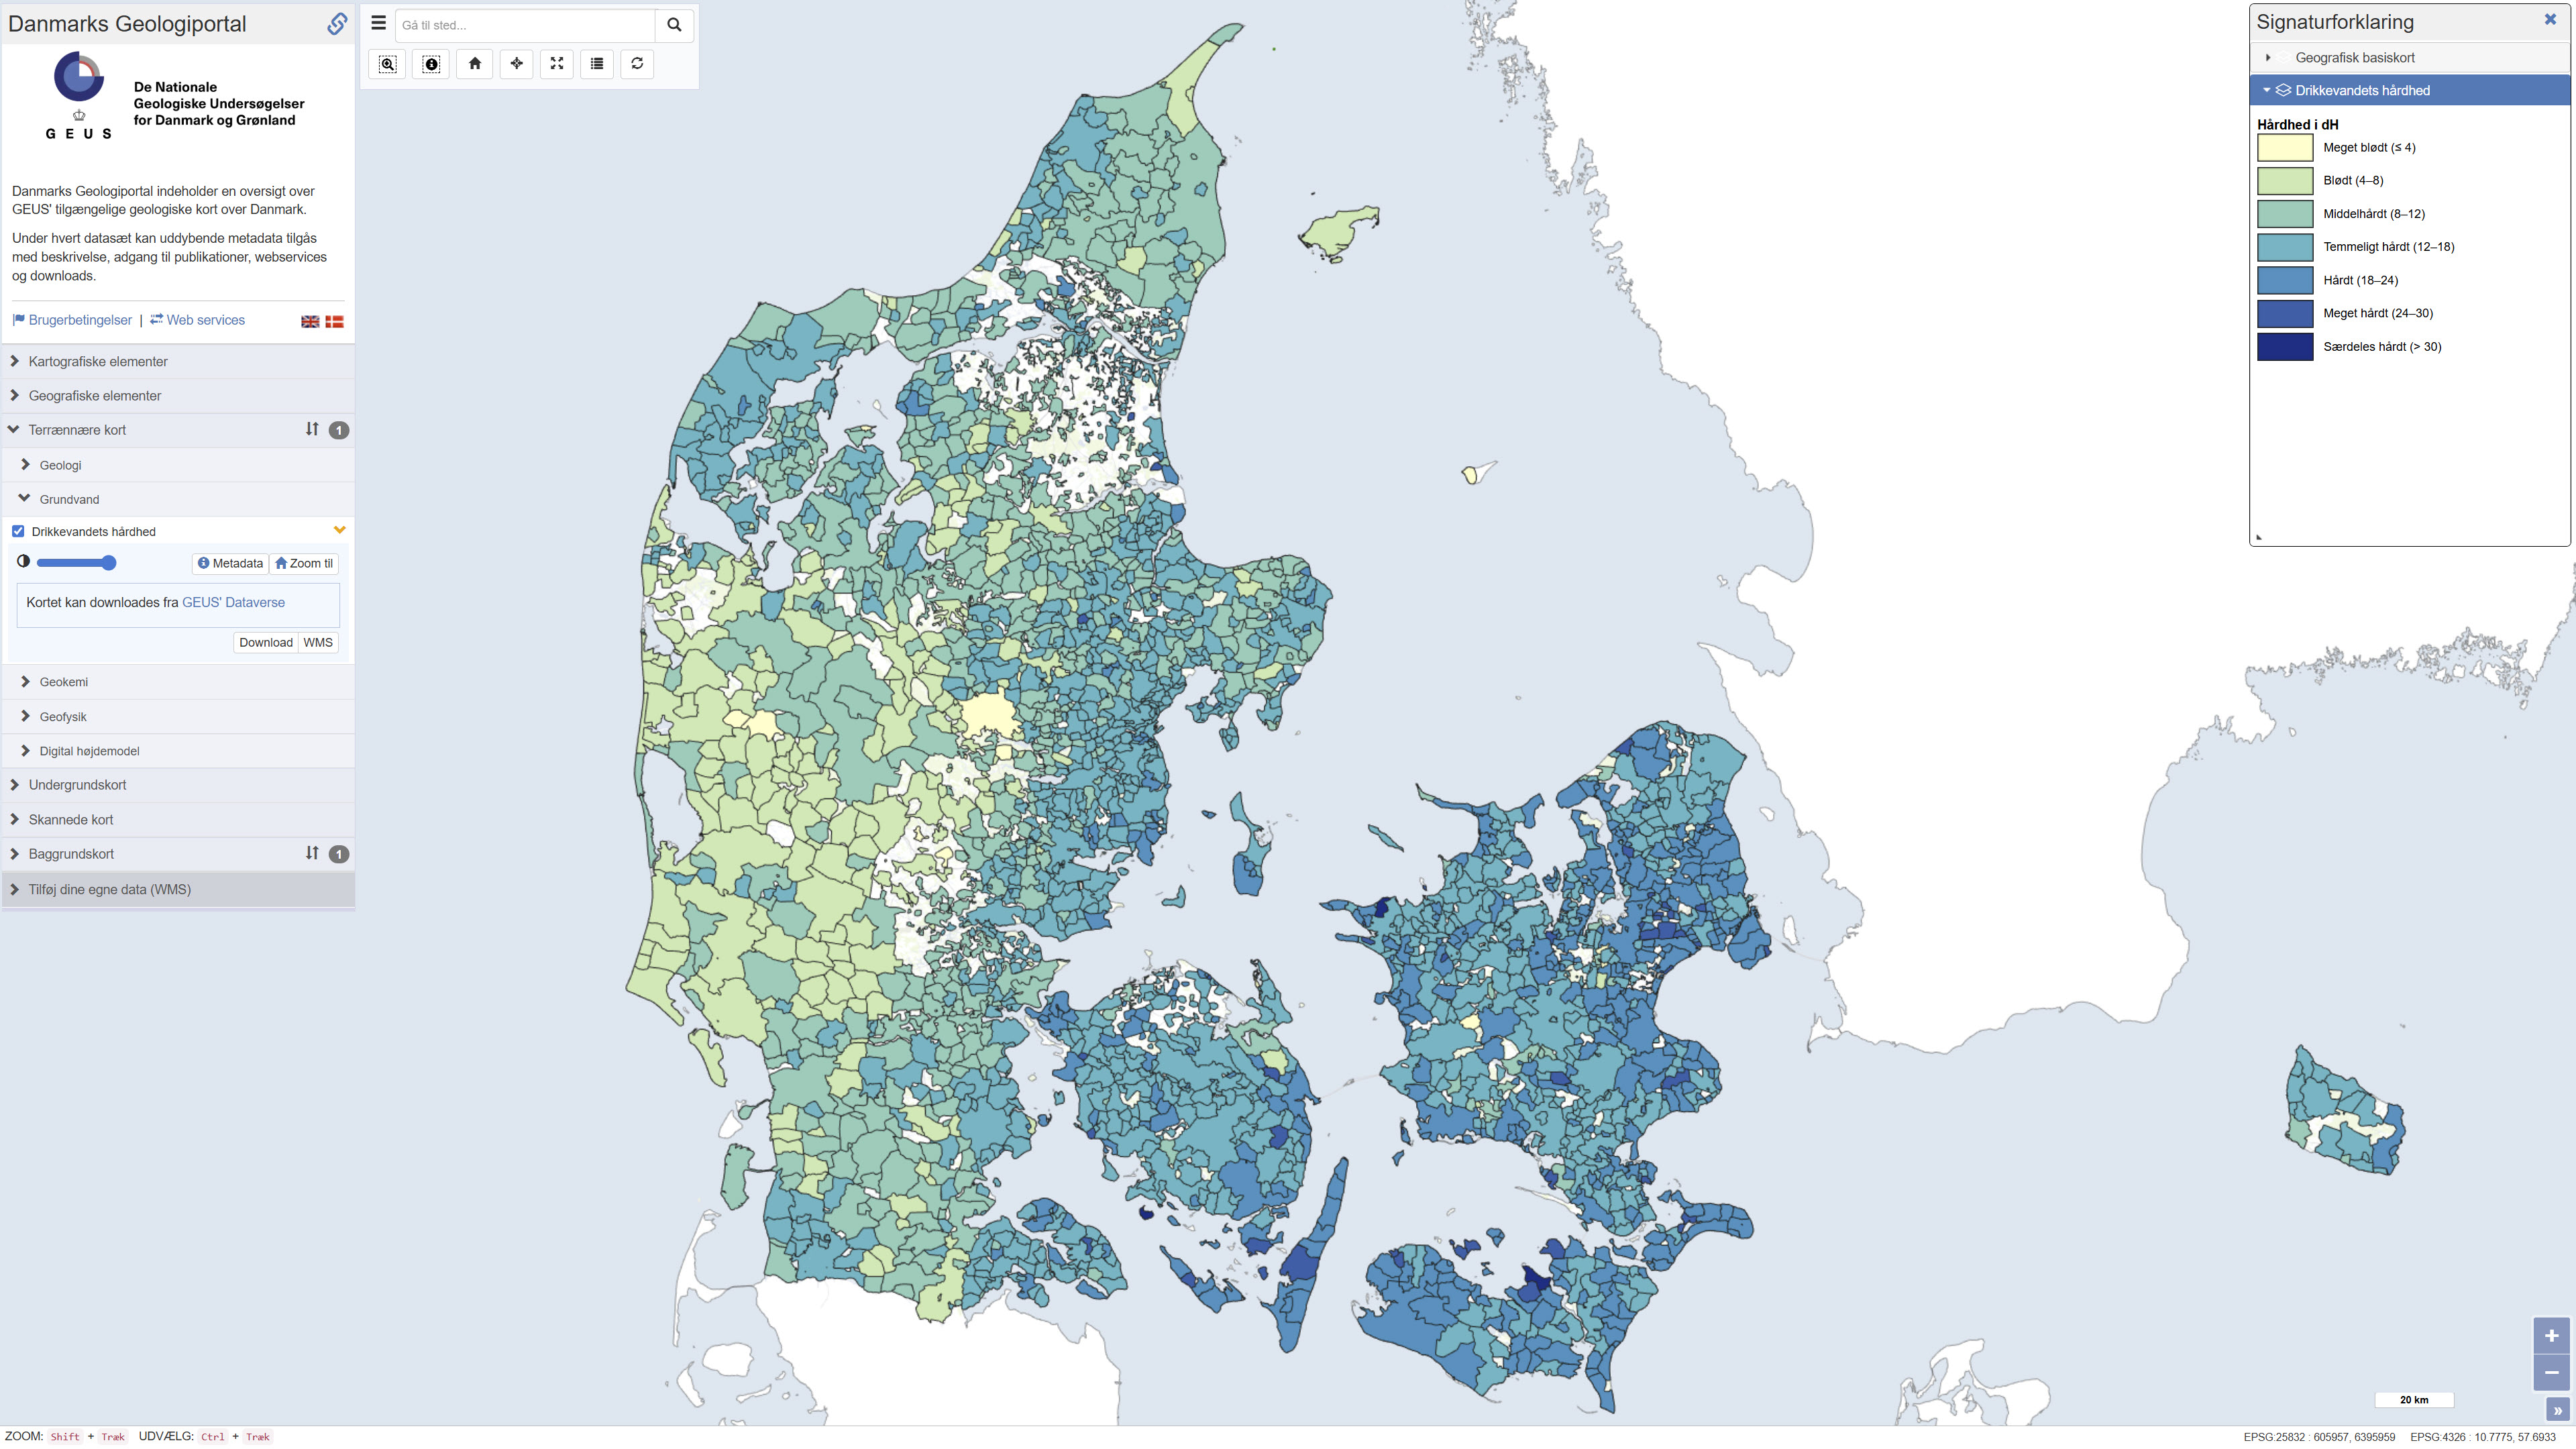
Map showing information about drinking water hardness (dH) at the level of water supply areas of public waterworks in Denmark based on quality-assured data, extracted from the national well-database Jupiter in September 2023. The hardness degree is based on the concentration of calcium and magnesium in the drinking water and has importance, for example, for the soap dosage when washing clothes: hard water requires more soap than soft water. Drinking water hardness may vary considerably from location to location and in time. Contact your water utility company to get the updated and precise figures.
-
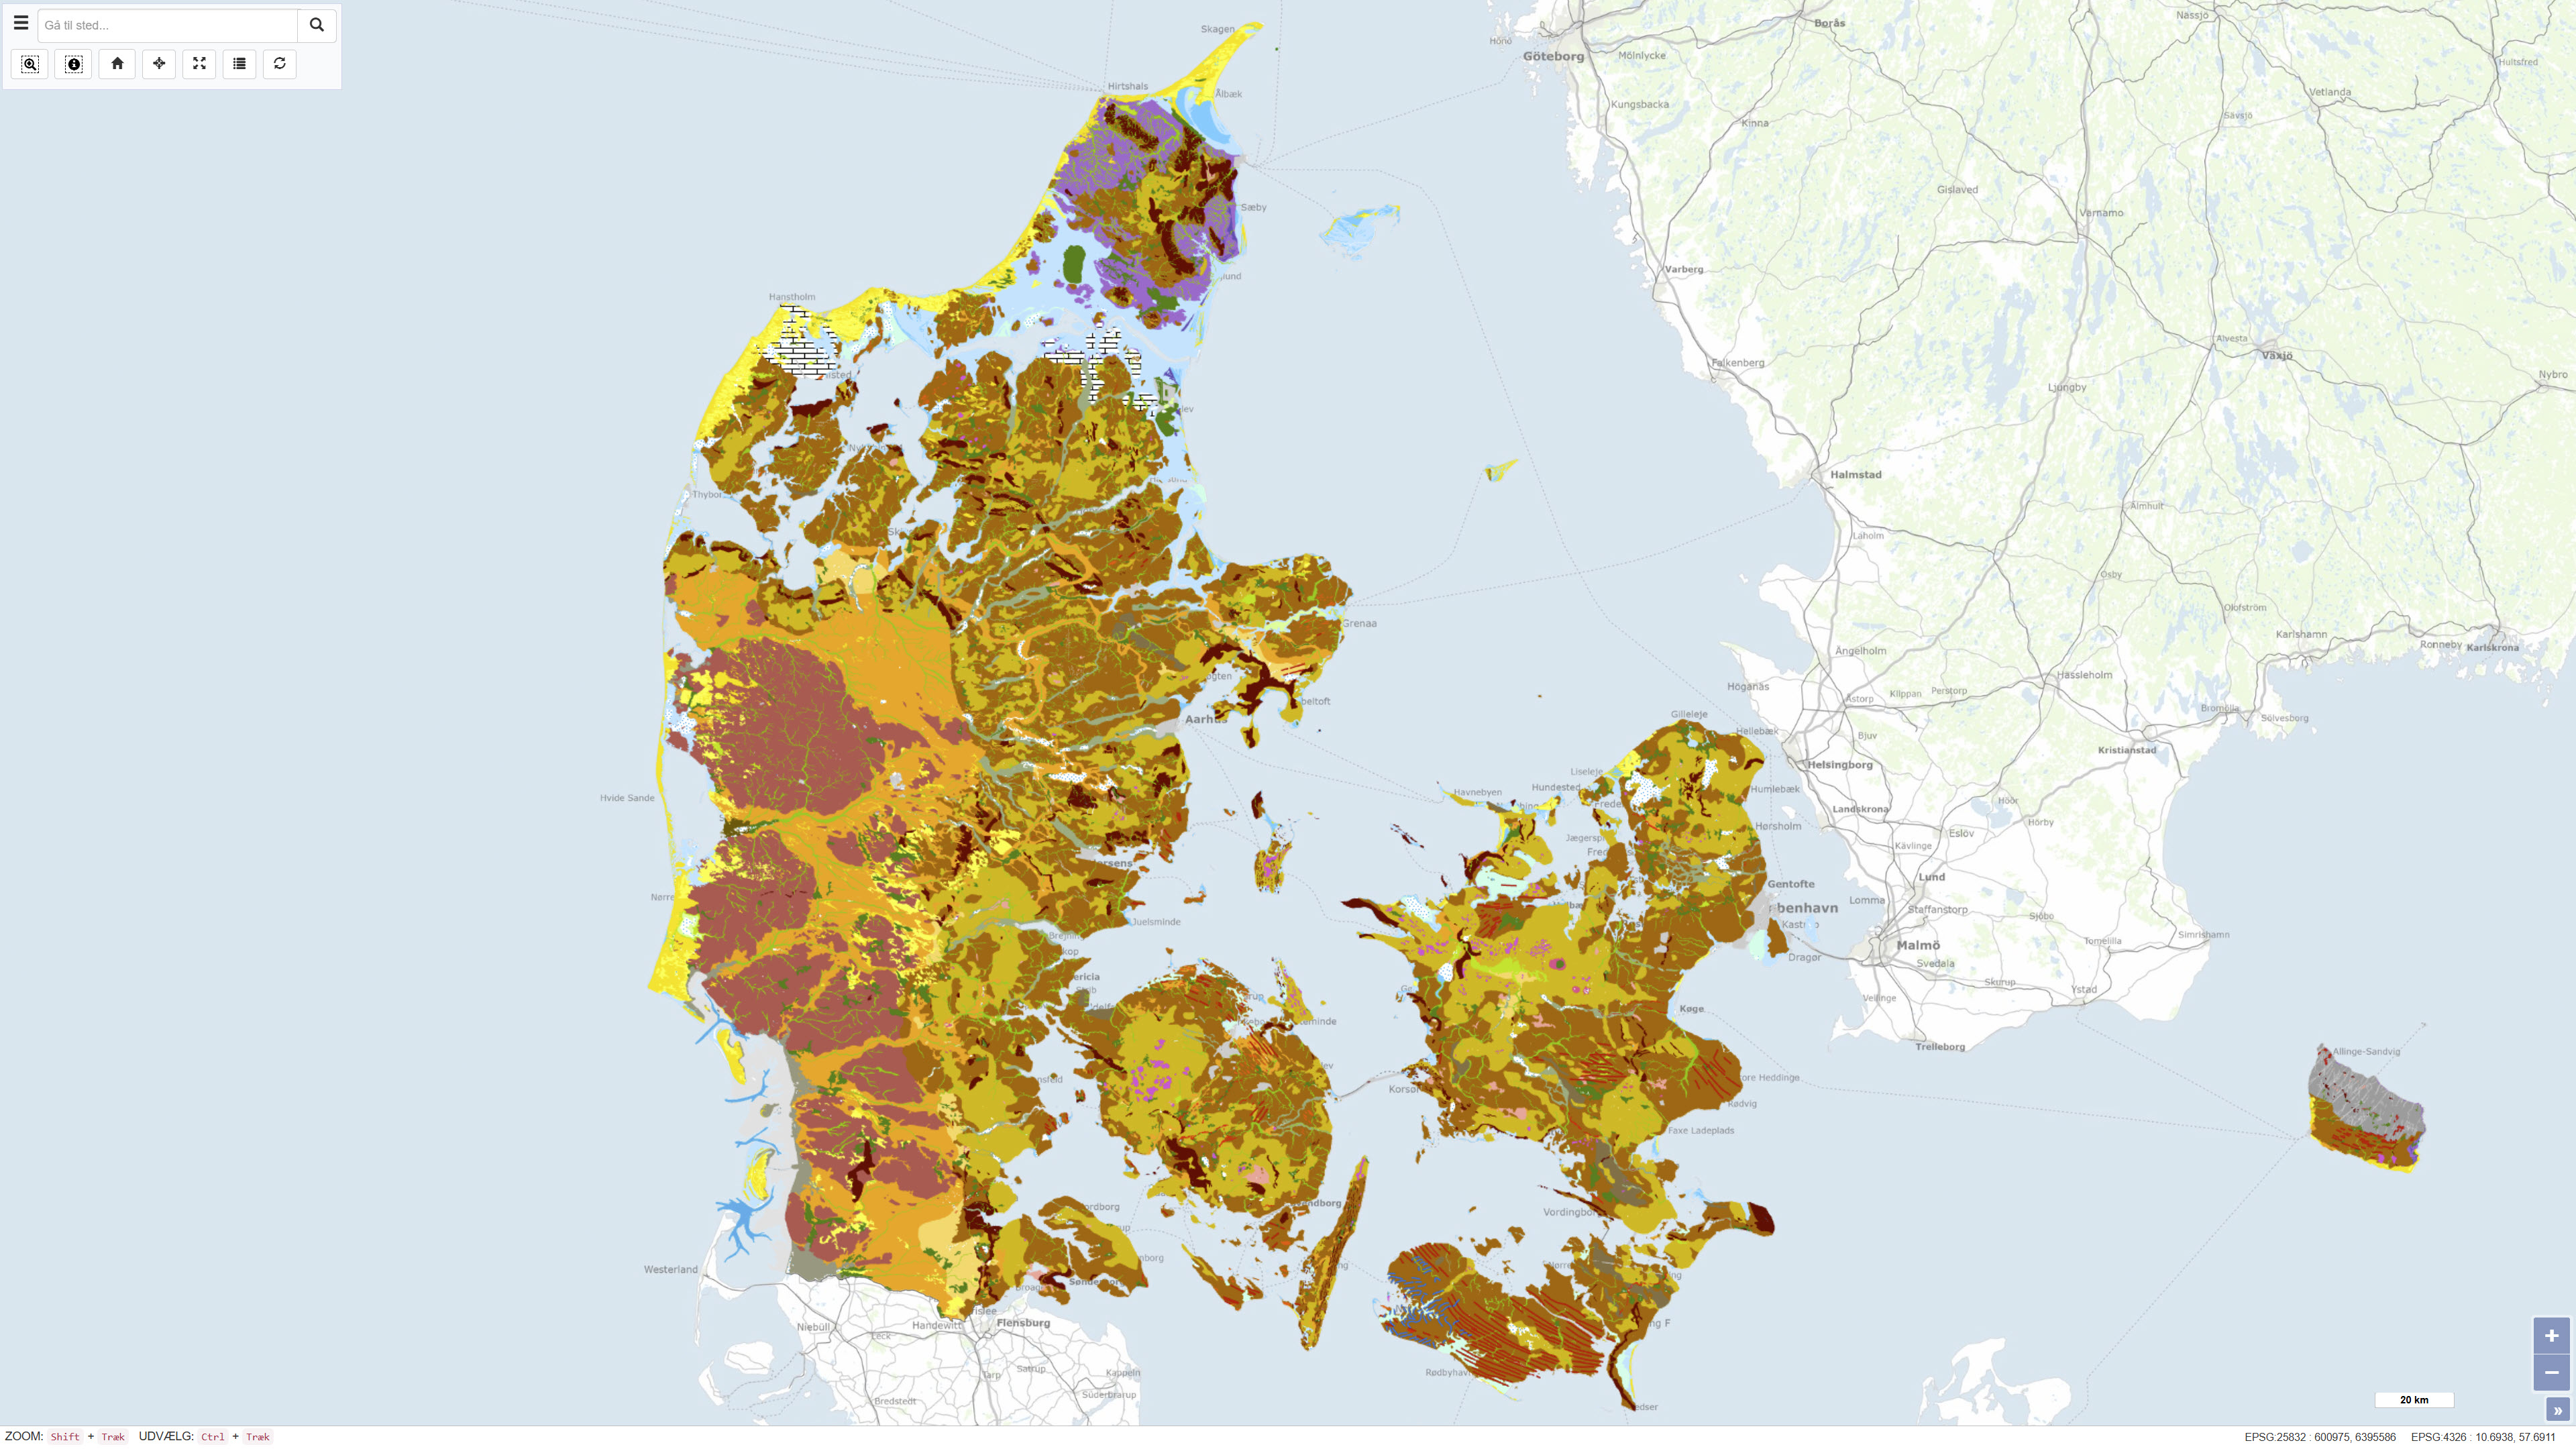
The Geomorphological Map of Denmark, version 3 (2022), depicts landscape types across Denmark at a scale of 1:200.000. The landscape types are defined based on shared geomorphological characteristics that can be related to the processes responsible for their formation. Most landscape types were formed during Quaternary glaciations and by meltwater from the glaciers, while the map also includes post-glacial landscapes such as marine and coastal environments, river valleys, lakes and wetlands, as well as aeolian landforms. The map further reflects landscape features influenced by pre-Quaternary bedrock, including exposed crystalline basement on Bornholm and chalk formations in northern Jutland, as well as surface features related to subsurface structural movements. Anthropogenic landscapes resulting from land reclamation, drainage, excavation, and infilling are also represented. The map is based on systematic geomorphological mapping and interpretation of landforms derived from geological data, terrain analysis and existing cartographic material.