 Arctic SDI catalogue
1000000
Type of resources
Available actions
Topics
Keywords
Contact for the resource
Provided by
Years
Formats
Representation types
Update frequencies
status
Scale
Resolution
-
DK model 2019 – Simulation results comprises calculated hydrological results from GEUS’ national hydrological model for Denmark. The dataset contains derived results from model runs with DK model 2019, including calculations of water balance, groundwater recharge, impacts of water abstraction, groundwater drawdown, streamflow impacts and changes in flow-related indicators. The results include, among other outputs, comparisons between scenarios with current abstraction and reference scenarios without abstraction. The dataset is used for regional assessment of hydrological conditions, screening of water resource and impact conditions, and documentation of model-calculated results. The results are model-based and should be used with due consideration of the regional purpose, model uncertainties and limitations of DK model in relation to local-scale applications.
-
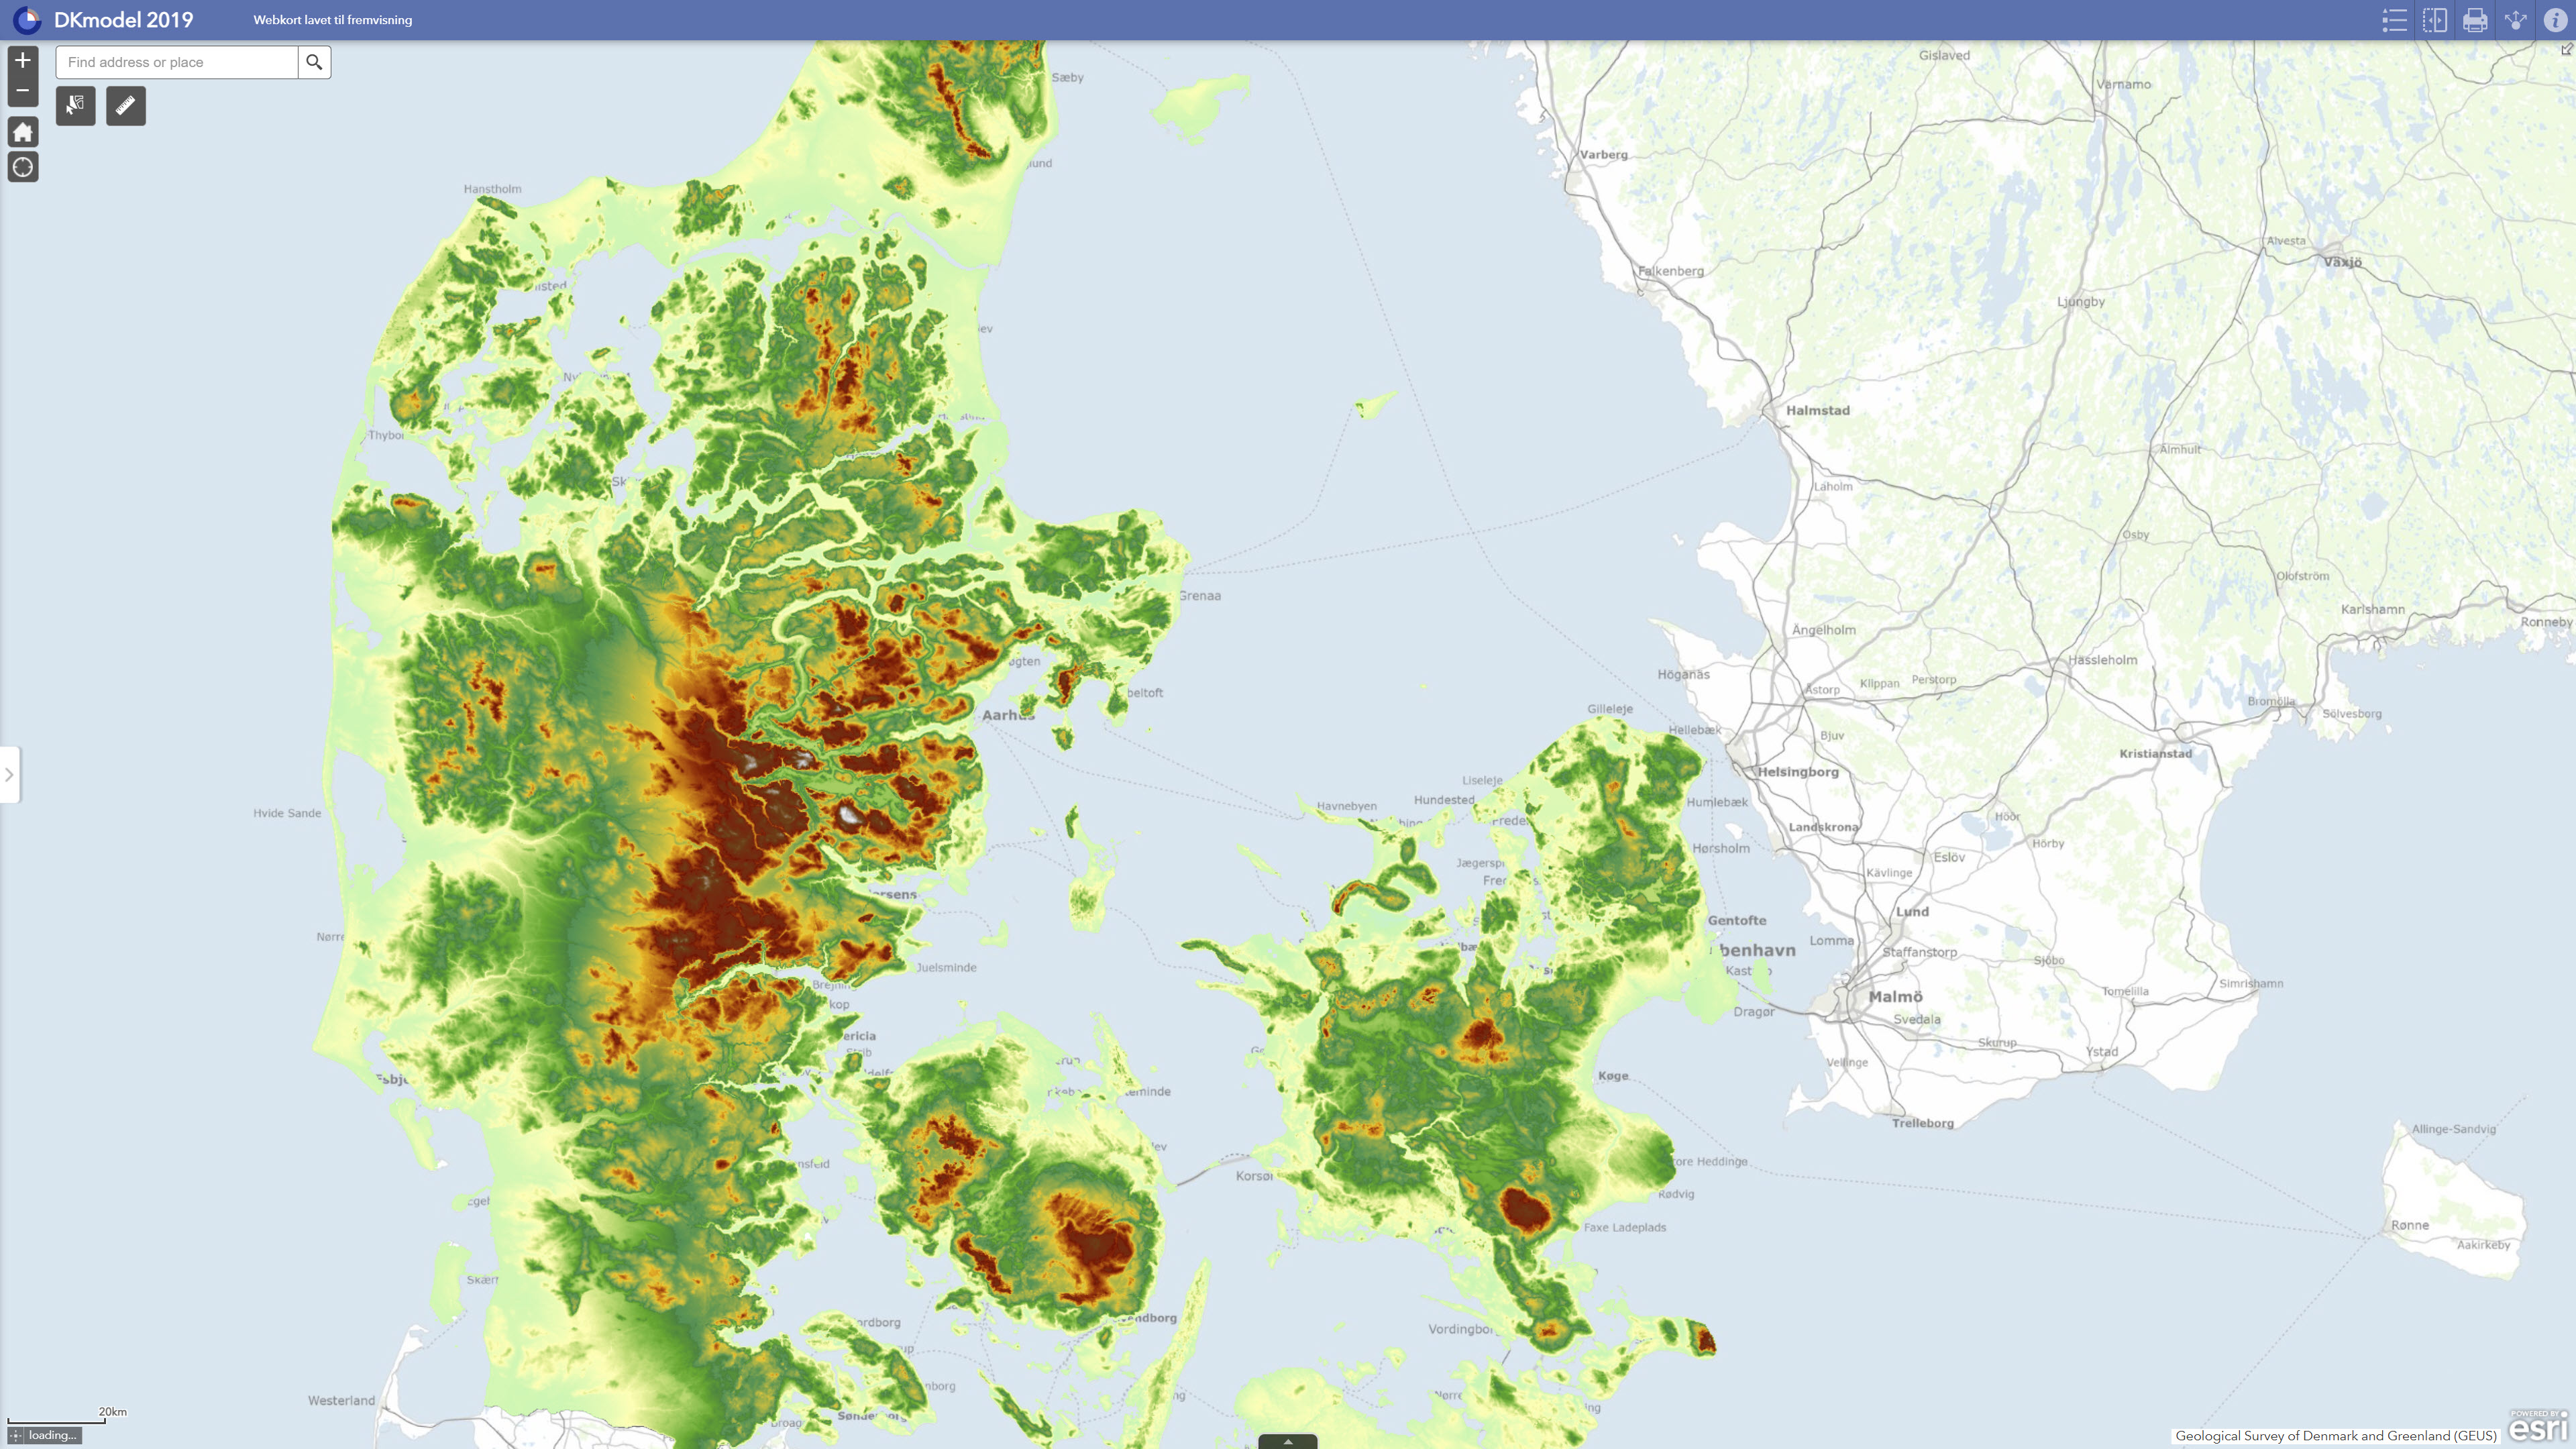
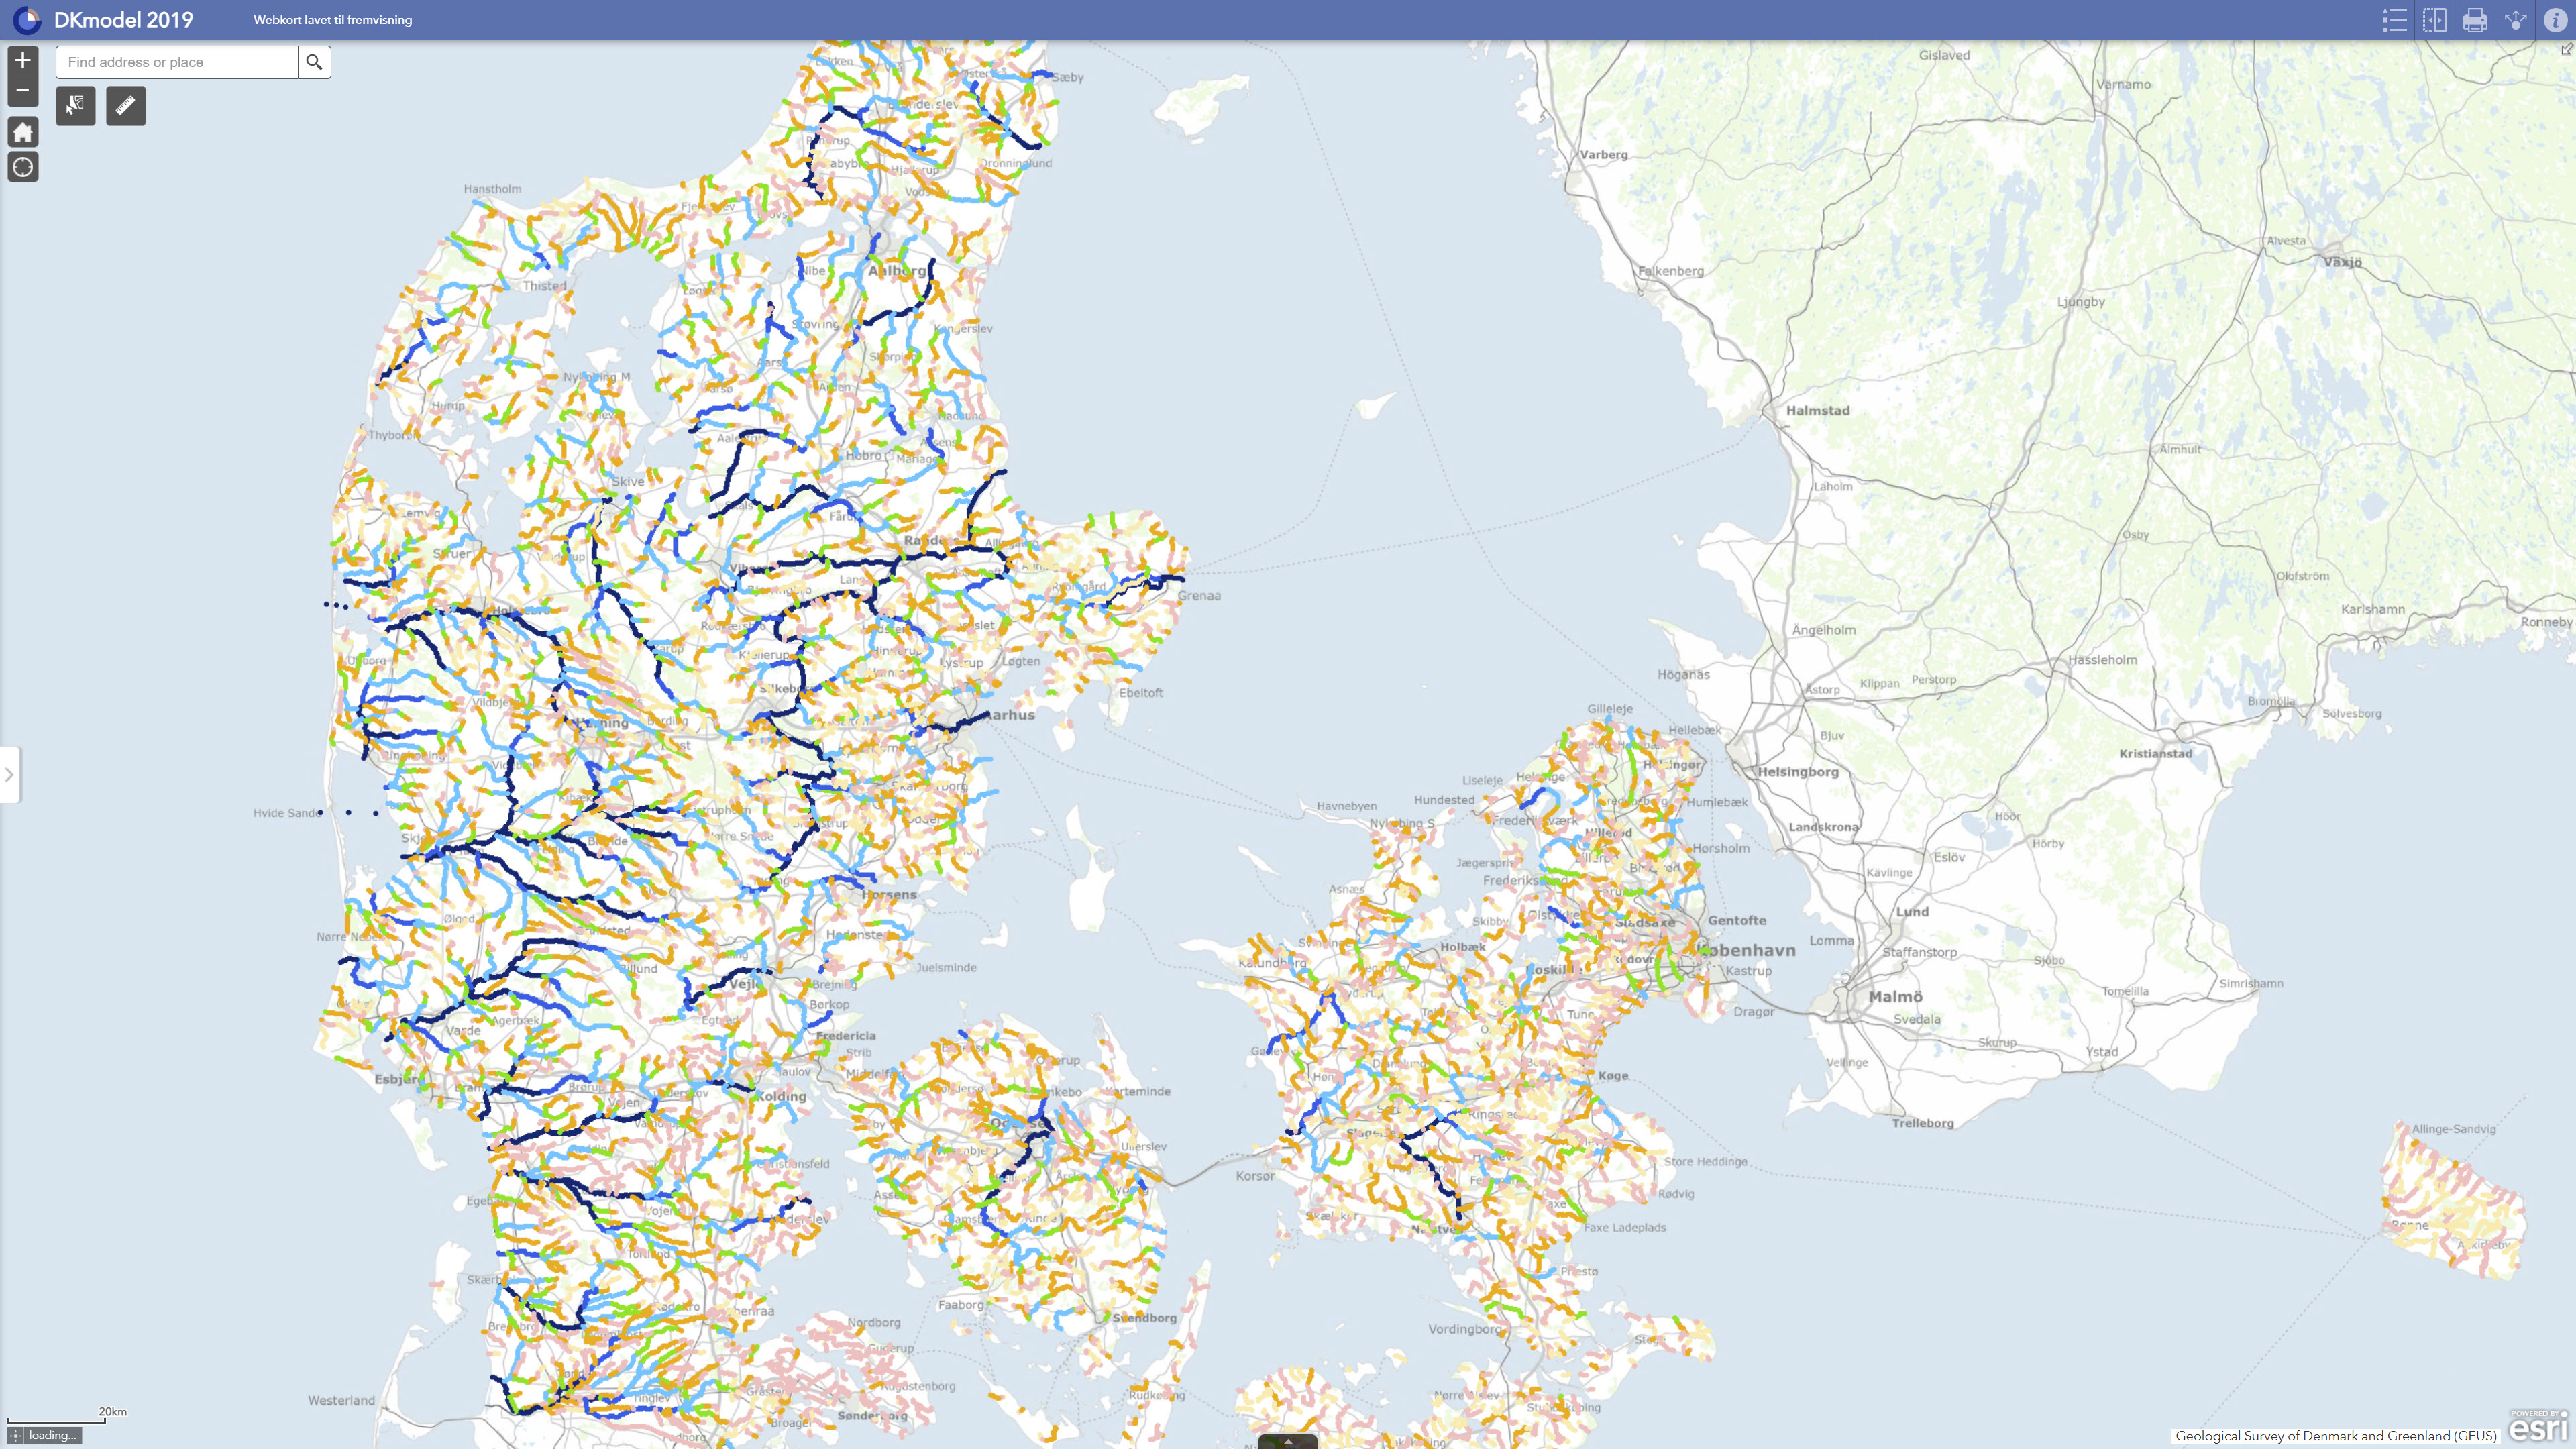
DK model 2019 – Model data comprises core model data from GEUS’ national hydrological model for Denmark. The dataset describes the model basis used in DK model 2019, including the hydrogeological model structure, computational grid, groundwater bodies, climate input, water abstraction data, stream network and other thematic input data included in the model setup. DK model 2019 was updated with new groundwater bodies, new hydrogeological mapping information and a new calibration against observed groundwater heads and stream discharge. The model data form the basis for calculations of groundwater recharge, water balance, water abstraction, drawdown, exploitation rates and impacts on streams. The dataset is suitable as documentation of the model basis and as input to regional analyses, screening and further modelling studies, but should not be used directly for local-scale issues without a separate assessment.
-
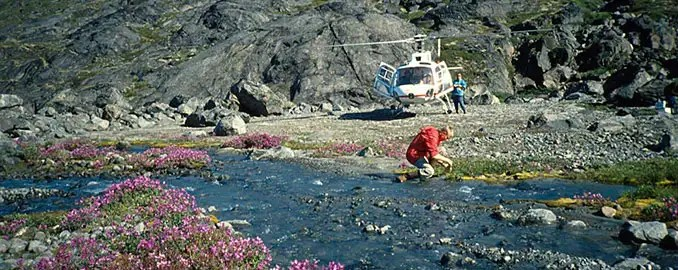
This dataset comprises regional geochemical stream sediment data from West and South Greenland and forms the basis of the Geochemical Atlas of West and South Greenland (Steenfelt, 2001). The Geochemical Atlas of West and South Greenland presents the results of a regional stream sediment geochemical mapping programme conducted between 1979 and 1998. A total of 7,122 stream sediment samples were collected from low-order streams with near-uniform spatial coverage across West and South Greenland. The <0.1 mm grain-size fraction of 500 g samples was analysed for major and trace elements using X-ray fluorescence spectrometry (XRF), instrumental neutron activation analysis (INAA), delayed neutron counting (DNC) and loss on ignition (LOI). After systematic calibration and quality control to eliminate analytical bias between different methods and time periods, a harmonised and internally consistent dataset was established containing up to 43 elements per sample. The atlas provides a regional overview of the geochemical composition of the minerogenic fraction of stream sediments and constitutes a geochemical baseline dataset for geological mapping and mineral exploration in Greenland.
-

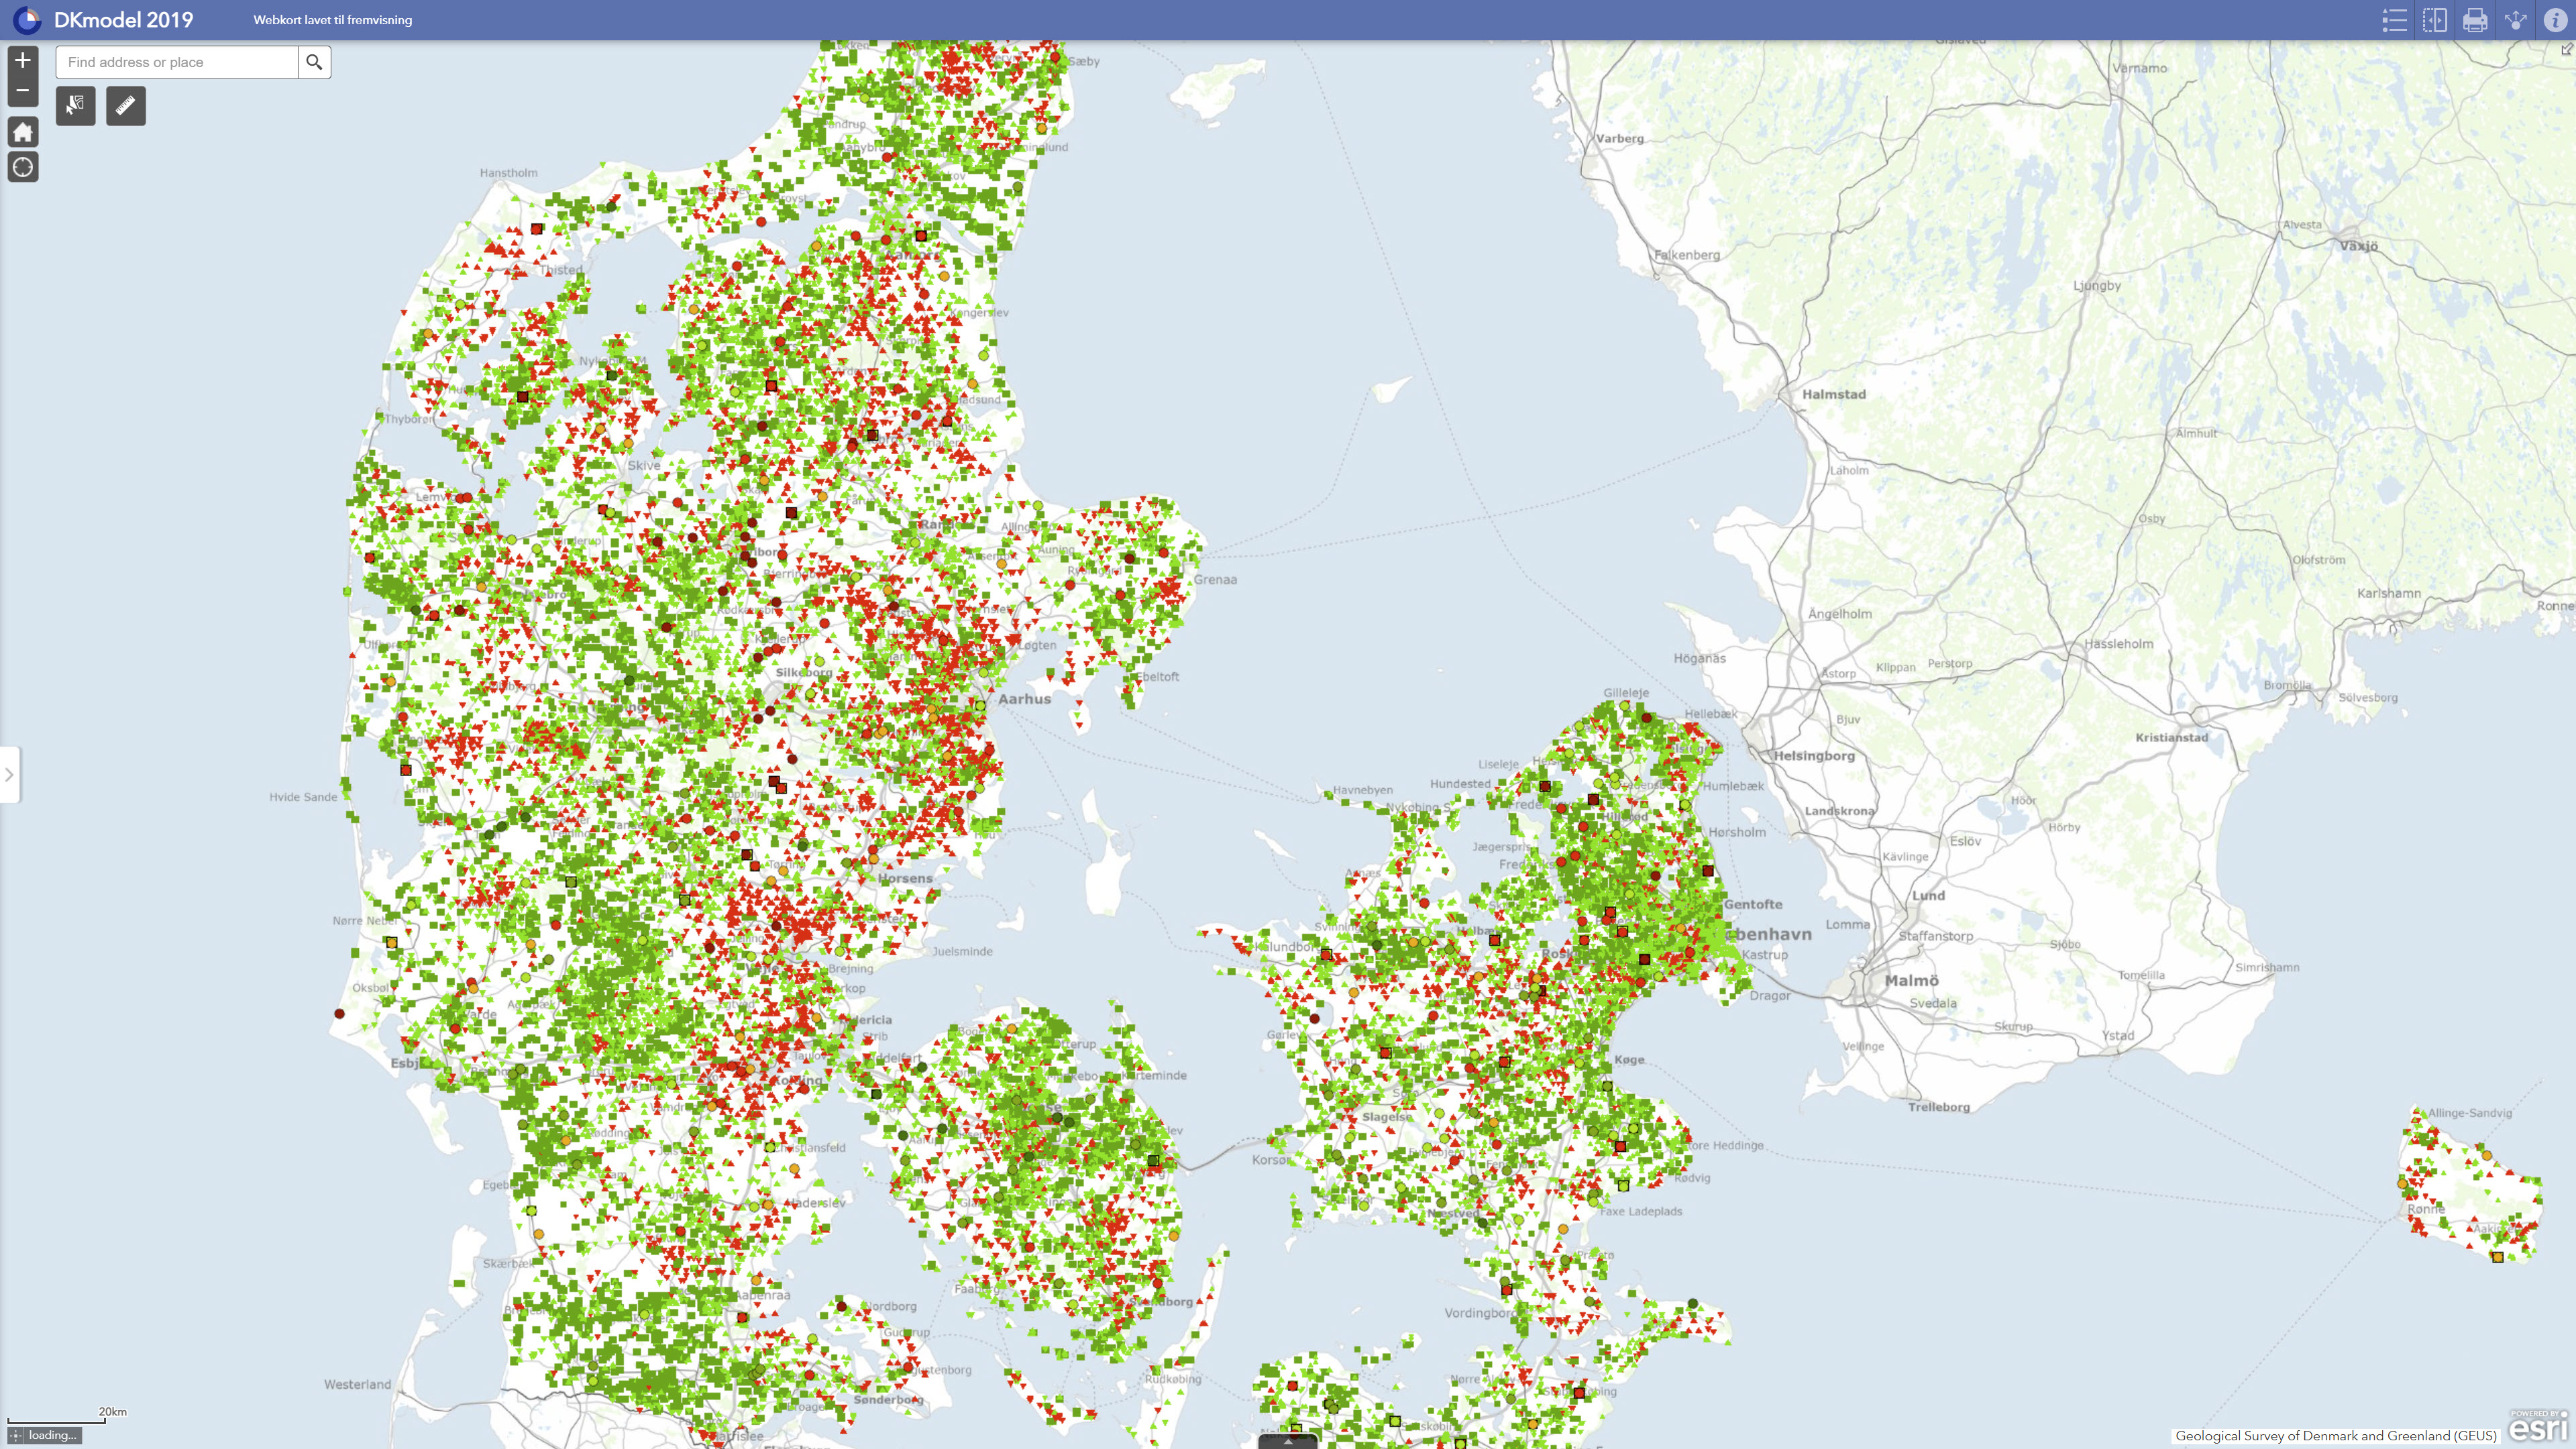
This layer comprises all the available water wells in GIN (Yukon, British Columbia, Alberta, Saskatchewan, Manitoba, Ontario, Quebec, Nova Scotia and Newfoundland and Labrador) and published through the open data platforms. This layer is a combination of all individual provincial and territorial layers. The original databases are dynamically converted by an automatic process managed by Natural Resources Canada (Groundwater Information Network).
-
DK model 2019 – Calibration statistics comprises spatial and statistical results from the calibration and evaluation of GEUS’ national hydrological model for Denmark. The dataset documents model performance for groundwater heads and stream discharge, including statistical measures such as RMSE and mean error for groundwater heads as well as WBE, summer WBE and KGE for streamflow simulations. The calibration was carried out using dynamic model runs and inverse parameter estimation with PEST based on observed groundwater heads and daily discharge data for the period 2000–2010. The dataset is intended for assessing the suitability of DK model 2019 for regional analyses, screening and further use. The calibration statistics describe model performance at national and regional scales and should not by themselves be used as documentation of local-scale model accuracy.
-
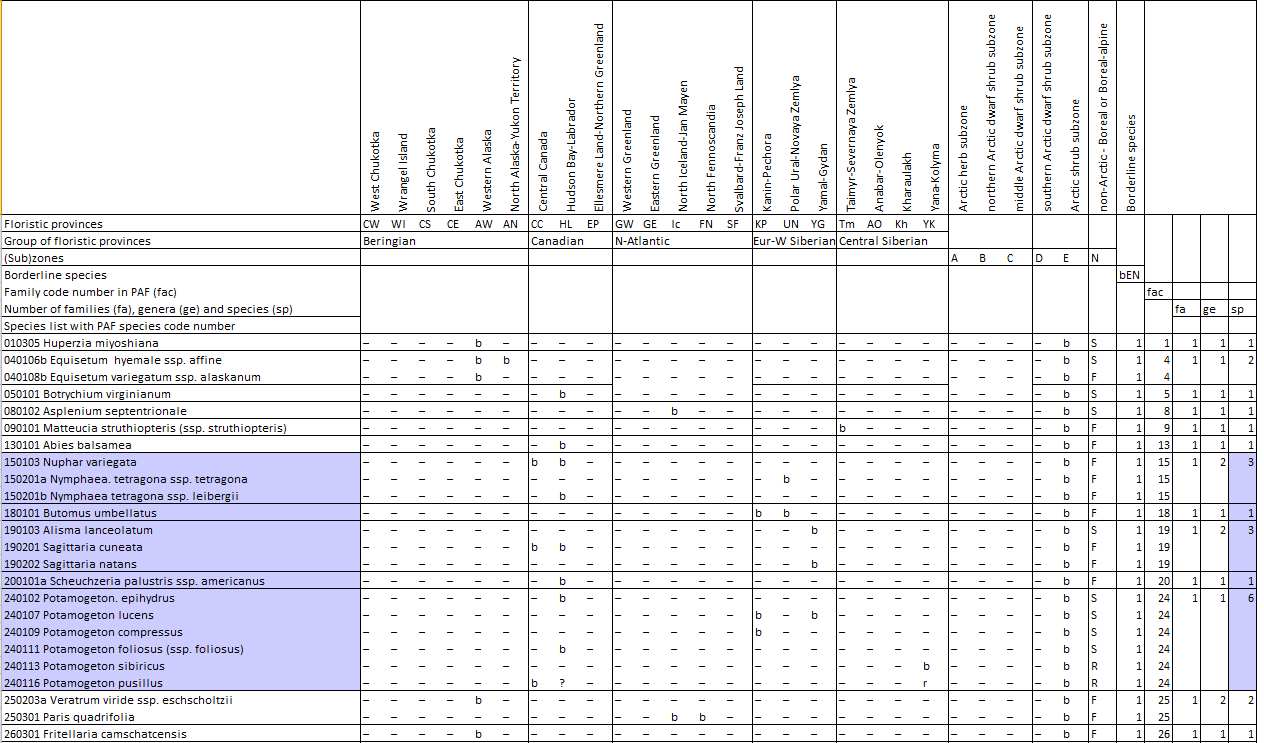
Appendix 9.3 Borderline vascular plant species (“b”) with indication of PAF code number, reaching the southernmost part of the Arctic subzone E. Arctic floristic provinces, subzones (A-E), neighbouring boreal or boreo-alpine zone (N) derived from Elven (2007).
-
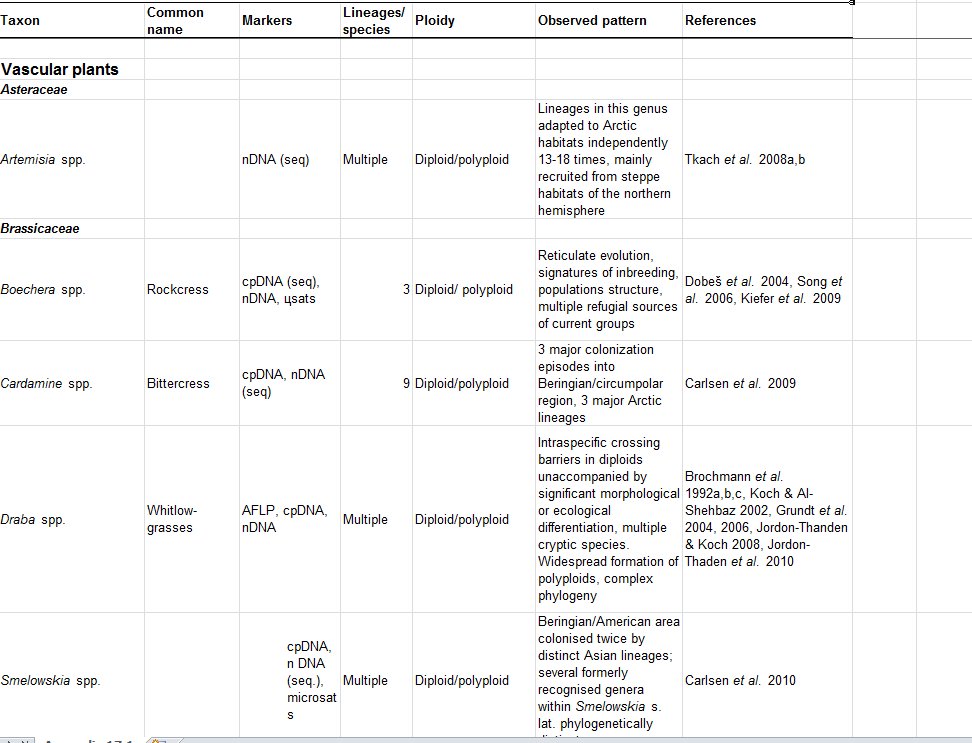
Appenidx 17.1. Selected phylogenetic studies of (or including) Arctic taxa.
-
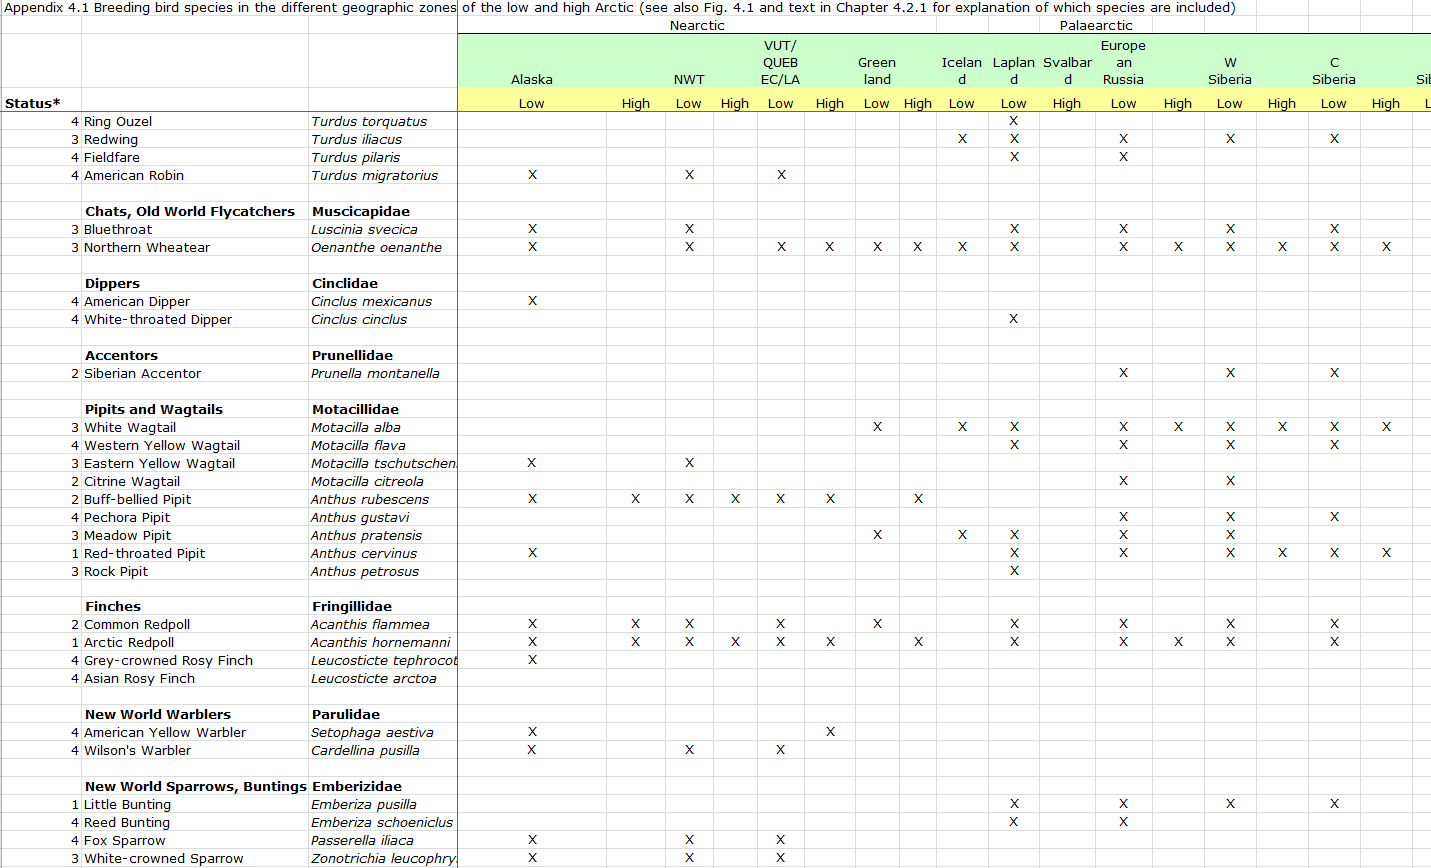
Breeding bird species in the different geographic zones of the low and high Arctic
-
The dataset contains geographic polygons representing the areas of Greenland covered in GEUS publications and in the DODEX report database. Each publication is associated with metadata including title, authors, year of publication and reference information as well as a link to the digital publication where publicly available. The dataset includes publication series such as GEUS Bulletin, Geological Survey of Denmark and Greenland Bulletin, Bulletin Grønlands Geologiske Undersøgelse, report series and geological map descriptions. The polygons are based on the geographic extent described in each publication and serve as a spatial index for search and visualisation purposes.
-
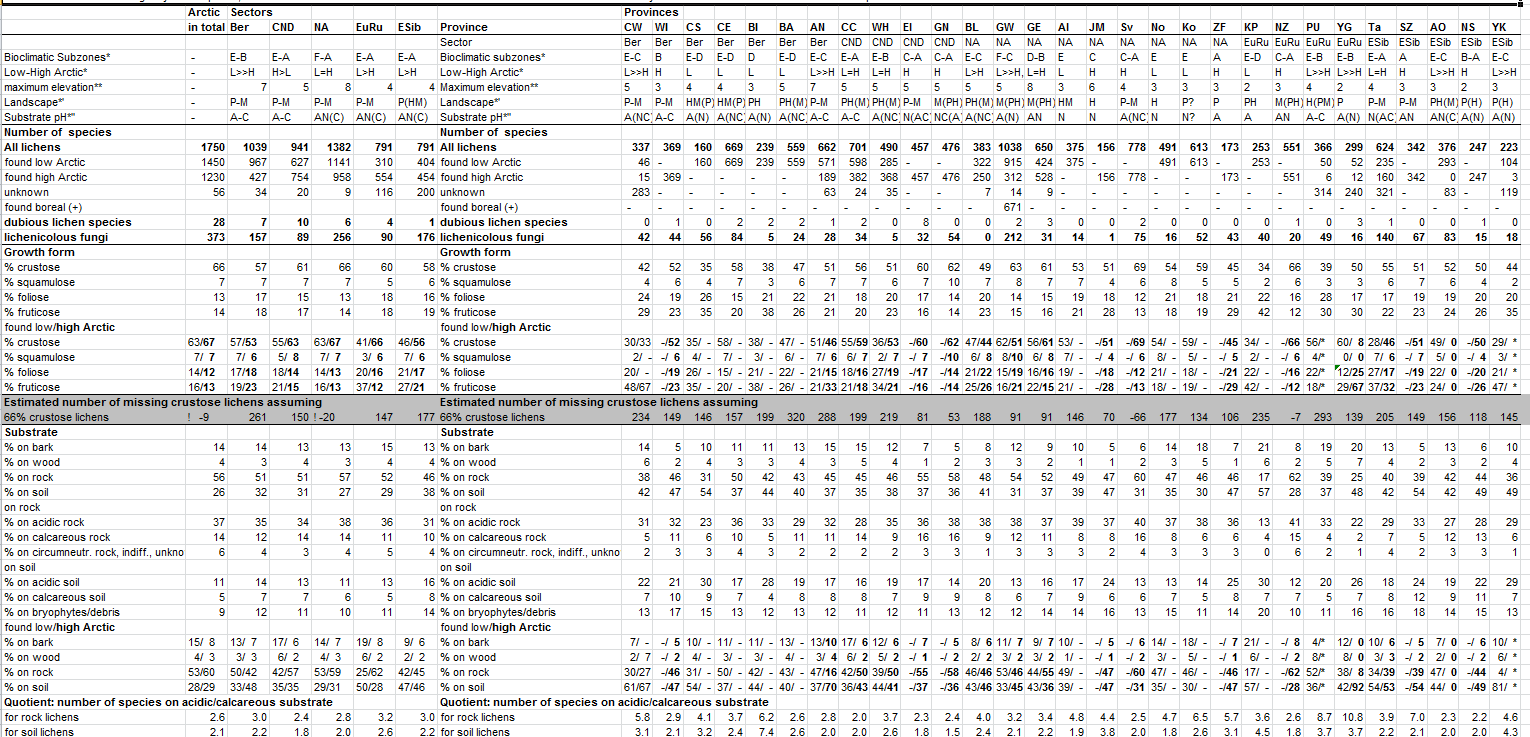
Appendix 10.2. Data on diversity of lichens and lichenicolous fungi in the Arctic and separately for the sectors of the Arctic (Beringia, Canada, North Atlantic, European Russia, W and E Siberia) and the single floristic provinces: numbers of species, numbers of species in the low and high Arctic, percentage of species with respective growth form (crustose, squamulose, foliose, fruticose), the estimated number of missing crustose lichen species (explanations below), percentage of species on the respective substrate on which the lichen species grow, and rarity of species within and outside the Arctic.