 Arctic SDI catalogue
500000
Type of resources
Categories
Available actions
Topics
Keywords
Contact for the resource
Provided by
Years
Formats
Representation types
Update frequencies
status
Scale
-
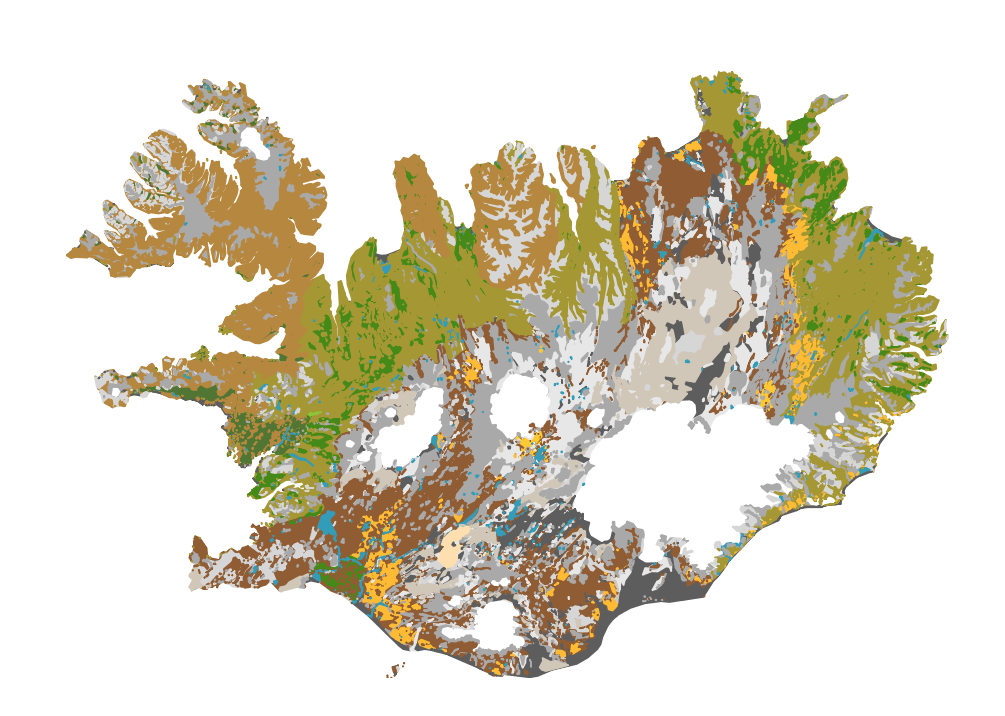
Íslenskur jarðvegur telst til eldfjallajarðar (Andosol) að langmestum hluta, en eldfjallajörð er jarðvegur sem myndast á eldvirkum svæðum heimsins. Eldfjallajörð hefur afar sérstæða eiginleika sem greina hana frá öðrum jarðvegsgerðum. Útbúin var einföld flokkun fyrir íslenskan jarðveg, sem m.a. byggist á alþjóðlegum flokkunarkerfum en einnig á vinnu Björns Jóhannessonar og Þorsteins Guðmundssonar. Flokkunin gerir greinarmun á i) jarðvegi auðna (glerjörð sem skiptist í melajörð, malarjörð, sandjörð og vikurjörð; ii) jarðvegi gróins lands með sortueiginleika (sortujörð, sem skiptist í brúnjörð, votjörð og svartjörð), iii) lífrænni mójörð og að síðustu iv) öðrum jarðvegi sem er margvíslegur að gerð. Í síðasta flokknum er bergjörð útbreiddust, en auk þess má nefna frerajörð sífrerasvæða og kalkjörð. Jarðvegskortið var unnið á grundvelli sniða og jarðvegssýna sem safnað hefur verið víða um landið. Kortið er á vektora formi og í mælikvarða 1:500 000. Það er m.a. hluti evrópska jarðvegskortsins. A soil map of Iceland: The Soil map classification separates between; 1) andic soils, which are Brown Andosols, Gleyic Andosols and Histic Andosols; 2) Vitrisols, soils of deserts, which are divided into Cambic Vitrisols, Gravelly Vitrisols, Arenic Vitrisols and Pumice Vitrisols iii) Histosols, and iv) other soil types such as Cryosols and Leptosols. The classification system is in part based on WRB system and Soil Taxonomy and earlier work by Björn Jóhannesson and Þorsteinn Guðmundsson (see English Summary and 1. table in http://www.moldin.net/uploads/3/9/3/3/39332633/jardvegskort_2.pdf). The map is in a coarse scale (1:500 000) and is not intended to use for particular points on the landscape. It is rather an overview. It has been incorporated into the EU soil database and the Circumpolar soil map.
-
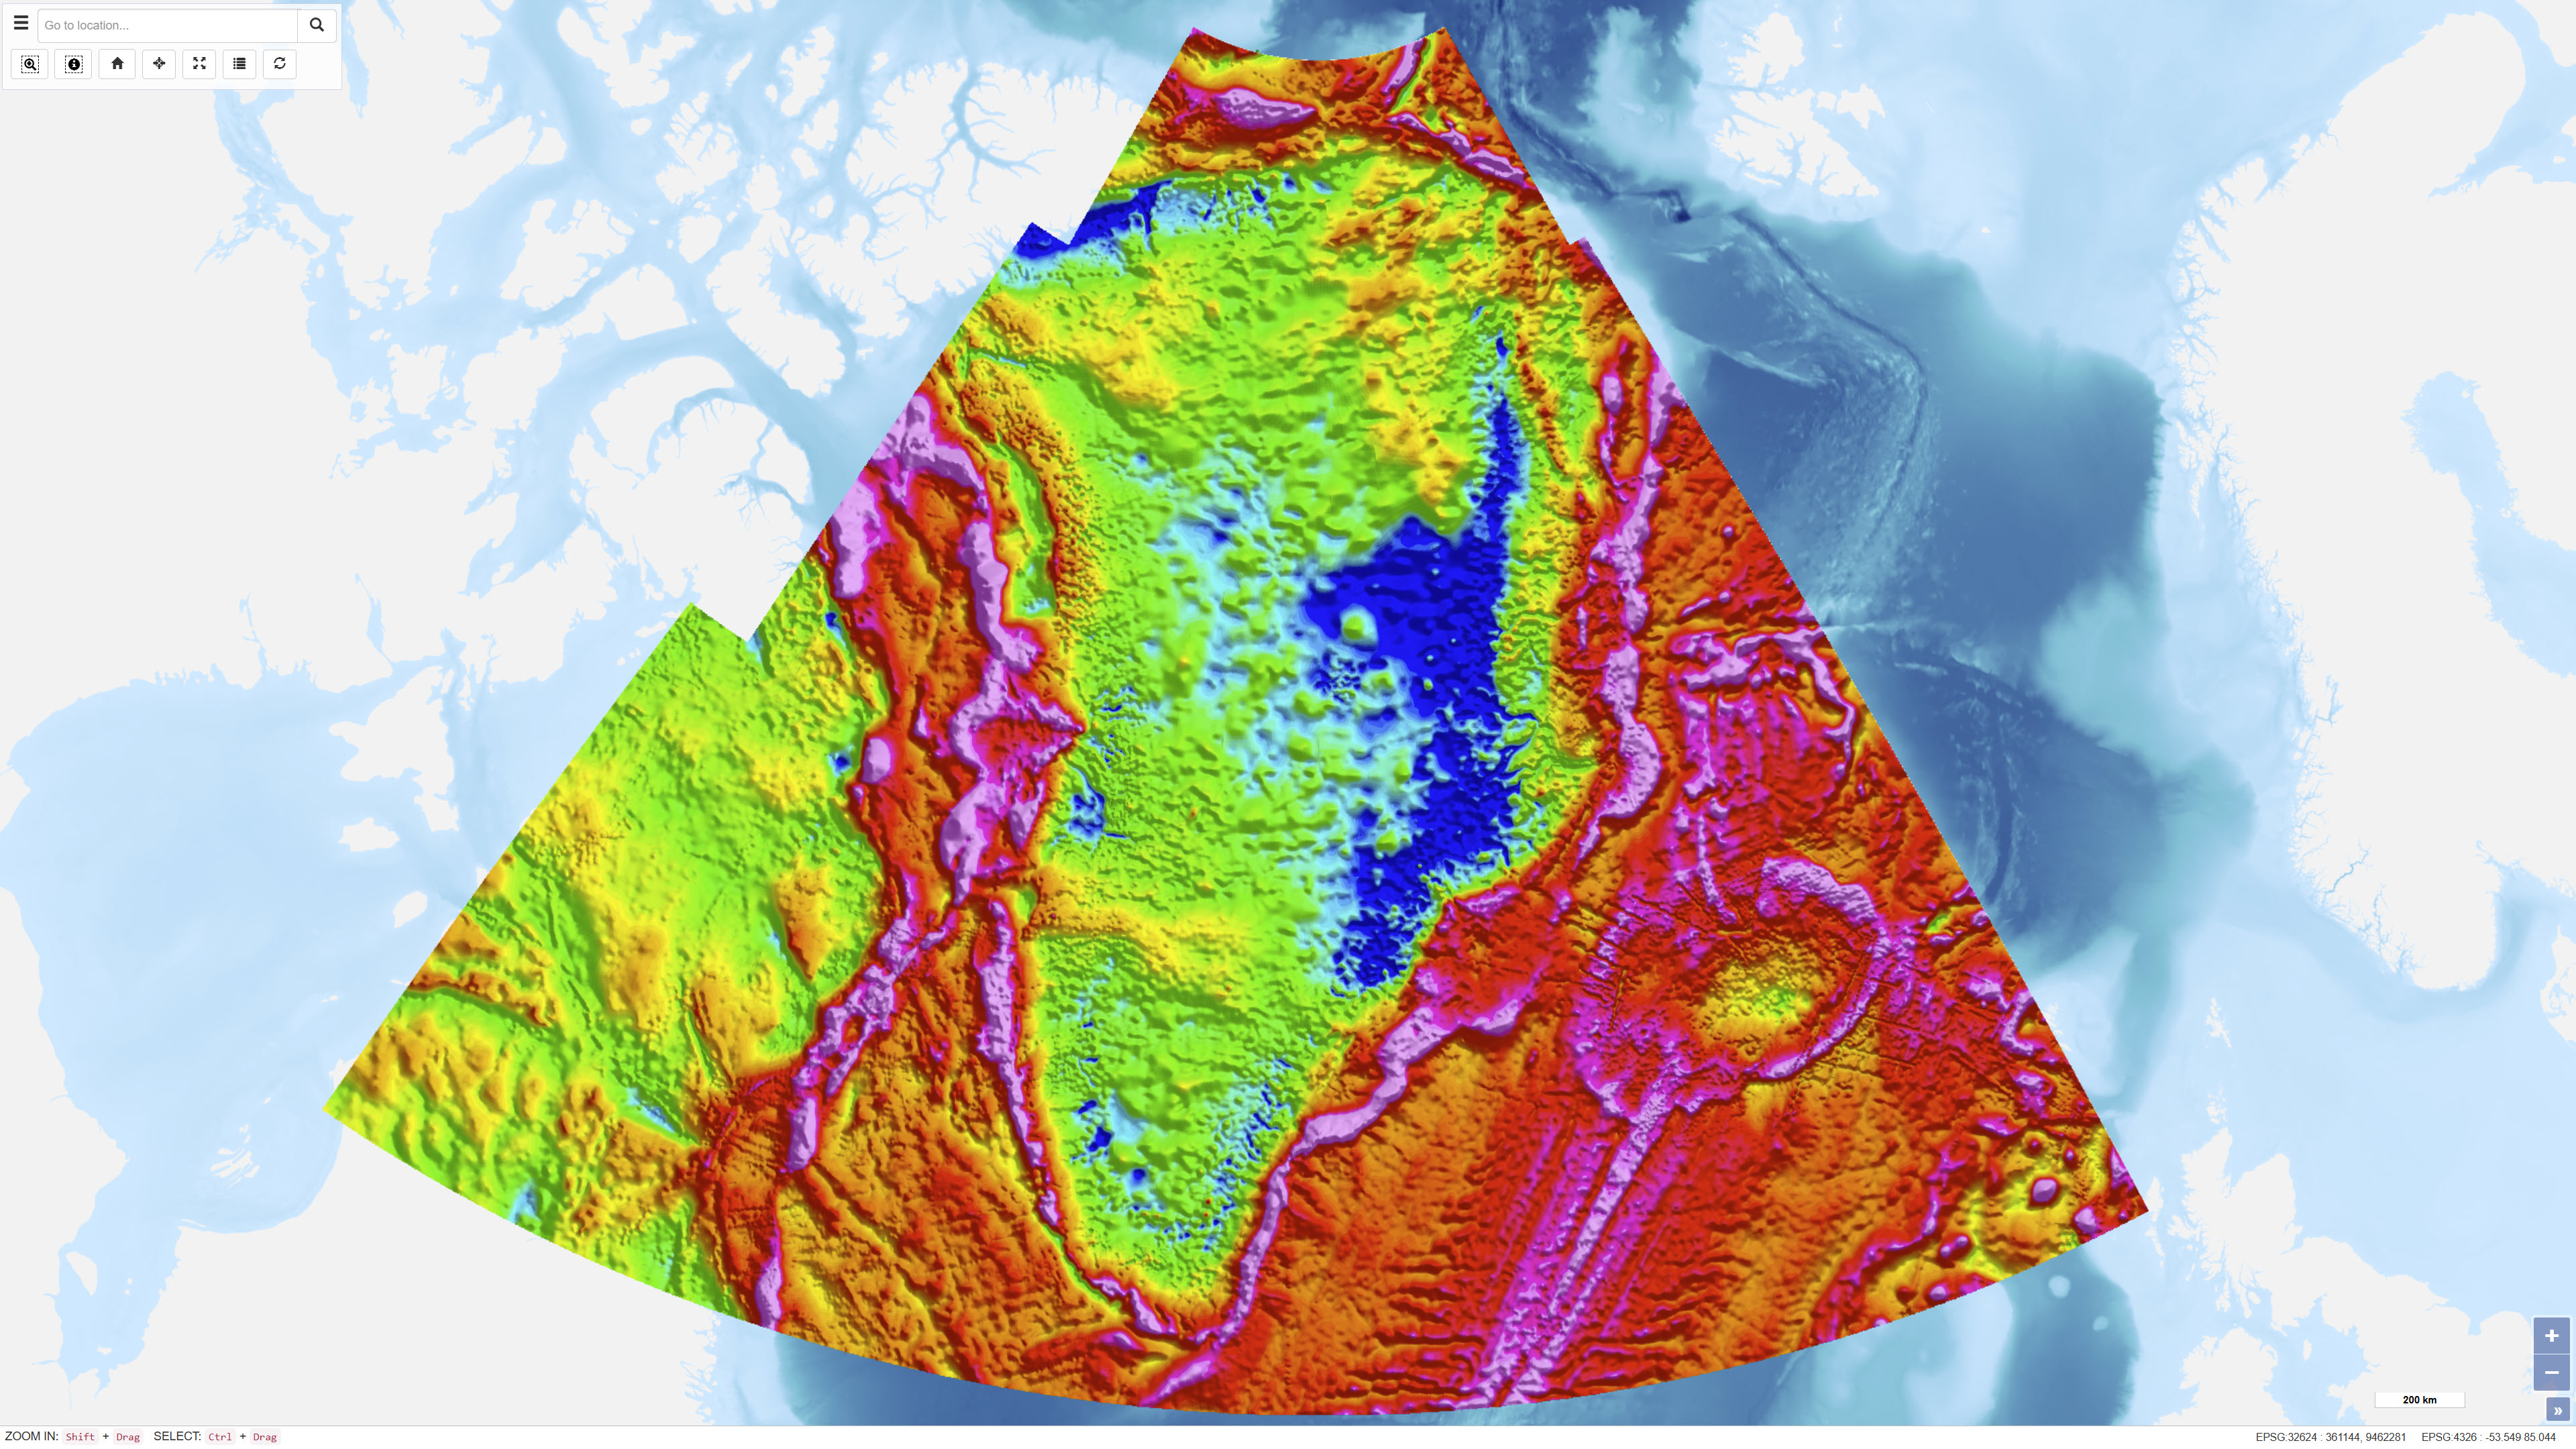
The dataset represents a regional compilation of terrestrial, marine, airborne and satellite-derived gravity data for Greenland, prepared by DTU Space. The compilation includes calculation of free-air (Faye) and terrain-corrected Bouguer anomalies based on homogenised gravity observations. In areas lacking direct measurements, satellite-derived gravity models have been applied as supplementary data. Over the Greenland Ice Sheet, Bouguer anomalies are calculated using an ice thickness model based on Bamber et al. (2013). The dataset provides a regional gravity framework for geological and geophysical interpretation.
-
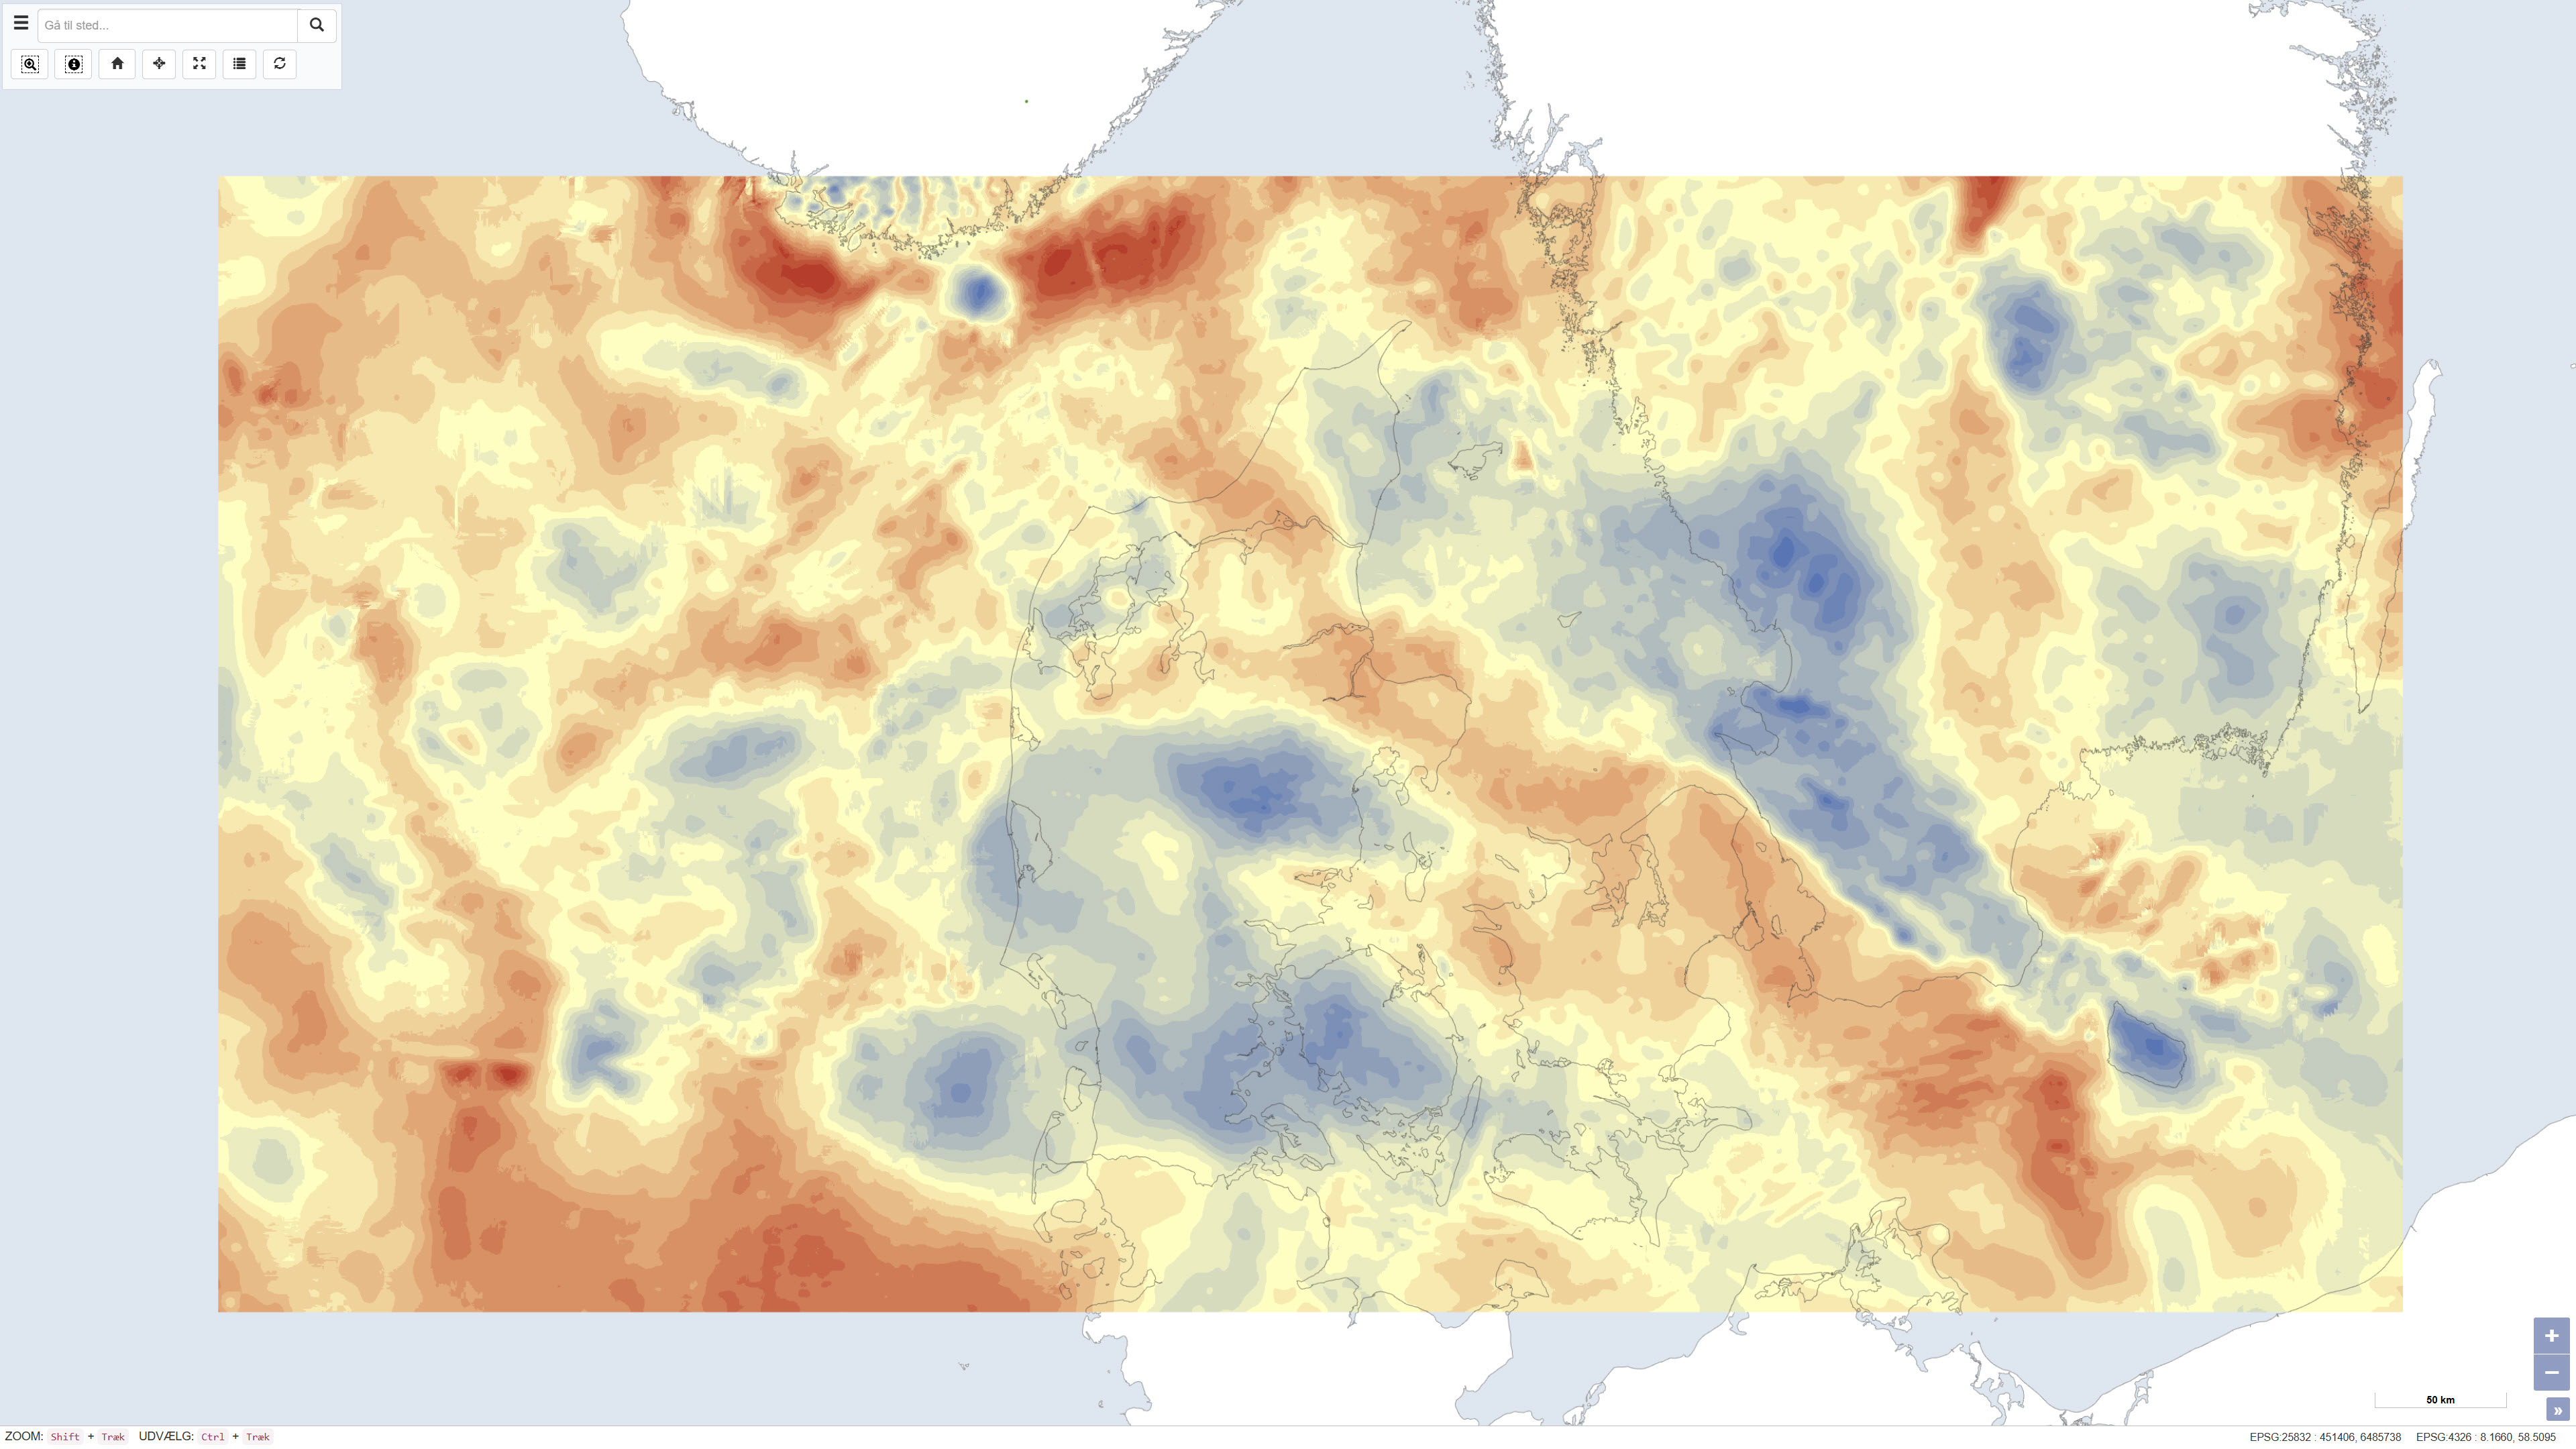
The dataset presents Bouguer gravity anomalies on land and free-air gravity anomalies in Danish marine areas based on gravity measurements from the national gravity database. The Bouguer anomaly is terrain corrected and is used to investigate variations in subsurface mass distribution, while the free-air anomaly at sea reflects variations in the gravity field without full terrain correction. Gravity anomalies are expressed in milligals (mGal). The dataset was produced by DTU Space and represents a consolidated gravimetric foundation for geological and geophysical analyses in Denmark.
-
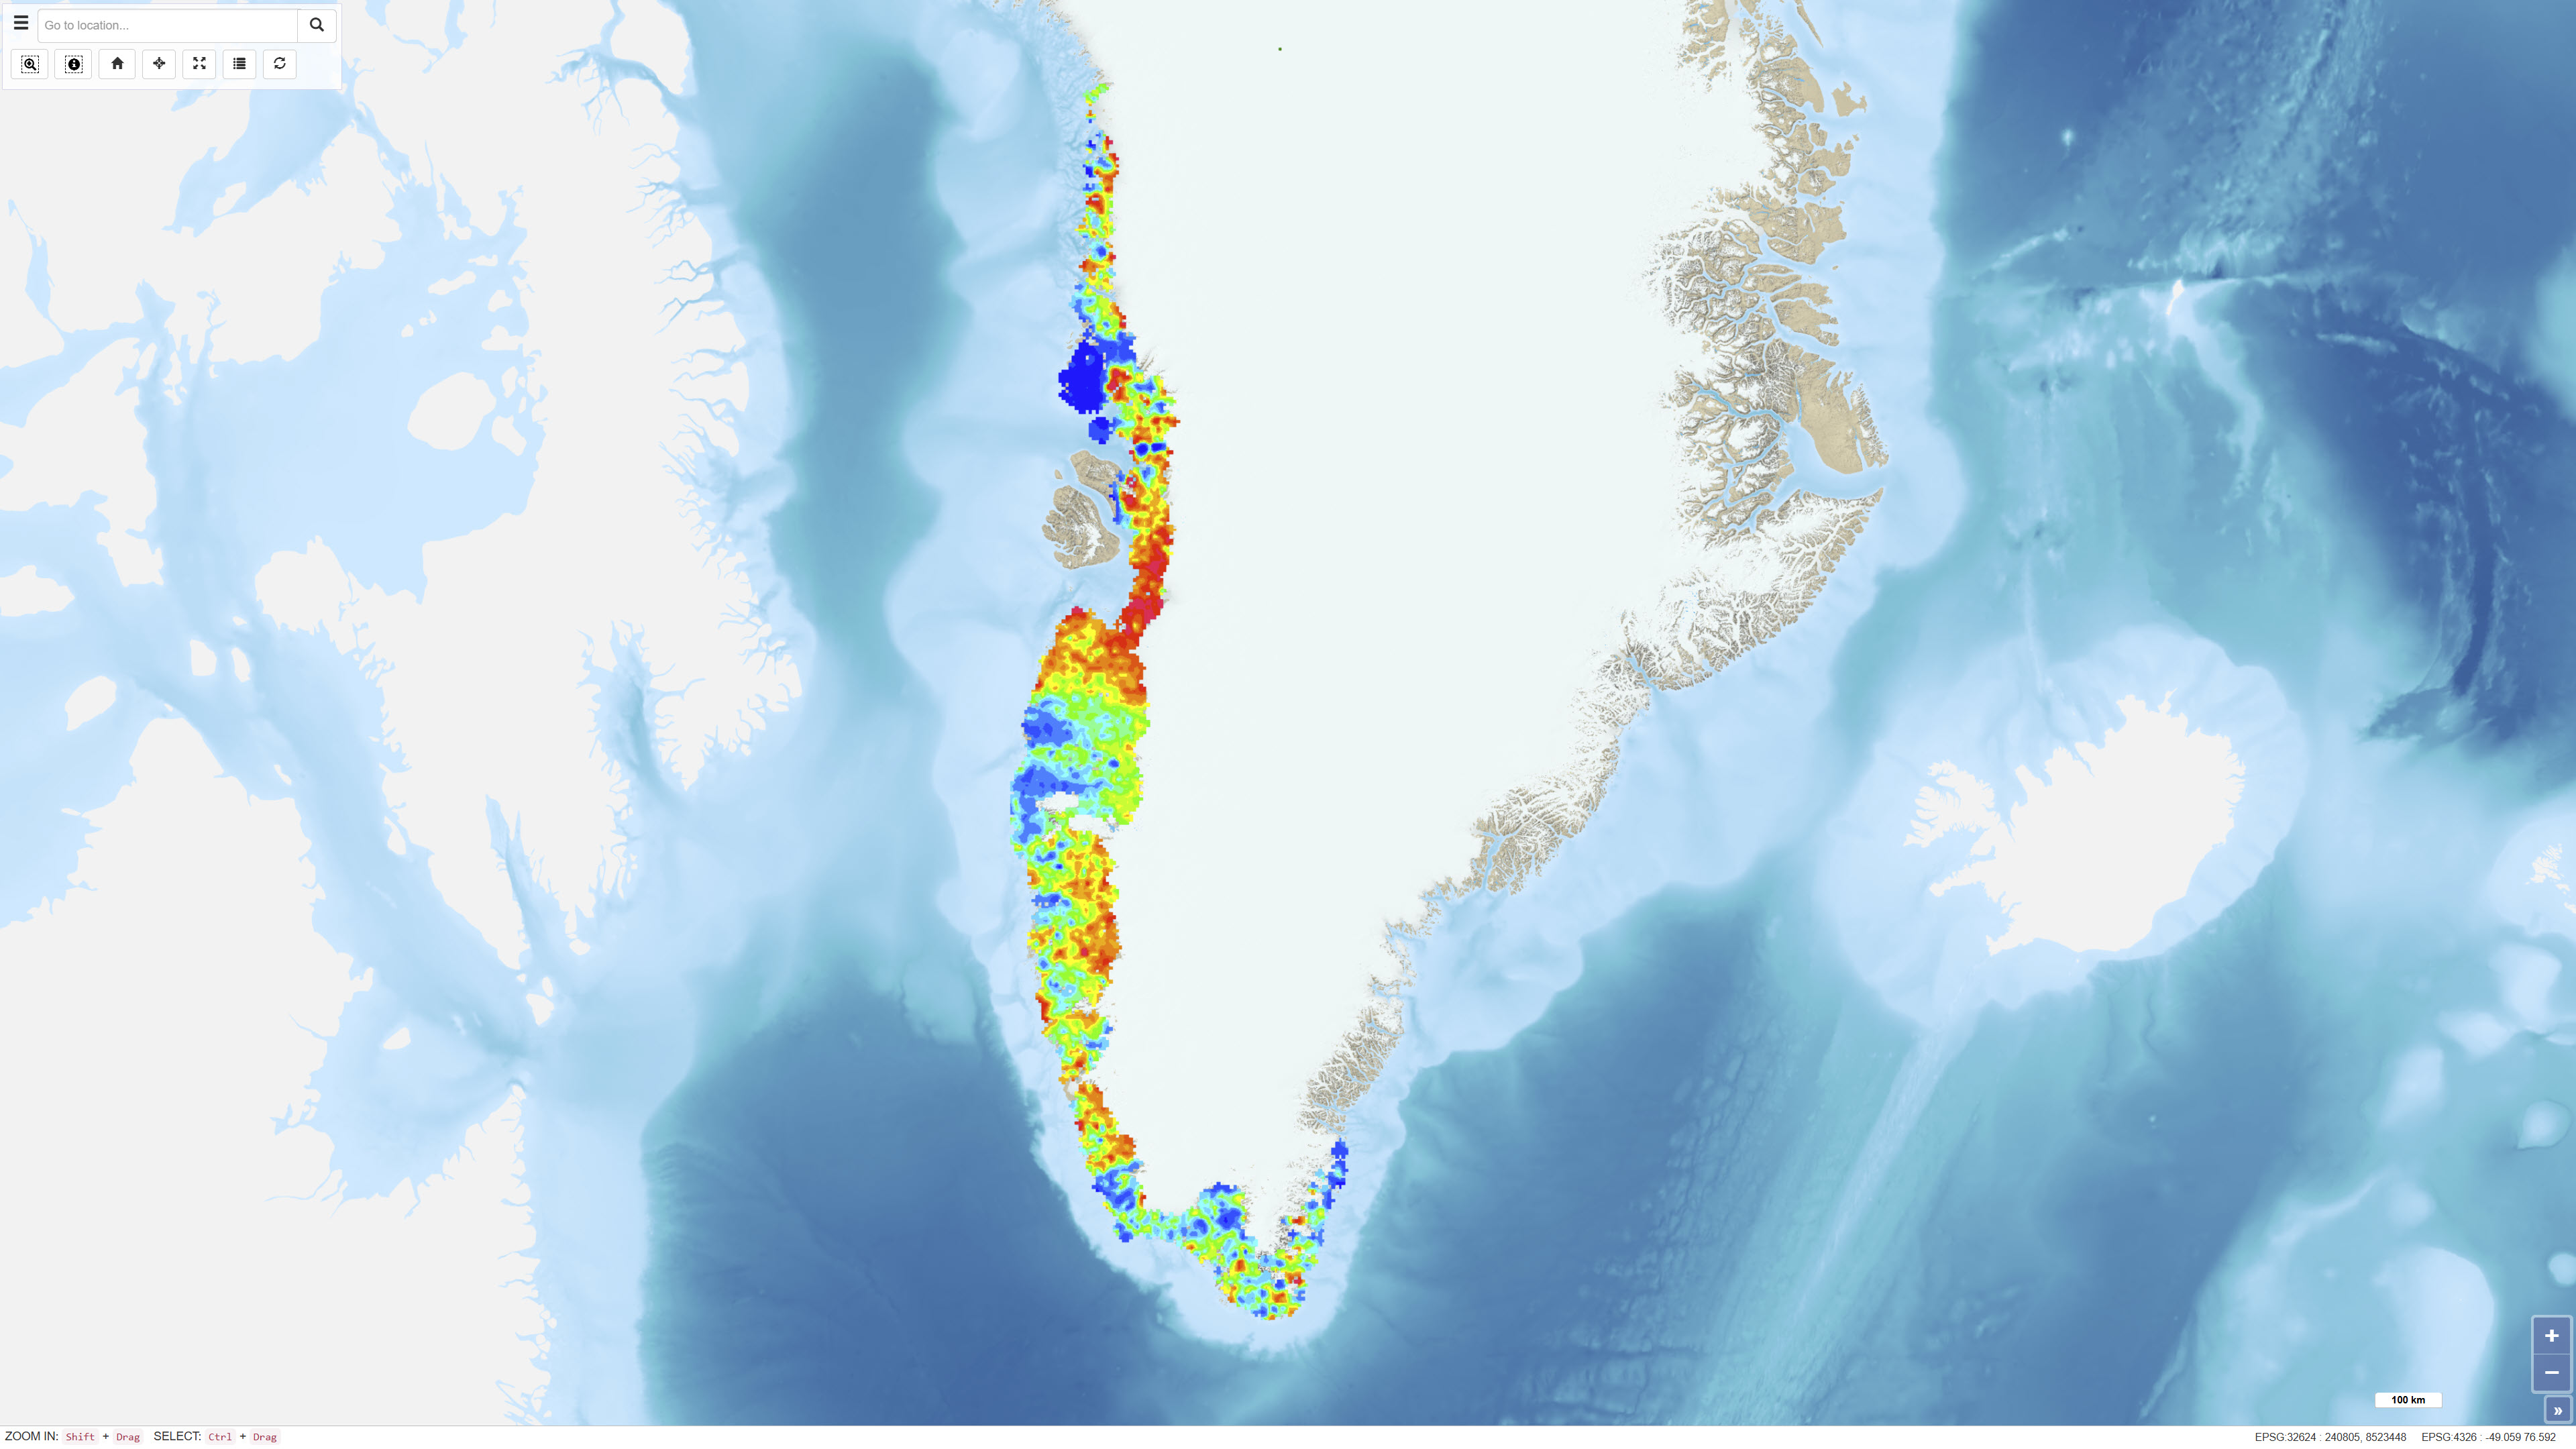
The dataset comprises digital element distribution maps based on geochemical analyses of stream sediments collected in West and South Greenland. The maps were produced as part of the geochemical mapping programme underlying the Geochemical Atlas of West and South Greenland. The data represent analyses of various elements in defined grain-size fractions and provide a regional overview of geochemical variations.
-
%20-%20datas%C3%A6t.jpg)
The dataset contains geochemical analytical results for rock samples from Greenland, collected through GEUS field and project activities and made available as an extract from GEUS’ information system GimmeX. Samples were collected for various purposes including geological mapping, geochemistry, ore geology and mineral exploration, and no systematic rock sampling was undertaken. Analytical data are organised by analytical type/method and accompanying tables document the analytical results. Sample location accuracy varies, in particular for samples collected before 1997, and older positions may have been adjusted between different map bases.
-
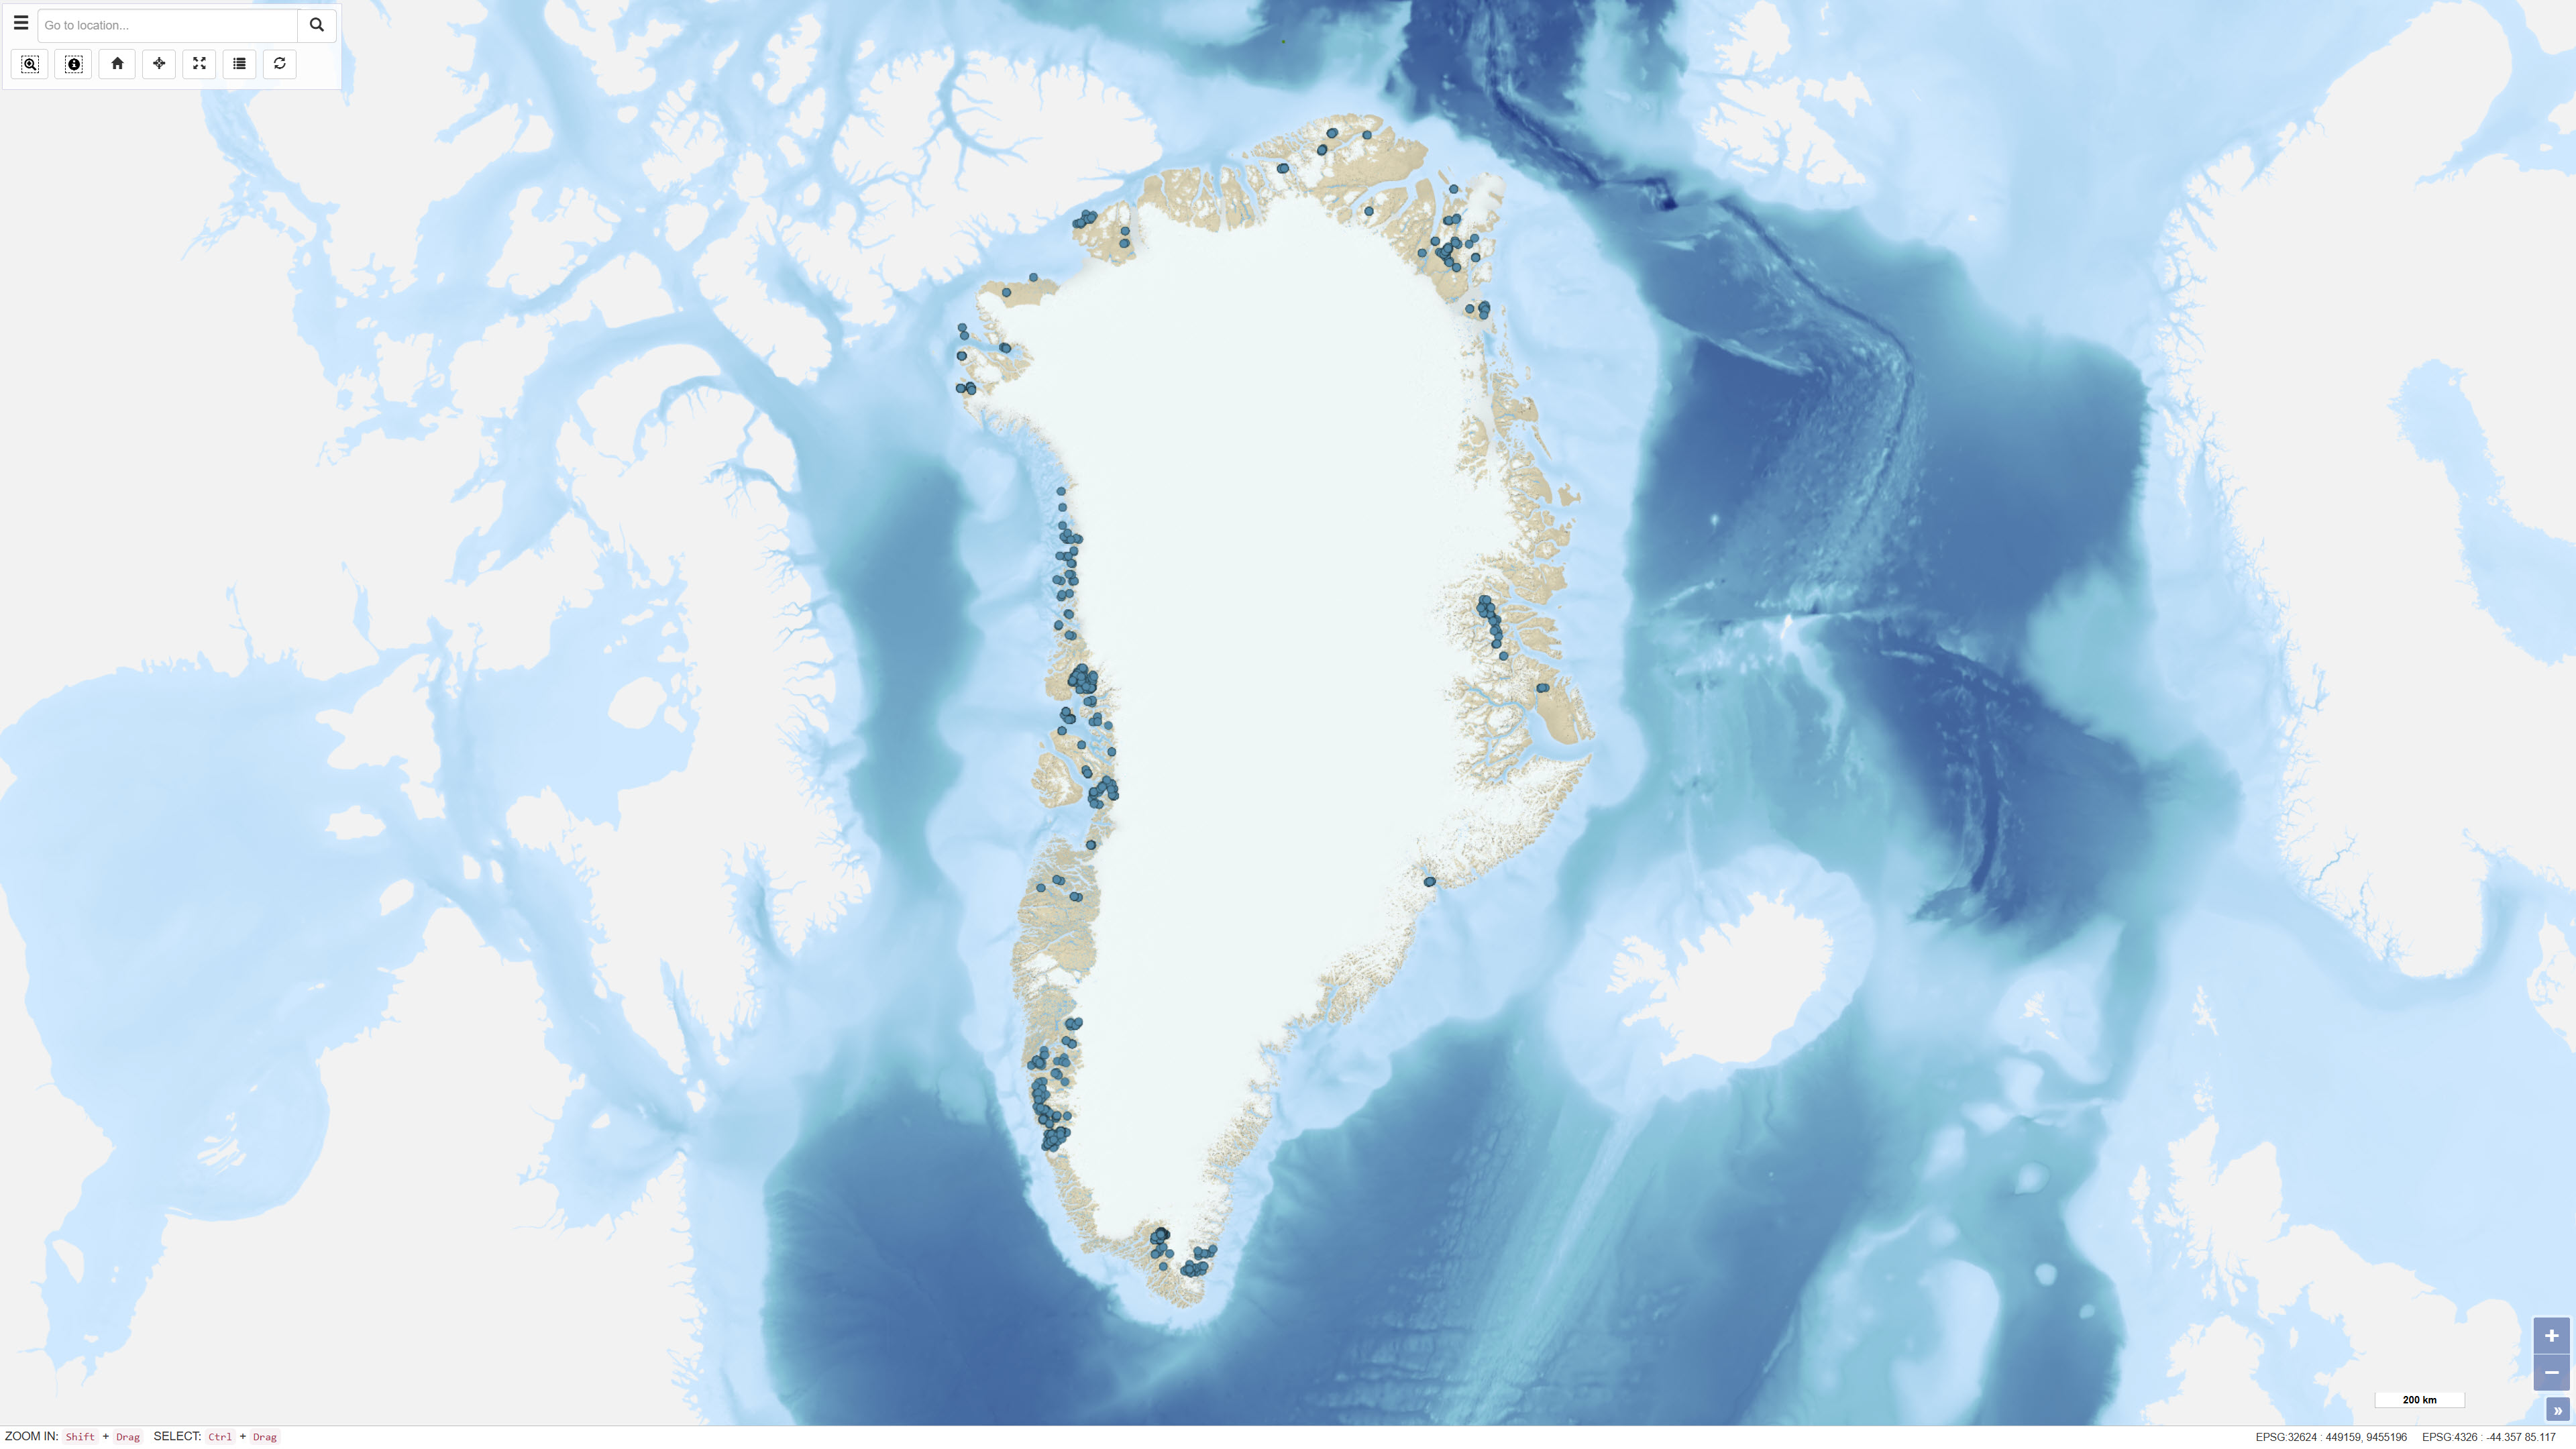
The dataset contains geochemical analytical results for 725 heavy mineral concentrate samples collected by GEUS in Greenland as part of various geological mapping and mineral exploration activities. The samples originate from several campaigns, including a regional campaign conducted between 1982 and 1986 in the Nuuk area, a 1991 campaign in the southern Nuuk region, and samples collected in 2003 in the Qaanaaq region. Additional samples derive from smaller projects and campaigns with limited documentation. Analyses were carried out at different laboratories, including Activation Laboratories and Bondar-Clegg in Canada and Risø National Laboratory in Denmark. The dataset contains raw analytical results, and metadata concerning sampling procedures and analytical quality are not complete for all samples.
-
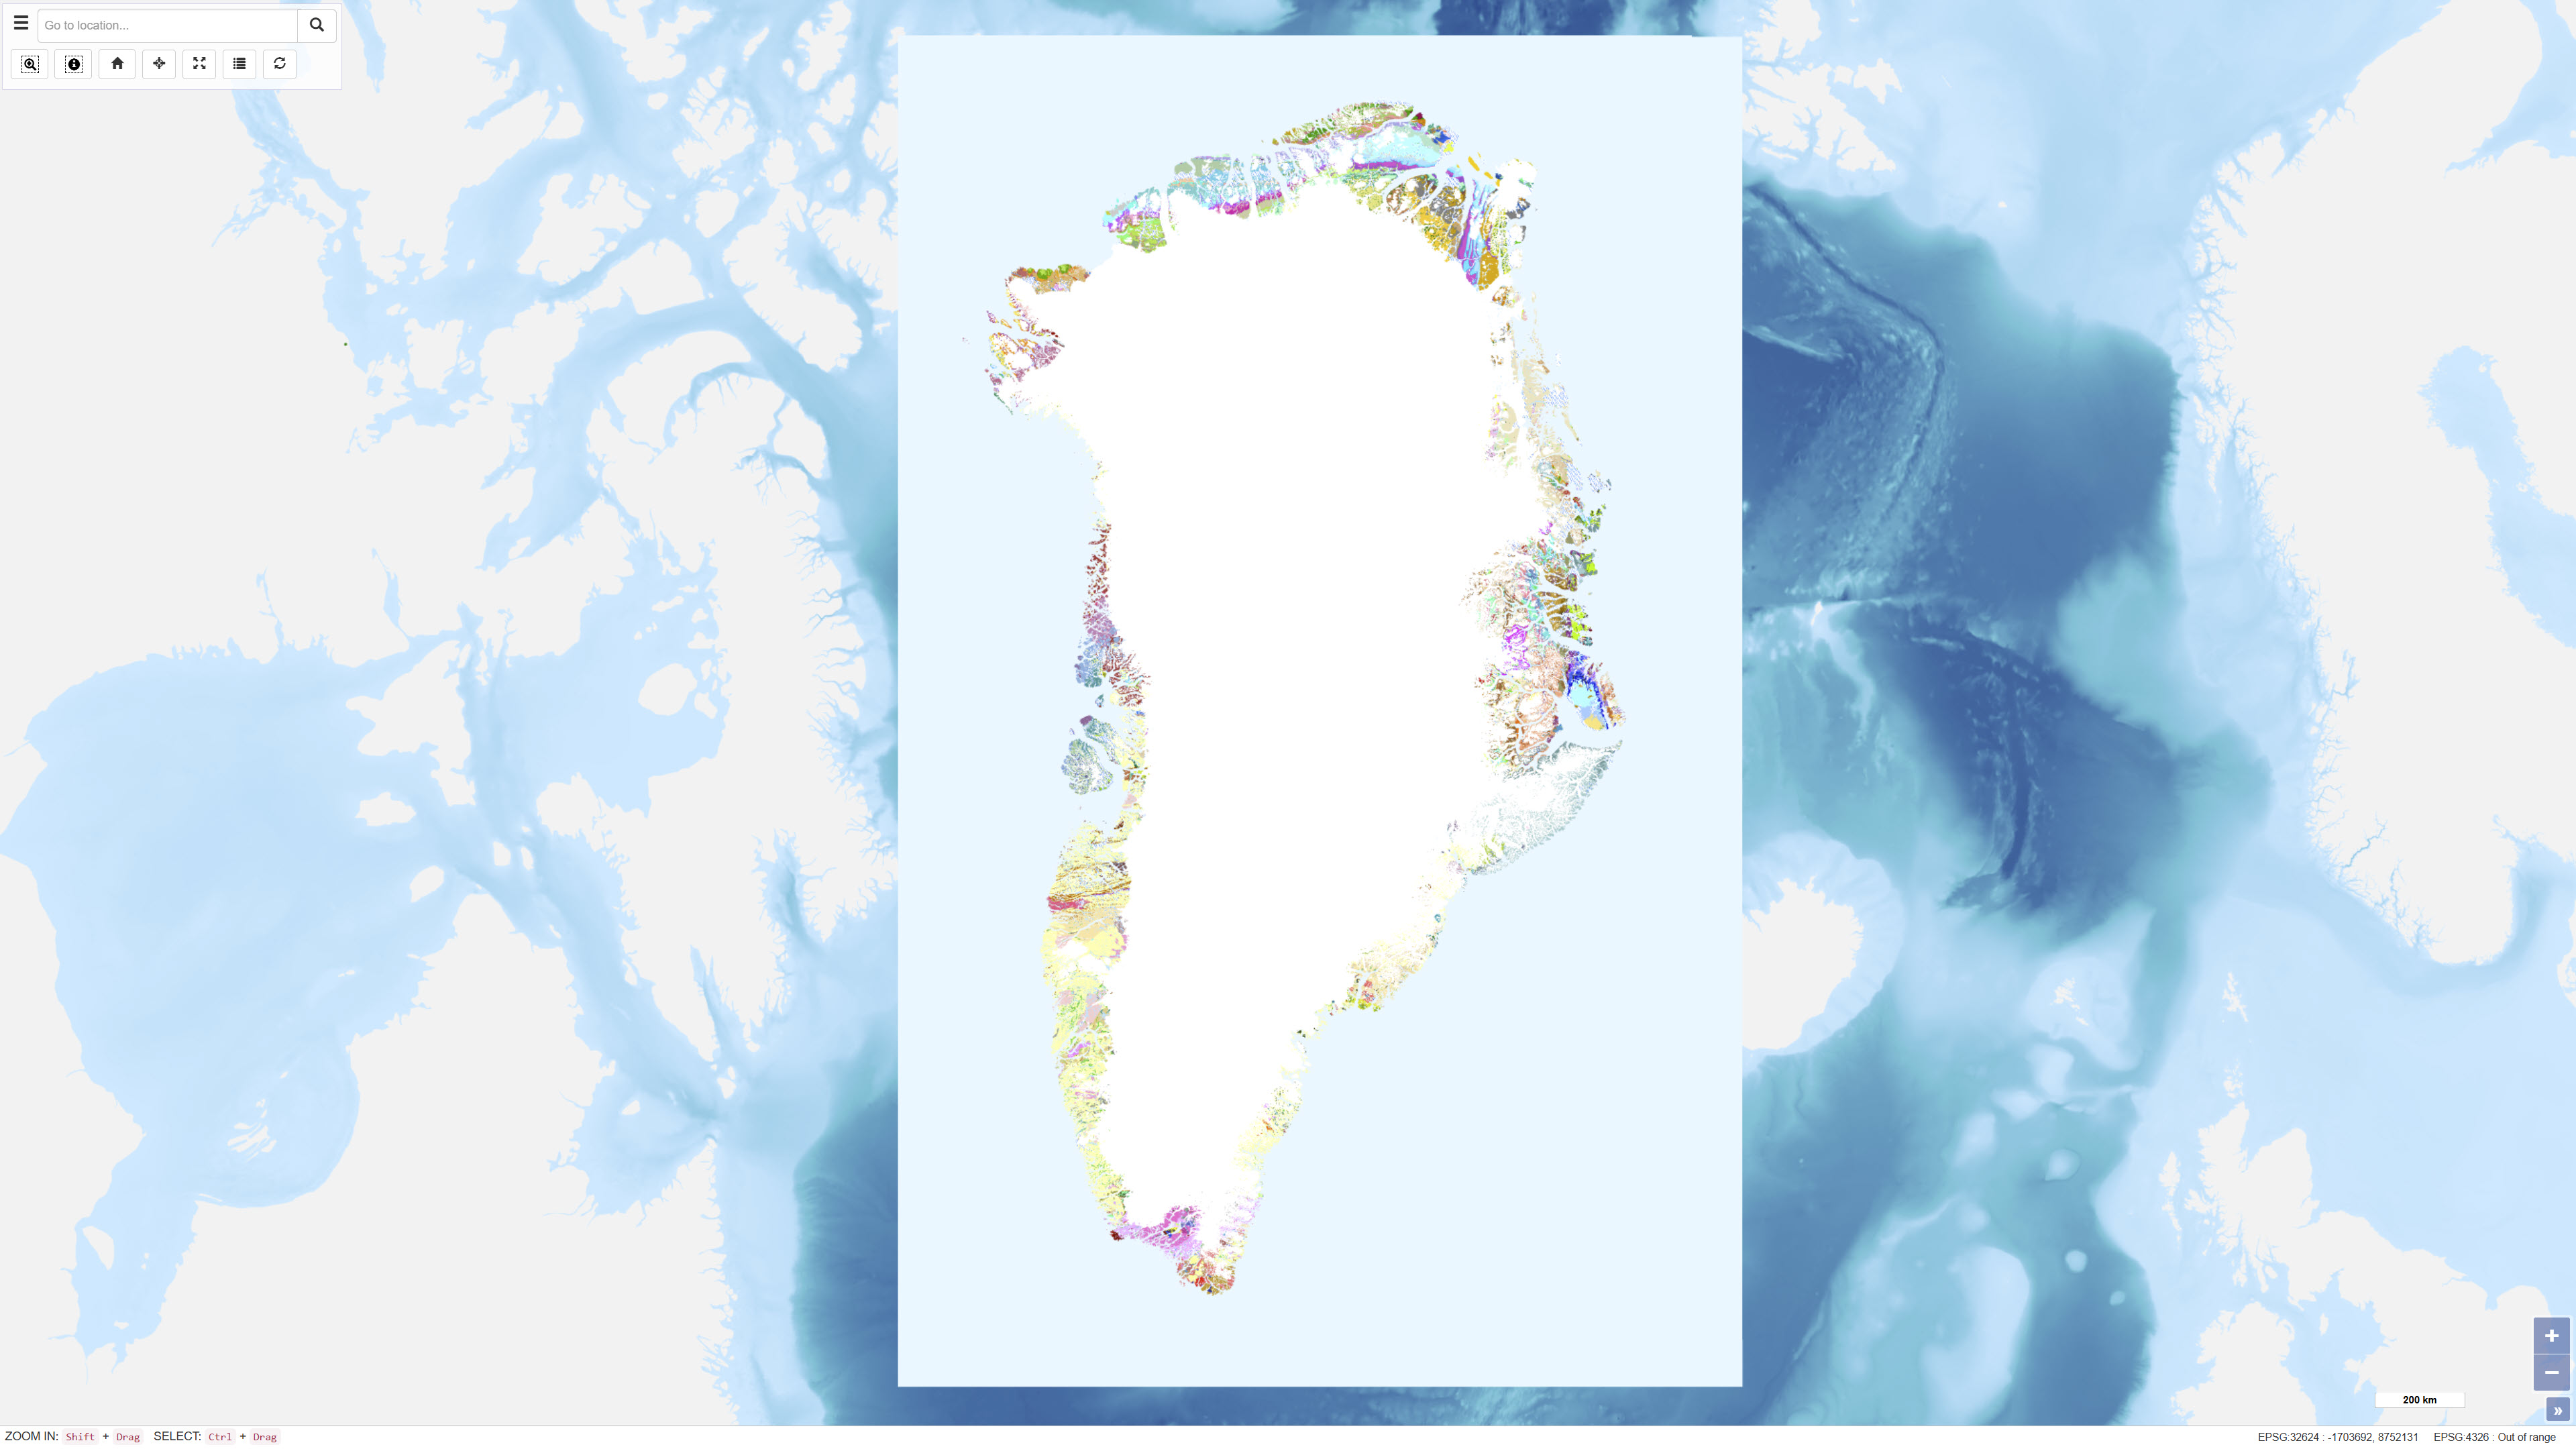
The geological map of Greenland at a scale of 1:500 000 is based on 14 digitised map sheets covering the whole of Greenland, with amendments in specific areas (Pedersen et al. 2013, GEUS Bulletin, DOI: 10.34194/geusb.v28.4727). The original digital version of the map was released through the Greenland Portal in 2012. Continued advances in geological knowledge have necessitated successive revisions in order to keep the map up to date. During the most recent update, a number of geographical areas were revised based on new geological data and interpretations, including parts of West Greenland, North Greenland, North-East Greenland, East Greenland and South-East Greenland. The updated map incorporates revised stratigraphic interpretations and improved representation of geological units and structures. The map has undergone extensive quality control, including complete harmonisation of lineaments and structural elements across map-sheet boundaries. The geological legend is dynamic and reflects the content of the current map view. Geological units are supported by descriptive information, and for most map polygons links are provided to a geological unit database containing further descriptions.
-
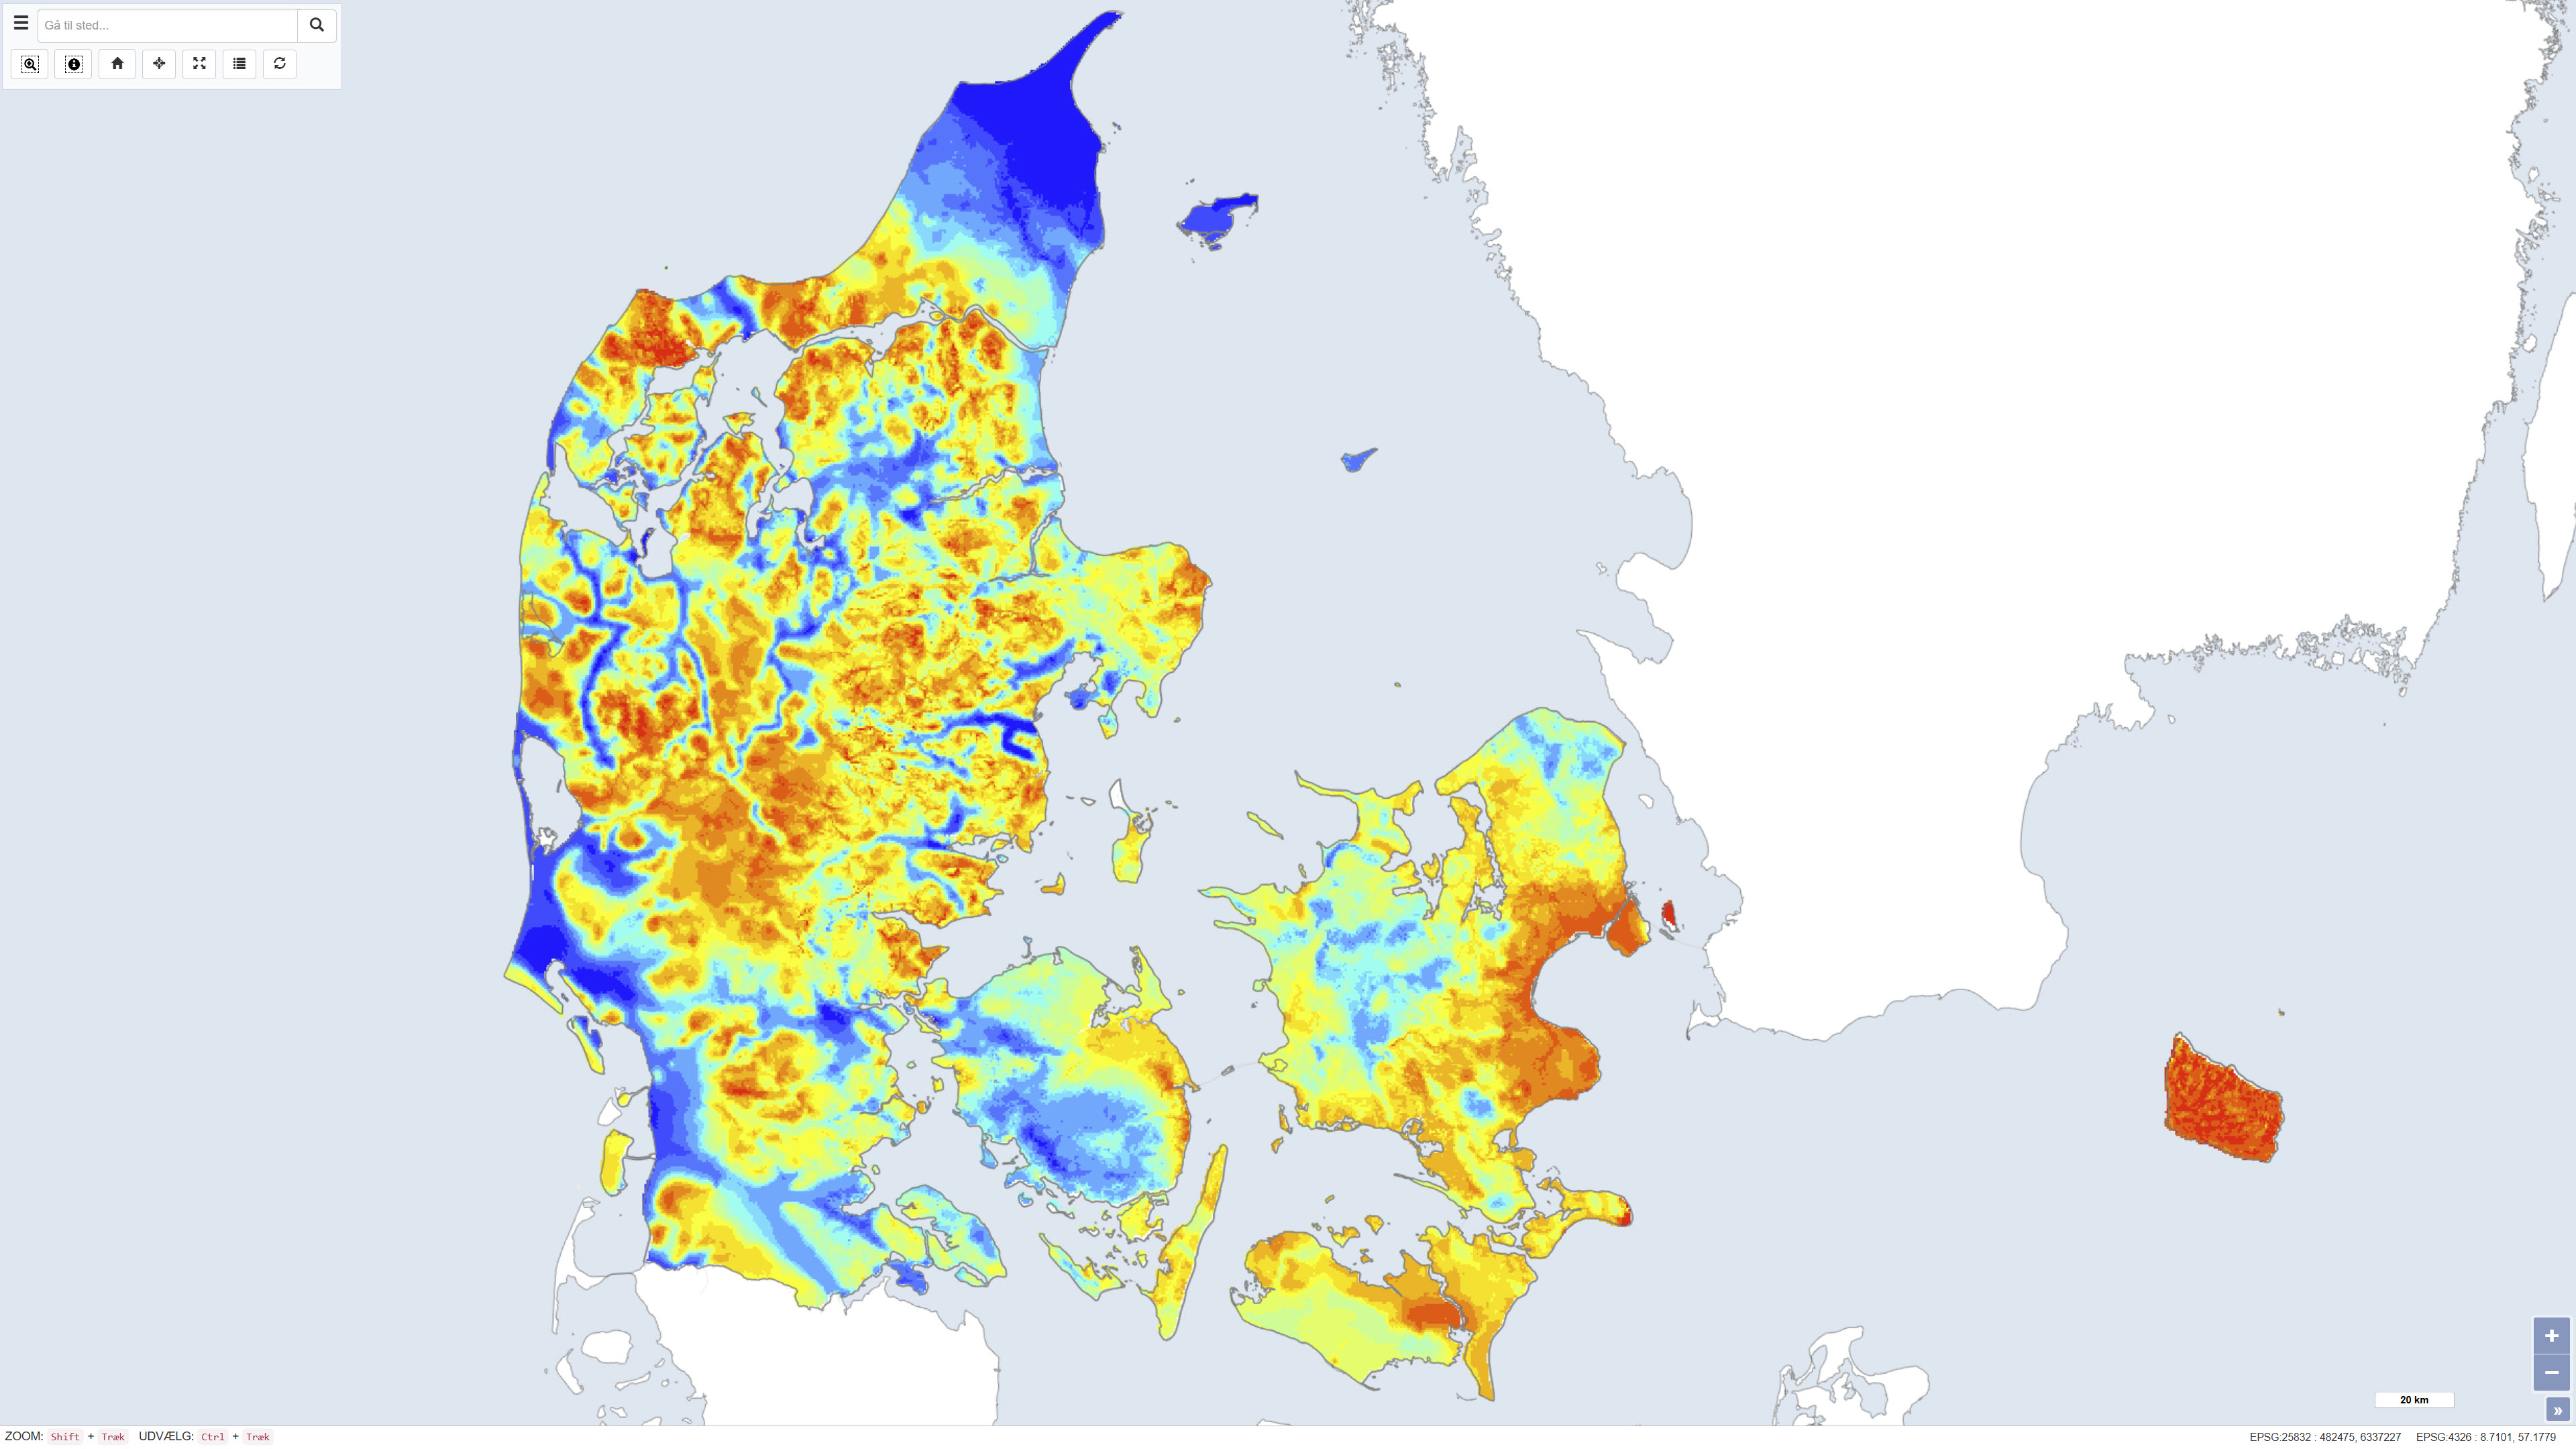
The dataset shows the thickness of Quaternary deposits in Denmark. The thickness has been calculated as the difference between surface elevation and the depth to the top of the pre-Quaternary deposits. The map provides a nationwide overview of variations in Quaternary thickness and is used in geological, hydrogeological and planning-related contexts.
-
%20-%20datas%C3%A6t.jpg)
The dataset comprises airborne electromagnetic (AEM) measurements acquired in Greenland during 1994–1998 as part of GEUS’ regional geophysical mapping programme. The surveys were conducted using helicopter- and fixed-wing electromagnetic systems and include electromagnetic response measurements as well as magnetic data. The dataset is used for regional mapping of subsurface electrical conductivity and for identifying structural and lithological variations relevant to geological interpretation and mineral exploration.
-
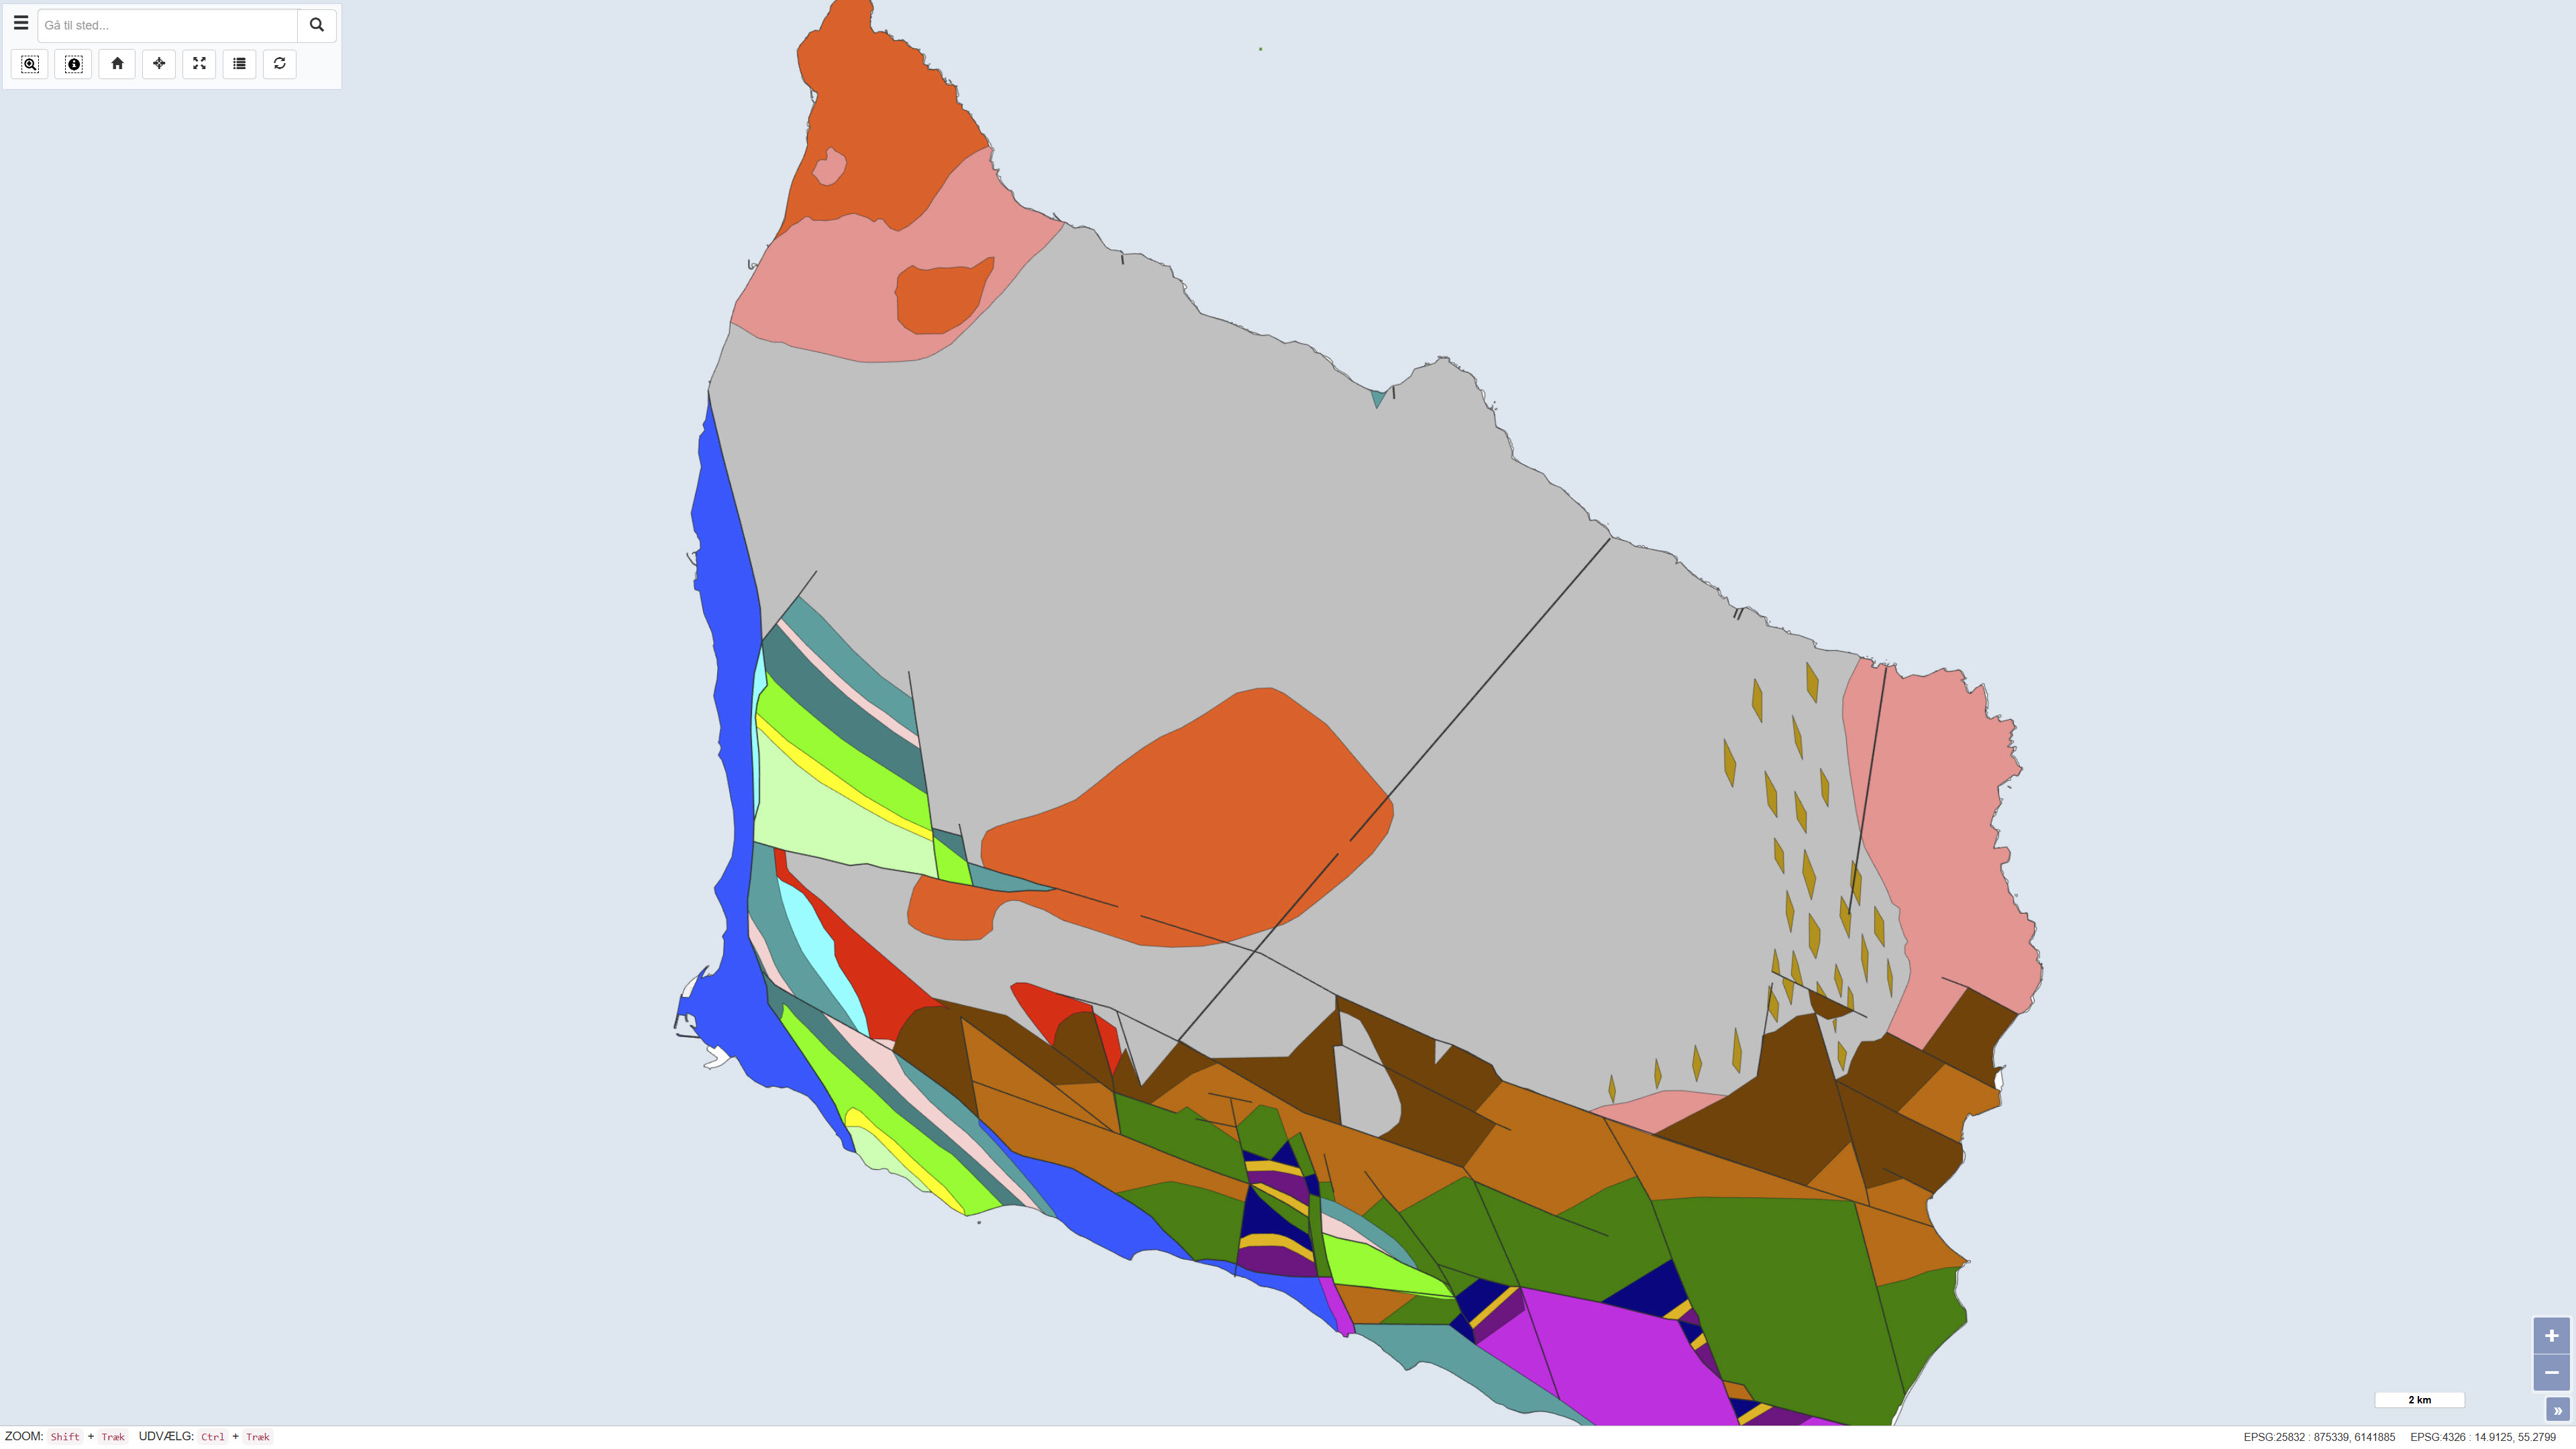
The dataset shows the pre-Quaternary surface of Bornholm and illustrates the distribution of pre-Quaternary rock units and geological structures beneath the Quaternary deposits. The map is based on geological interpretations carried out by Helge Gry in 1960 and 1969 and was published in the journal VARV in 1977. The pre-Quaternary geology of Bornholm differs significantly from the rest of Denmark and is characterised by complex fault systems and a combination of crystalline basement and sedimentary rocks. The map represents a historical, synthesised overview of the pre-Quaternary surface and remains an important reference in geological studies.