 Arctic SDI catalogue
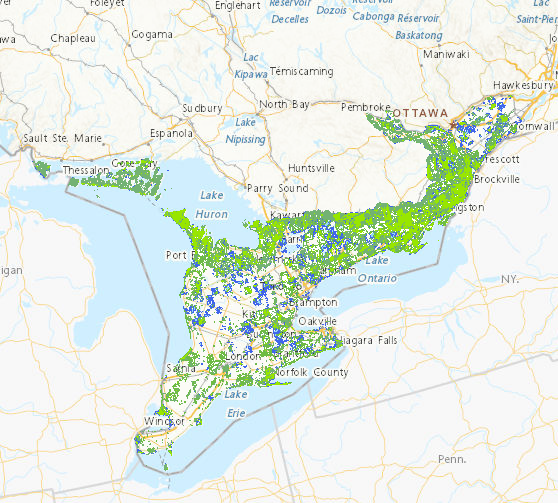
Ontario (ON)
Type of resources
Available actions
Topics
Keywords
Contact for the resource
Provided by
Formats
Representation types
Update frequencies
status
-

This dataset is part of Environment and Climate Change Canada’s Shoreline Classification and Pre-Spill database. Shoreline classification data has been developed for use by the Environmental Emergencies Program of Environment and Climate Change Canada for environmental protection purposes. Marine and freshwater shorelines are classified according to the character (substrate and form) of the upper intertidal (foreshore) or upper swash zone (Sergy, 2008). This is the area where oil from a spill usually becomes stranded and where treatment or cleanup activities take place. The basic parameter that defines the shoreline type is the material that is present in the intertidal zone. The presence or absence of sediments is a key factor in determining whether oil is stranded on the surface of a substrate or can penetrate and/or be buried. This dataset contains thousands of linear shoreline segments ranging in length from 200 m and 2 km long. The entities represent the location of the segments and their geomorphological description. There exist further fields in the attribute table for this dataset. We are currently working on standardizing our shoreline segmentation datasets and the updated data will soon be uploaded to the catalog. Sergy, G. (2008). The Shoreline Classification Scheme for SCAT and Oil Spill Response in Canada. Proceedings of the 31stArctic and Marine Oil Spill Program Technical Seminar.Environment Canada, Ottawa, ON, Pp. 811-819.
-
This dataset includes water chemistry data collected from five of the six lakes as part of the Northwestern Ontario Size Series project in 1987 and 1990 including species of nitrogen and phosphorus, carbon, chlorophyll a, conductivity, soluble reactive silica, chloride, sulphate, conductivity, sodium, potassium, magnesium, calcium, pH, alkalinity and organic acids
-

The Great Lakes Migrant Waterfowl Surveys provide periodic data on waterfowl abundance, spatial and temporal distributions, and use along the shorelines of major water bodies and river systems in Ontario during mostly during spring and fall, and to a lesser extent during summer and winter, seasons. The primary survey area covers the shoreline and nearshore (~1km) waters of the Lower Great Lakes region of Ontario, specifically including the St. Lawrence River, Lake Ontario, Niagara River, Lake Erie, Detroit River and Lake St. Clair and associated major marshes and embayments. Aerial surveys, typically flown several times within spring (March –May: 1969, 1971, 1972, 1975 –1979, 1981, 1982, 1984 –1988, 1991 –1996, 1998 –2003 & 2009 –2011) and fall (September –December: 1968, 1970, 1971, 1974 –2003 & 2009 –2011) survey periods, have been conducted periodically on a relatively regular basis (approx. 5-10 years) along the Lower Great Lakes shorelines between 1968 and 2011. Smaller-scale surveys also have been conducted periodically during summer (June –August: 1968 –1970, 1972, 1974, 1975, 1977, 1982, 1984, 1986, 1989, 1999 & 2002) in this region. This survey often has been conducted in conjunction with the Midwinter Survey, so its data (up to 2004) also are included in the CWS Migrant Waterfowl Surveys database (Year ≥2004 & Month = January & February).Data from several aerial surveys conducted periodically during the non-breeding period outside the Lower Great Lakes region also are included in this database. Spring and fall surveys have been conducted along the shorelines and nearshore waters of the Upper Great Lakes region of Ontario, specifically at St. Clair River (Fall 2012 & 2013), Lake Huron (Fall 1973, 1996; Spring 1974) / Georgian Bay (Fall 1973, 1996, 2012 & 2013) & Lake Superior (Fall 2000). Aerial surveys also have been conducted inland in southeastern Ontario along the Rideau River (Fall 1998 & Spring 1999).
-

The Canadian Wildlife Service - Ontario Region Biodiversity Atlas represents the Canadian Wildlife Service biodiversity portfolio across the Ontario portions of the Boreal Hardwood Shield (Bird Conservation Region 12) and Mixedwood Plains (Bird Conservation Region 13) ecozones. These data are the derived product from an extensive landscape assessment that assessed the Canadian Wildlife Service biodiversity portfolio (Species at Risk, migratory birds, habitat) at various resolutions. Biodiversity is mapped by forest, grassland (open country) and wetland quality and quantity, and then progressively combined to identify local High Value Biodiversity Areas. At the finest resolution, scores were applied to each unit of analysis (5 hectare hexagon in Bird Conservation Region 12; 2 hectare hexagon in Bird Conservation Region 13), based on over 30 criteria for landscape habitat condition, Species at Risk and migratory birds. Habitat condition scores were derived from guidance in Environment and Climate Change Canada's existing How Much Habitat is Enough? and in Bird Conservation Region 12, where the landscape is less fragmented, habitat was also based on draft guidance in How Much Disturbance is too Much? Individual scores were summed and various combinations (e.g. top 25% of forest scores + top 25% of Species at Risk (SAR) scores) were calculated to identify areas with multiple conservation value. For each habitat type (forest, grassland and wetland), study units with more than one conservation value were aggregated into High Value Habitat which were subsequently aggregated into High Value Biodiversity Areas (HVBA). The results are areas on the landscape that have high value from a Canadian Wildlife Service specific lens; that is, they are high quality habitats that are important for Species at Risk and/or migratory birds. High value habitats are those forests, grasslands and wetlands with potential high conservation value (PHCV). They contain at least 1 of a possible 3 potential high conservation values: top 25% of overall habitat scores, top 25% of Species at Risk (SAR) scores, and/or top 25% of relevant migratory bird scores. High value forest, grassland and wetland were derived by combining landscape, Species at Risk (SAR) and migratory bird elements (see Table 1). Overall habitat scores were assigned to each study unit based on the combined scores for each forest, grassland and wetland. These overall habitat scores were divided into quartiles, and the top 25% of each total score (overall forest, overall grassland and overall wetland) are considered to be potential high conservation value. Similarly, SAR scores were assigned for each study unit, totalled and broken into quartiles. The top 25% of SAR scores that intersect each of forest, grassland and wetland are considered to be the highest quality habitats important to SAR and have potential high conservation value. Finally, relevant migratory bird scores were totalled within each study unit, divided into quartiles and the top 25% of migratory bird scores that intersect each of forest, grassland and wetland are considered to be the highest quality habitats important to migratory birds and have potential high conservation value. Study units with a PHCV greater than 0 (i.e., contains at least 1 of the possible 3 potential high conservation values) were aggregated together by 750 m to create High Value Habitats. High value biodiversity areas (HVBAs) are those study units that contain multiple high value habitats (high value forest and/or high value grassland and/or high value wetland). High value biodiversity areas (HVBA) were derived by aggregating high value forest, grassland and wetland. Study units with a potential high conservation value greater than 1 were aggregated together by 750 m. Biodiversity sites are areas greater than 20 ha, and secondary biodiversity sites are areas less than 20 ha in area.
-
Multi-model ensembles for a suite of variables based on projections from Coupled Model Intercomparison Project Phase 6 (CMIP6) global climate models (GCMs) are available for 1850-2100 on a common 1x1 degree global grid. Climate projections vary across GCMs due to differences in the representation and approximation of earth systems and processes, and natural variability and uncertainty regarding future climate drivers. Thus, there is no single best climate model. Rather, using results from an ensemble of models (e.g., taking the average) is best practice, as an ensemble takes model uncertainty into account and provides more reliable climate projections. Provided on Canadian Climate Data and Scenarios (CCDS) are four types of products based on the CMIP6 multi-model ensembles: time series datasets and plots, maps and associated datasets, tabular datasets, and global gridded datasets. Monthly, seasonal, and annual ensembles are available for up to six Shared Socioeconomic Pathways (SSPs) (SSP1-1.9, SSP1-2.6, SSP2-4.5, SSP3-7.0, SSP4-6.0, and SSP5-8.5), four future periods (near-term (2021-2040), mid-term (2041-2060 and 2061-2080), end of century (2081-2100)), and up to five percentiles (5th, 25th, 50th (median), 75th, and 95th) of the CMIP6 ensemble distribution. The number of models in each ensemble differs according to model availability for each SSP and variable, see the model list resource for details on the models included in each ensemble. The majority of products show projected changes expressed as anomalies according to a historical reference period of 1995-2014. The products provided include global, national, and provincial/territorial datasets and graphics. For more information on the CMIP6 multi-model ensembles, see the technical documentation resource.
-

The Canadian Wildlife Service - Ontario Region Biodiversity Atlas represents the Canadian Wildlife Service biodiversity portfolio across the Ontario portions of the Boreal Hardwood Shield (Bird Conservation Region 12) and Mixedwood Plains (Bird Conservation Region 13) ecozones. These data are the derived product from an extensive landscape assessment that assessed the Canadian Wildlife Service biodiversity portfolio (Species at Risk, migratory birds, habitat) at various resolutions. Biodiversity is mapped by forest, grassland (open country) and wetland quality and quantity, and then progressively combined to identify local High Value Biodiversity Areas. At the finest resolution, scores were applied to each unit of analysis (5 hectare hexagon in Bird Conservation Region 12; 2 hectare hexagon in Bird Conservation Region 13), based on over 30 criteria for landscape habitat condition, Species at Risk and migratory birds. Habitat condition scores were derived from guidance in Environment and Climate Change Canada's existing How Much Habitat is Enough? and in Bird Conservation Region 12, where the landscape is less fragmented, habitat was also based on draft guidance in How Much Disturbance is too Much? Individual scores were summed and various combinations (e.g. top 25% of forest scores + top 25% of Species at Risk (SAR) scores) were calculated to identify areas with multiple conservation value. For each habitat type (forest, grassland and wetland), study units with more than one conservation value were aggregated into High Value Habitat which were subsequently aggregated into High Value Biodiversity Areas (HVBA). The results are areas on the landscape that have high value from a Canadian Wildlife Service specific lens; that is, they are high quality habitats that are important for Species at Risk and/or migratory birds. High value habitats are those forests, grasslands and wetlands with potential high conservation value (PHCV). They contain at least 1 of a possible 3 potential high conservation values: top 25% of overall habitat scores, top 25% of Species at Risk (SAR) scores, and/or top 25% of relevant migratory bird scores. High value forest, grassland and wetland were derived by combining landscape, Species at Risk (SAR) and migratory bird elements (see Table 1). Overall habitat scores were assigned to each study unit based on the combined scores for each forest, grassland and wetland. These overall habitat scores were divided into quartiles, and the top 25% of each total score (overall forest, overall grassland and overall wetland) are considered to be potential high conservation value. Similarly, SAR scores were assigned for each study unit, totalled and broken into quartiles. The top 25% of SAR scores that intersect each of forest, grassland and wetland are considered to be the highest quality habitats important to SAR and have potential high conservation value. Finally, relevant migratory bird scores were totalled within each study unit, divided into quartiles and the top 25% of migratory bird scores that intersect each of forest, grassland and wetland are considered to be the highest quality habitats important to migratory birds and have potential high conservation value. Study units with a PHCV greater than 0 (i.e., contains at least 1 of the possible 3 potential high conservation values) were aggregated together by 750 m to create High Value Habitats. High value biodiversity areas (HVBAs) are those study units that contain multiple high value habitats (high value forest and/or high value grassland and/or high value wetland). High value biodiversity areas (HVBA) were derived by aggregating high value forest, grassland and wetland. Study units with a potential high conservation value greater than 1 were aggregated together by 750 m. Biodiversity sites are areas greater than 20 ha, and secondary biodiversity sites are areas less than 20 ha in area.