 Arctic SDI catalogue
Protect and Restore Species
Type of resources
Available actions
Topics
Keywords
Contact for the resource
Provided by
Formats
Representation types
Update frequencies
status
-
These shorebird surveys are conducted intermittently at a series of sites near the town of Tofino on the west coast of Vancouver Island, British Columbia, during northward (April to May) and southward migration (July to November). This survey includes all shorebird species. Surveyors used binoculars or a spotting scope to count the total number of shorebirds present within the natural boundaries of each survey site during the northward and/or southward migration periods. They used a boat to count birds within the entire area of Arakun Flats and Ducking Flats by traveling along the outer edge of the mudflats, and by stopping at standardized vantage points on land. They also used a boat to view as much area as possible within Maltby Slough, South Bay and Grice Bay from the openings to each of these bays. Surveyors walked the entire length of Chesterman Beach including the tombolo to Frank Island. Surveys were done at least twice a week at each site. Most boat surveys began at low tide when the mudflats were exposed and continued on the rising tide. Road accessible sites were usually surveyed during the hour before high tide or at high tide in 2011. Surveys were not conducted in weather that reduced visibility or made boat travel unsafe (heavy rain or high wind). Surveyors counted birds individually when they were within flocks of fewer than 200 birds. They estimated the size of larger flocks by counting 50 or 100 birds and then judged how many similar-sized groups made up the entire flock. Distant flocks were recorded as small or large shorebirds and assumed to have the same species composition as those closer to shore in 1995 or identified to species group and recorded as either “dowitchers” or “peeps” in 2011.
-
Surveyor shorebird bird observations and counts for all years.
-

As part of a scientific assessment of critical habitat for boreal woodland caribou (Environment Canada 2011, see full reference in accompanying documentation), Environment Canada's Landscape Science and Technology Division was tasked with providing detailed anthropogenic disturbance mapping, across known caribou ranges, as of 2010. The attached dataset comprises the second 5-year update (first one in 2015) bringing the data up to 2020. The original disturbance mapping was based on 30-metre resolution Landsat-5 imagery from 2008-2010. Since then, anthropogenic disturbances within 51 caribou ranges across Canada were remapped every five years to create a nationally consistent, reliable and repeatable geospatial dataset that followed a common methodology. The ranges were defined by individual provinces and territories across Canada. The methods developed were focused on mapping disturbances at a specific point of time, and were not designed to identify the age of disturbances, which can be of particular interest for disturbances that can be considered non-permanent, for example cutblocks. The resultant datasets were used for a caribou resource selection function (habitat modeling) and to assess overall disturbance levels on each caribou ranges. As with the 2010 mapping project, anthropogenic disturbance was defined as any human-caused disturbance to the natural landscape that could be visually identified from Landsat 30-metre multi-band imagery at a viewing scale of 1:50,000. The same concept was followed for the 2015 and 2020 disturbance mapping and any additional disturbance features that were observed since the original mapping date, were added. The 2015 database was used as a starting point for the 2020 database. Unlike the previous iteration, features were not removed in the mapping process which was a decision made in the name of time. Interpretation was carried out based on the most recent cloud free imagery available up to mid fall for a given year. Each disturbance feature type was represented in the database by a line or polygon depending on their geometric description. Linear disturbances included: roads, railways, powerlines, seismic exploration lines, pipelines, dams, air strips, as well as unknown features. Polygonal disturbances included: cutblocks, harvest (added in 2020), mines, built-up areas, well sites, agriculture, oil and gas facilities, as well as unknown features. For each type of anthropogenic disturbance, a clear description was established (see Appendix 7.2 of the science assessment) to maintain consistency in identifying the various disturbances in the imagery by the different interpreters. Features were only digitized if they were clearly visible in the Landsat imagery at the prescribed viewing scale. In comparison to the previous mapping protocol, one enhancement to the mapping process in 2020 was the addition of CFS harvest polygons (Ref: NRCan-CFS NTEMS; Wulder 2020) into the database prior to interpretation. This considerably reduced the digitizing time for polygons and accelerated the data collection process. The CFS harvest polygons were checked before inclusion, removing some which had been generated erroneously in their process. A 2nd interpreter quality-control phase was carried out to ensure high quality, complete and consistent data collection. Subsequently, the vector data of individual linear and polygonal disturbances were buffered by a 500-metre radius, representing their extended zone of impact upon boreal caribou herds. Additionally, forest fire polygons for the past forty years (CNFDB 1981-2020) were merged into the buffered anthropogenic footprint in order to create an overall disturbance footprint. These buffered datasets were used in the calculation of range disturbance levels and for integrated risk assessment analysis.
-
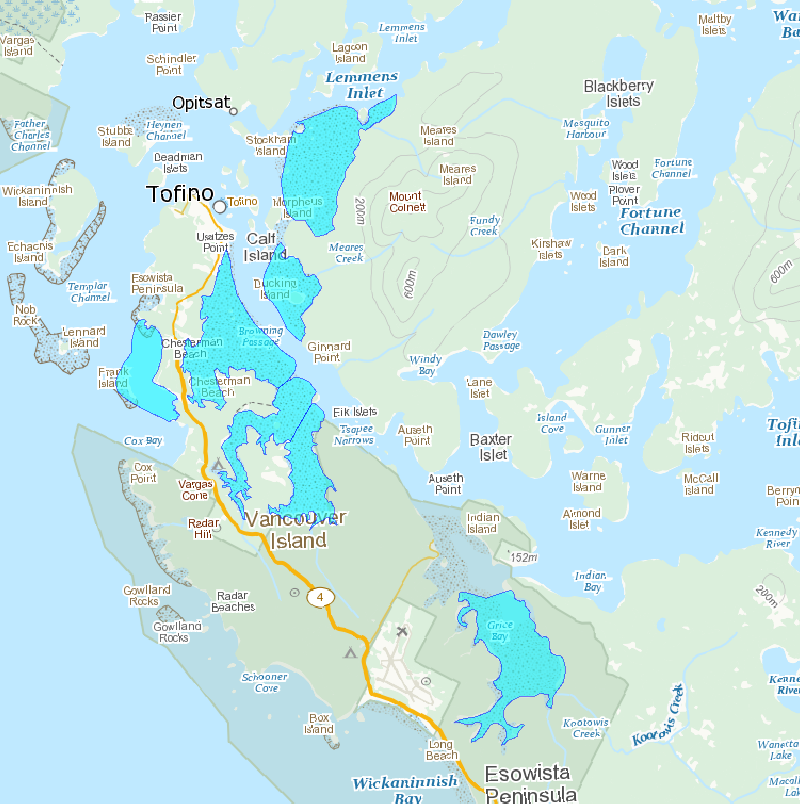
Survey areas is a polygon feature class containing mudflats and staging areas observed for shorebirds.
-

This spatial file includes the polygon boundaries of the four Pacific Great Blue Heron Conservation Regions in British Columbia, as described in the management plan. These Conservation Regions are recognized based on degree of isolation, population sizes, and differences in trends and threats. The management objective for Pacific Great Blue Heron is to ensure that all four Conservation Regions have stable or locally increasing numbers of herons. Refer to the "Management Plan for the Great Blue Heron fannini subspecies (Ardea herodias fannini) in Canada" on the SARA Regristry for more information.
-

Survey transects is a line feature class containing transects completed in 2011.
-
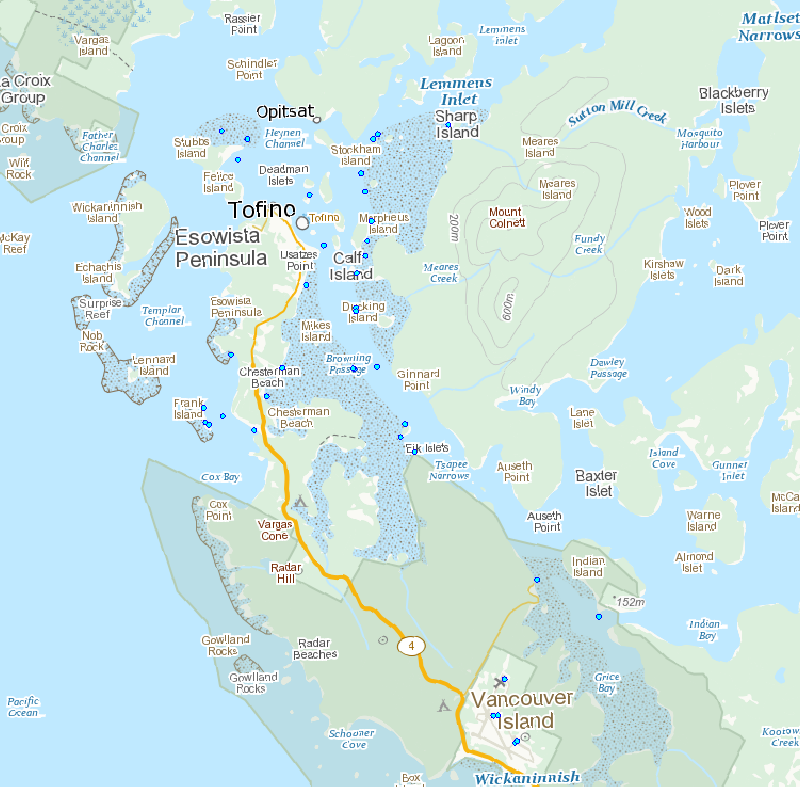
Survey points is a point feature class containing transects and observations completed in 2011.
-

This file includes the spatial boundaries for the Pacific Great Blue Heron Potential Area of Occupancy for its entire Canadian range. The Potential Area of Occupancy is a simple model that highlights the heron's preferred forest habitat at a high level. Potential Area of Occupancy is defined as terrestrial areas within the Coastal Douglas Fir and Coastal Western Hemlock Biogeoclimatic zones that are less than 10 km from a potential foraging area and west of the Cascades mountain range. Potential foraging areas are defined as the entire coastline and major river systems less than 1000 m in elevation. Refer to the "Management Plan for the Great Blue Heron fannini subspecies (Ardea herodias fannini) in Canada" on the SARA Regristry for more information.
-

This dataset displays the geographic areas within which critical habitat (CH) for terrestrial species at risk, listed on Schedule 1 of the federal Species at Risk Act (SARA), occurs in Canada. Note that this includes only terrestrial species and species for which Environment and Climate Change Canada (ECCC) and Parks Canada Agency (PCA) lead. Under SARA, critical habitat is “the habitat that is necessary for the survival or recovery of a listed wildlife species and that is identified as the species’ critical habitat in the recovery strategy or action plan for the species.” To precisely define what constitutes critical habitat for a particular species it is essential that this geospatial information be considered in conjunction with complementary information provided in a species’ recovery document. Recovery documents are available from the Species at Risk (SAR) Public Registry (https://www.canada.ca/en/environment-climate-change/services/species-risk-public-registry.html) for two posting stages (proposed and final posting). The recovery documents contain important information about the interpretation of the geospatial information, especially regarding the biological and environmental features (“biophysical attributes”) that complete the definition of a species’ critical habitat. Within any defined critical habitat geospatial boundary, not all of the area is necessarily critical habitat. It is important to note that recovery planning documents (and, therefore, critical habitat) may be amended from time to time as new information becomes available, which may occur after a document has been posted as proposed or final on the SAR Public Registry. The SAR Public Registry should always be considered as the main source for critical habitat information. In cases where the data are sensitive, the geographic area within which critical habitat occurs may be represented as grids. These are coarse grids (1, 10, 50 or 100 square kilometres) that serve as indicators to locate critical habitat in the recovery planning document. More detailed information on critical habitat may be made available on a need-to-know basis by contacting Environment and Climate Change Canada – Canadian Wildlife Service at ec.planificationduretablissement-recoveryplanning.ec@canada.ca. The data is current as of the date of the most recent revision.
-

This polygon outlines the basic area included in the survey counts. This area is the best approximation of the mudflat that can be surveyed from shore and is exposed at tide tide height of 3.5 m, based on tidal predictions at Point Atkinson, British Columbia.