 Arctic SDI catalogue
Habitats
Type of resources
Available actions
Topics
Keywords
Contact for the resource
Provided by
Formats
Representation types
Update frequencies
status
-
Envision Mapping was sub-contracted by Heriot Watt University for Scottish Natural Heritage (SNH) to undertake broad scale subtidal biotope mapping of Sullom Voe cSAC. Sullom Voe in the Shetland Isles is the most northerly site in the UK to be selected as a representative of large shallow inlets and bays, and within the site series it is the only Scottish example of a ria (known locally as a ?voe?). The boreal-arctic (northern) species-rich communities of Sullom Voe are restricted to Shetland voes and are not represented elsewhere in the SAC series. The purpose was to map the main features and biota using acoustic remote sensing techniques combined with grab and video sampling.
-
PURPOSE: The objective of the program is to gather environmental coastal data to better understand fluctuations in water temperature and its effect on coastal marine species. DESCRIPTION: Bottom and surface water temperatures are monitored in coastal waters of the southern Gulf of St. Lawrence using electronic recording devices attached to navigational buoys or moorings and set to record every two hours. PARAMETERS COLLECTED: Temperature (environmental); point (spatial). NOTES ON QUALITY CONTROL: Data are checked for irregularities. SAMPLING METHODS: Temperature recording devices are installed by fishermen, DFO staff and, since 2000, by the Canadian Coast Guard staff. USE LIMITATION: To ensure scientific integrity and appropriate use of the data, we would encourage you to contact the data custodian.
-

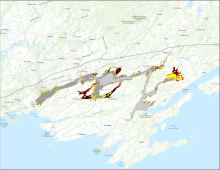
Fish Habitat Assessment Output: 3 of 16 High Water Level (75.4m ASL) - Nursery Habitat - High Vegetation Association Species (All Temperature Windows) Habitat suitability was assessed for the Bay of Quinte Area of Concern, at a 3 m grid resolution, using the Habitat Ecosystem Assessment Tool (HEAT), temperature algorithms, vegetation models, and water level input. Habitat classifications were based on three variables: depth (elevation), vegetation, and substrate; and modified by temperature suitabilities. The final suitability maps were based on documented habitat and temperature associations for the fish in the area. Different life stages (spawning requirements, nursery habitat, adult habitat) were modeled for the years of 1972-2011. Suitability values were scaled from 0 (not suitable) to 1 (highly suitable) and converted to suitability classes of very low, low, medium, and high. The final maps for each guild – life stage combination are maximum suitability values from the 39-year period modelled.
-

Habitat suitability was assessed for the Bay of Quinte Area of Concern, at a 3 m grid resolution, using the Habitat Ecosystem Assessment Tool (HEAT), temperature algorithms, vegetation models, and water level input. Habitat classifications were based on three variables: depth (elevation), vegetation, and substrate; and modified by temperature suitabilities. The final suitability maps were based on documented habitat and temperature associations for the fish in the area. Different life stages (spawning requirements, nursery habitat, adult habitat) were modeled for the years of 1972-2011. Suitability values were scaled from 0 (not suitable) to 1 (highly suitable) and converted to suitability classes of very low, low, medium, and high. The final maps for each guild – life stage combination are maximum suitability values from the 39-year period modelled.
-
Fish Habitat Assessment Output: 7 of 16 High Water Level (75.4m ASL) - Juvenile/Adult Habitat - Low Vegetation Association Species (Coolwater Guild) Habitat suitability was assessed for the Bay of Quinte Area of Concern, at a 3 m grid resolution, using the Habitat Ecosystem Assessment Tool (HEAT), temperature algorithms, vegetation models, and water level input. Habitat classifications were based on three variables: depth (elevation), vegetation, and substrate; and modified by temperature suitabilities. The final suitability maps were based on documented habitat and temperature associations for the fish in the area. Different life stages (spawning requirements, nursery habitat, adult habitat) were modeled for the years of 1972-2011. Suitability values were scaled from 0 (not suitable) to 1 (highly suitable) and converted to suitability classes of very low, low, medium, and high. The final maps for each guild – life stage combination are maximum suitability values from the 39-year period modelled.
-

Fish Habitat Assessment Output: 14 of 16 Average Water Level (75.0m ASL) - Juvenile/Adult Habitat - Low Vegetation Association Species (Warmwater Guild) Habitat suitability was assessed for the Bay of Quinte Area of Concern, at a 3 m grid resolution, using the Habitat Ecosystem Assessment Tool (HEAT), temperature algorithms, vegetation models, and water level input. Habitat classifications were based on three variables: depth (elevation), vegetation, and substrate; and modified by temperature suitabilities. The final suitability maps were based on documented habitat and temperature associations for the fish in the area. Different life stages (spawning requirements, nursery habitat, adult habitat) were modeled for the years of 1972-2011. Suitability values were scaled from 0 (not suitable) to 1 (highly suitable) and converted to suitability classes of very low, low, medium, and high. The final maps for each guild – life stage combination are maximum suitability values from the 39-year period modelled.
-

Fish Habitat Assessment Output: 12 of 16 Average Water Level (75.0m ASL) - Nursery Habitat - Low Vegetation Association Species (All Temperature Windows) Habitat suitability was assessed for the Bay of Quinte Area of Concern, at a 3 m grid resolution, using the Habitat Ecosystem Assessment Tool (HEAT), temperature algorithms, vegetation models, and water level input. Habitat classifications were based on three variables: depth (elevation), vegetation, and substrate; and modified by temperature suitabilities. The final suitability maps were based on documented habitat and temperature associations for the fish in the area. Different life stages (spawning requirements, nursery habitat, adult habitat) were modeled for the years of 1972-2011. Suitability values were scaled from 0 (not suitable) to 1 (highly suitable) and converted to suitability classes of very low, low, medium, and high. The final maps for each guild – life stage combination are maximum suitability values from the 39-year period modelled.
-

Fish Habitat Assessment Output: 13 of 16 Average Water Level (75.0m ASL) - Juvenile/Adult Habitat - High Vegetation Association Species (All Thermal Guilds) Habitat suitability was assessed for the Bay of Quinte Area of Concern, at a 3 m grid resolution, using the Habitat Ecosystem Assessment Tool (HEAT), temperature algorithms, vegetation models, and water level input. Habitat classifications were based on three variables: depth (elevation), vegetation, and substrate; and modified by temperature suitabilities. The final suitability maps were based on documented habitat and temperature associations for the fish in the area. Different life stages (spawning requirements, nursery habitat, adult habitat) were modeled for the years of 1972-2011. Suitability values were scaled from 0 (not suitable) to 1 (highly suitable) and converted to suitability classes of very low, low, medium, and high. The final maps for each guild – life stage combination are maximum suitability values from the 39-year period modelled.
-

Fish Habitat Assessment Output: 11 of 16 Average Water Level (75.0m ASL) - Nursery Habitat - High Vegetation Association Species (All Temperature Windows) Habitat suitability was assessed for the Bay of Quinte Area of Concern, at a 3 m grid resolution, using the Habitat Ecosystem Assessment Tool (HEAT), temperature algorithms, vegetation models, and water level input. Habitat classifications were based on three variables: depth (elevation), vegetation, and substrate; and modified by temperature suitabilities. The final suitability maps were based on documented habitat and temperature associations for the fish in the area. Different life stages (spawning requirements, nursery habitat, adult habitat) were modeled for the years of 1972-2011. Suitability values were scaled from 0 (not suitable) to 1 (highly suitable) and converted to suitability classes of very low, low, medium, and high. The final maps for each guild – life stage combination are maximum suitability values from the 39-year period modelled.
-
This dataset includes water chemistry data collected from five of the six lakes as part of the Northwestern Ontario Size Series project in 1987 and 1990 including species of nitrogen and phosphorus, carbon, chlorophyll a, conductivity, soluble reactive silica, chloride, sulphate, conductivity, sodium, potassium, magnesium, calcium, pH, alkalinity and organic acids