 Arctic SDI catalogue
Samples
Type of resources
Topics
Keywords
Contact for the resource
Provided by
Formats
Representation types
Update frequencies
status
Scale
-

This thematic layer shows the location of water sampling sites authorized in Quebec under section 22 of the Environment Quality Act (chapter Q-2) and their associated volume (liter per day). Water sampling sites are the sites where water enters a facility designed to take water, both underground and surface. The database includes active authorizations to take water since the Water Withdrawal and Protection Regulation (RPEP) came into force on August 14, 2014.**This third party metadata element was translated using an automated translation tool (Amazon Translate).**
-
This theme represents an indicator of the availability of summer and winter surface water. It combines a sub-indicator of the pressure of water samples from surface water, and a sub-indicator of the severity of low water levels. The indicator is calculated based on the current and future climate.**This third party metadata element was translated using an automated translation tool (Amazon Translate).**
-

Fishing event data (e.g. year, date, time, location, catch and effort) and associated biological data from the Offshore Stratified Random Survey component of the annual Sablefish Research and Assessment Survey on the British Columbia coast. Introduction DFO and the Canadian Sablefish Association (CSA) collaborate to undertake an annual fishery-independent research survey under a joint agreement. The survey employs longline trap gear to obtain catch rate data, gather biological samples, capture oceanographic measurements, and collect tag release and recapture data. Data summaries provided here are for the offshore stratified random sampling design (StRS) component of the survey, which has been conducted annually since 2003. The design of the sablefish survey has developed over time by incorporating and discontinuing components, including individual experimental studies (not available on OpenData). This StRS Survey component differs in methodology from the other two survey components: (1) Standardized trap survey – mainland inlets (1994-present; available on OpenData using link below), and (2) Standardized trap survey – offshore indexing and offshore tagging (1990 – 2010; not yet available on OpenData). The Sablefish offshore stratified random trap survey (StRS) follows a depth and area stratified random sampling design. The survey area is partitioned into five spatial strata (S1 to S5) and three depth strata (RD1 to RD3) for a total of 15 strata. The five spatial strata are S1 (South West Coast Vancouver Island or SWCVI), S2 (North West Coast Vancouver Island or NWCVI), S3 (Queen Charlotte Sound or QCS), S4 (South West Coast of Haida Gwaii or SWCHG), and S5 (North West Coast of Haida Gwaii or NWCHG). The three depth strata are 100-250 fathoms (RD1), 250-450 fathoms (RD2), and 450-750 fathoms (RD3). The area within each of the 15 strata are sectioned into 2 km x 2 km grid cells or ‘fishing blocks’ from which set locations are randomly chosen each year. Survey procedures are standardized and documented in Canadian Technical Reports of Fisheries and Aquatic sciences. Data tables provided for the offshore stratified random survey include (i) effort, (ii) catch, (iii) biological information, (iv) the sampling frame from which blocks are selected for sampling each year, and (v) the calculated coastwide Sablefish biomass index. StRS Effort This table contains information about the annual survey trips and fishing events (sets). Trip-level information includes the year the survey took place, a unique trip identifier, the vessel that conducted the survey and the trip start and end dates (the dates the vessel was away from the dock conducting the survey). Set-level information includes the date, time, location and depth that fishing took place, the survey spatial and depth strata for the set, reason for the set, soak time, number of traps deployed and number of traps fished. All successful fishing events are included, i.e., those sets that conformed to specified survey standards. StRS Catch This table contains the catch information from successful fishing events. Catches are identified to species or to the lowest taxonomic level possible. Catches are recorded as fish counts and / or weight. The unique trip identifier and set number are included so that catches can be related to the fishing event information (including capture location). StRS Biological Information This table contains the biological data for sampled catches. Data may include any or all of length, weight, sex, maturity, and age. Most of the sampled catch is Sablefish; however, some biological information has been collected on Rockfish, Flatfish and other Roundfish species in some years. Age structures are collected and are archived until required for analyses; therefore, all existing structures have not been aged at this time. Tissue samples (usually a fin clip) may be collected for genetic (DNA) analysis for specific species. Genetic samples may be archived until required for analyses; for more information, please see the data contacts. The unique trip identifier and set number are included so that samples can be related to the fishing event and catch information. Sample Frame This table contains a list of all of the 2km x 2km grid cells or ‘fishing blocks’ that are part of the stratified random sampling frame. A subset of blocks are randomly selected for sampling each year from this list. For each grid cell, the corresponding depth and spatial strata ID is included. This sample frame can be used to calculate design-based abundance indices for the survey. StRS Biomass Index This table contains a coastwide relative biomass index for Sablefish based on the annual StRS survey. Stratified random sampling mean index values and 95% confidence intervals are calculated by year using the classical survey stratified random sampling estimator (Cochran 1977) and the number of possible sampling units per stratum provided by Wyeth et al. (2007). The relative biomass index has been input to the operating model and management procedure used to provide management advice for BC Sablefish since 2011 (Cox et al. 2011).
-

The purpose of this dataset is to give a an accurate representation of the game hunting boundaries in Manitoba. Please refer to the Manitoba Game Hunting Areas dataset . Game Hunting Areas (GHAs) are defined under the Hunting Areas and Zones Regulation (220/86) of The Wildlife Act (CCSM c. W130). Game Hunting Areas are used to support boundaries for species specific hunting seasons, harvest allocations, bag limits and associated regulations. Refer to the Hunting Areas and Zones Regulation for GHA boundary descriptions.Fields Included (Alias (Field Name): Field description) OBJECTID (OBJECTID): s equential unique whole numbers that are automatically generated GHA (GHA): the n umber assigned to each Game Hunting Area Shape_Length (Shape_Length): the l ength of the feature in internal units Shape_Area (Shape_Area): a rea of the feature in internal units squared
-

This entry provides access to surficial geology maps that have been published by the Geological survey of Canada. Two series of maps are available: "A Series" maps, published from 1909 to 2010 and "Canadian Geoscience Maps", published since 2010. Three types of CGM-series maps are available: 1)Surficial Geology: based on expert-knowledge full air photo interpretation (may include interpretive satellite imagery, Digital Elevation Models (DEM)), incorporating field data and ground truthing resulting from extensive, systematic fieldwork across the entire map area. Air photo interpretation includes map unit/deposit genesis, texture, thickness, structure, morphology, depositional or erosional environment, ice flow or meltwater direction, age/cross-cutting relationships, landscape evolution and associated geological features, complemented by additional overlay modifiers, points and linear features, selected from over 275 different geological elements in the Surficial Data Model. Wherever possible, legacy data is also added to the map. 2)Reconnaissance Surficial Geology: based on expert-knowledge full air photo interpretation (may include interpretive satellite imagery, DEMs), with limited or no fieldwork. Air photo interpretation includes map unit/deposit genesis, texture, thickness, structure, morphology, depositional or erosional environment, ice flow or meltwater direction, age/cross-cutting relationships, landscape evolution and associated geological features, complemented by additional overlay modifiers, points and linear features, selected from over 275 different geological elements in the Surficial Data Model. Wherever possible, legacy data is also added to the map. 3)Predictive Surficial Geology: derived from one or more methods of remote predictive mapping (RPM) using different satellite imagery, spectral characteristics of vegetation and surface moisture, machine processing, algorithms etc., DEMs, where raster data are converted to vector, with some expert-knowledge air photo interpretation (training areas or post-verification areas), varying degrees of non-systematic fieldwork, and the addition of any legacy data available. Each map is based on a version of the Geological Survey of Canada's Surficial Data Model (https://doi.org/10.4095/315021), thus providing an easily accessible national surficial geological framework and context in a standardized format to all users. "A series" maps were introduced in 1909 and replaced by CGM maps in 2010. The symbols and vocabulary used on those maps was not as standardized as they are in the CGM maps. Some "A series" maps were converted into, or redone, as CGM maps, Both versions are available whenever that is the case. In addition to CGM and "A series" maps, some surficial geology maps are published in the Open File series. Those maps are not displayed in this entry, but can be found and accessed using the NRCan publications website, GEOSCAN:(https://geoscan.nrcan.gc.ca).
-

The map identifies surficial materials and associated landforms left by the retreat of the last glaciers and non glacial environments. The surficial geology is based on compilation of existing maps. This work provides new geological knowledge and improves our understanding ofthe distribution, nature and glacial history of surficial materials. It contributes to resource assessments and effective land use management. This new surficial geology map product represents the conversion of the map "Surficial Materials of Canada" (Fulton, 1995) and its legend, using the Geological Survey of Canada's Surficial Data Model (SDM version 2.0) which can be found in Open File 7631 (Deblonde et al.,2014). All geoscience knowledge and information from map 1880A that conformed to the current SDM were maintained during the conversion process. However, only terrestrial units are depicted on this map. Map units below modern sea level or major lake levels are not shown but are maintained in the digital data of this publication. Where additional information was required in certain regions of the Arctic and Cordillera, legacy geology map data were used. These maps are listed in the digital "Map Information" document. All other source maps used in map 1880A are not relisted here. The purpose of converting legacy map data to a common science language and common legend is to enable and facilitate the efficient digital compilation, interpretation, management and dissemination of geologic map information in a structured and consistent manner. This provides an effective knowledge management tool designed around a geo-database which can expand following the type of information to appear on new surficial geology maps.
-

This dataset compiles information and photographs collected at 49 observation stations during a field campaign conducted from July 31 to August 11, 2025, in the central part of the Kivalliq region. It includes the locations of sites where ice-flow indicators were measured, along with their relative chronology where it could be determined in the field. It also includes the locations of till sampling sites collected for geochemical and indicator mineral analyses, as well as sites where boulders and bedrock surfaces were sampled for terrestrial cosmogenic isotope dating. Analytical results and interpretations will be presented in subsequent publications.
-

Past wind directions are mapped from stabilized sand dunes in Canada and the northern United States. The map shows the near-surface wind directions responsible for transporting sand when the dunes were active. The directions were mapped by interpreting the orientation of parabolic dunes from open-sourced Lidar (light detection and ranging) derived digital terrain models. The map also shows new dune areas that add to the existing knowledge of dune fields in North America. The interpreted wind directions provide insight into the past atmospheric circulation patterns that occurred during the deglaciation of North America and the transition to modern circulation patterns that occur today.
-
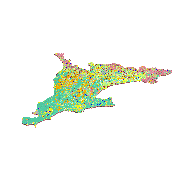
To support improved groundwater geoscience knowledge for southern Ontario, a regional 3-D model of the surficial geology of southern Ontario has been developed as a part of a collaboration between the Ontario Geological Survey and the Geological Survey of Canada. Covering approximately 66,870 km2 in area, the model is a synthesis of existing geological models, surficial geology mapping, and subsurface data. The model is a simplified 9-layer reclassification of numerous mapped local surficial sediment formations in places over 200 m thick with a total volume of approximately 2,455 km3. The model integrates 1:50,000 scale surficial geology mapping with 90 m bathymetrically corrected topographic digital elevation model (DEM) and 8 existing local 3-D models. Archival subsurface data include 10,237 geotechnical and stratigraphic boreholes, 3,312 picks from geophysical surveys, 15,902 field mapping sites and sections, 537 monitoring and water supply wells and 282,995 water well records. Roughly corresponding to regional aquifer and aquitard layers, primary model layers are (from oldest to youngest): Bedrock, Basal Aquifer, Lower Sediment, Regional Till, Post Regional Till Channel Fill, Glaciofluvial Sediment, Post Regional Till Mud, Glaciolacustrine Sand and Recent Sediment / Organics. Modelling was completed using an implicit modelling application (LeapFrog®) complemented by an expert knowledge approach to data classification and rules-based Expert System procedure for data interpretation and validation. An iterative cycle of automated data coding, intermediate model construction and manual data corrections, expert evaluations, and revisions lead to the final 3-D model. A semi-quantitative confidence assessment has been made for each model layer surface based on data quality, distribution and density. This surficial geology model completes the development of a series of regional 3-D geological and hydrogeological models for southern Ontario.