 Arctic SDI catalogue
Strait of Belle Isle
Type of resources
Topics
Keywords
Contact for the resource
Provided by
Formats
Representation types
Update frequencies
status
-

The Strait of Belle Isle connects the Labrador Shelf and Gulf of St. Lawrence. Few observations of currents in the Strait of Belle Isle exist despite its important contribution to the heat, salt, and mass budgets of the Gulf of St. Lawrence. This is because the deployment of instruments is complicated by the Strait’s remote location, its strong currents, and the presence of thick winter sea ice and icebergs. The present data set aims to provide a long-term time series of currents in the Strait of Belle Isle. Data were collected using a moored Teledyne RDI Workhorse 300 KHz acoustic Doppler current profiler (ADCP). The ADCP was mounted on a subsurface buoy anchored 5 m from the sea floor, in water approximately 70 m deep near the north shore of the Strait (56° 37.2 W, 51° 34.7 N). This instrument provides three-dimensional current profiles every 30 minutes at a vertical resolution of 4 m. Backscatter intensity is also collected at the same resolution. Raw data were processed using the Magtogoek software (https://github.com/iml-gddaiss/magtogoek), developed by the Department of Fisheries and Oceans Canada. Quality flags have been assigned to the data based on beam sidelobe contamination and required thresholds for extreme velocities, beam correlation and percentage of good four-beam transformations. The ancillary data used to apply this quality control are included in the data set. Reference : Shaw, J.-L., & Galbraith, P. S. (2023). Climatology of transport in the Strait of Belle Isle. Journal of Geophysical Research: Oceans, 128, e2022JC019084. https://doi.org/10.1029/2022JC019084
-

Spatial distribution of lumpfish catch rates (number per tow) during the August DFO research survey conducted annually since 1990, to assess the state of groundfish and shrimp stocks in the northern Gulf of St. Lawrence. The area sampled by a tow is the product of the distance trawled (fishing time multiplied by vessel speed) and the wing spread (13.41 m for the Alfred Needler and 16.94 m for the Teleost). Given that this area may vary among tows, the sampling unit is standardized and defined as being a station sampled by a tow over a distance of 0.75 nautical miles (1,389 m) with a horizontal wing spread of 16.94 m. Catch variables were calculated based on the standard area, 0.02353 km². After each tow, the catch was sorted by taxa, and the number of individuals and total biomass of these taxa were noted. For taxa identified to the species level, individual biometric parameters (e.g., length, weight) and biological parameters (e.g., sex, maturity of gonads) were recorded based on a subsample. Full methods are described in Bourdages et al. (2010). Note that the increase in catch rate for the 2005-2009 period coincides with a change in gear for this survey. Bourdages, H., and Ouellet, J.-F. 2011. Geographic distribution and abundance indices of marine fish in the northern Gulf of St. Lawrence (1990–2009). Can. Tech. Rep. Fish. Aquat. Sci. 2963: vi + 171 p. Source: Gauthier, J., Grégoire, F., and Nozères, C. 2017. Assessment of Lumpfish (Cyclopterus lumpus) in the Gulf of St. Lawrence (3Pn, 4RS) in 2015. DFO Can. Sci. Advis. Sec. Res. Doc. 2017/051. v + 47 p. Purpose The multidisciplinary survey of groundfish and shrimp in the northern Gulf of St. Lawrence has been conducted every August by Fisheries and Oceans Canada for more than two decades. Initially, its objective was to determine the abundance and geographic distribution of commercially important taxa. However, for couple of years, the objective was expanded to include all taxa caught with the shift toward the ecosystem approach.
-

This layer represents important areas for the Harp seal (Pagophilus groenlandicus). It includes the three main pupping areas for this species and migratory pathways used by Harp seals to migrate between its summering (Baffin Bay) and wintering (Gulf of St. Lawrence and Newfoundland and Labrador coasts) areas. Note that this dataset do not represent the Harp seal distribution. Reference: DFO. 2020. 2019 Status of Northwest Atlantic Harp Seals, Pagophilus groenlandicus. DFO Can. Sci. Advis. Sec. Sci. Advis. Rep. 2020/020.
-
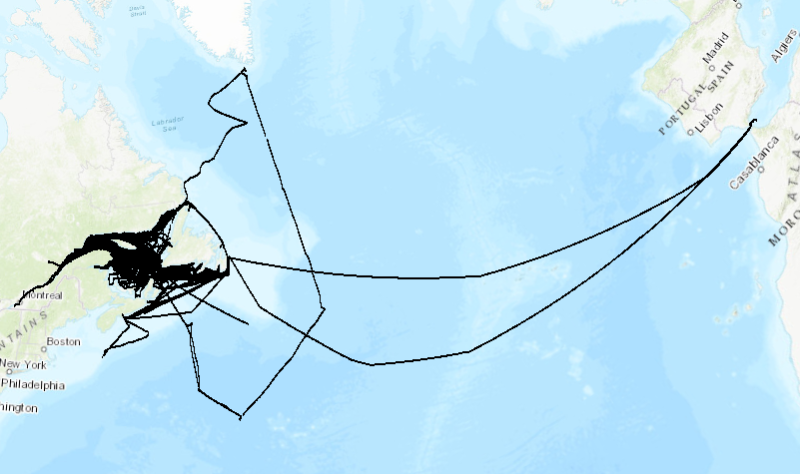
1999 to 2023 surface temperature and salinity measured along the track of commercial ships, mostly between Montreal (Quebec) and St. John's (Newfoundland). Monitoring of surface water conditions in the Estuary and Gulf of St. Lawrence is carried out with different complementary methods such as thermosalinographs (TSG) installed on commercial ships. These ships are sailing all year long from Montreal to St. John’s, one round trip per week, and are sampling water near the surface (3 to 8 meters deep) to determine the temperature and salinity all along the route. Purpose The recorded data are used as input to numerical forecasting models for sea ice conditions and as a monitoring tool for the Gulf of St. Lawrence. Annual reports are available at the Canadian Science Advisory Secretariat (CSAS), (http://www.dfo-mpo.gc.ca/csas-sccs/index-eng.htm). Galbraith, P.S., Chassé, J., Caverhill, C., Nicot, P., Gilbert, D., Lefaivre, D. and Lafleur, C. 2018. Physical Oceanographic Conditions in the Gulf of St. Lawrence during 2017. DFO Can. Sci. Advis. Sec. Res. Doc. 2018/050. v + 79 p.
-

General distribution of Humpback Whales in the Estuary and Gulf of St. Lawrence based on all identified whales from the entire MICS database (Mingan Island Cetacean Study). Additional information The MICS (Mingan Island Cetacean Study) has been collecting and compiling in a photo-identification catalogue, blue whale (and other type of whales) sightings for the western North Atlantic since 1979. Since 1987, the material and sampling protocol has been being relatively stable, neither random nor systematic. Field work is conducted abord inflatable boats. Because the whole Gulf ot St. Lawrence cannot be thoroughly studied, MCIS conducts surveys in known whale aggregation areas. The spatial effort is also weather dependent and is mainly constrained by wind direction and strength. Therefore, the study area is not homogeneously covered. Each whale observation is associated with a picture that allows individual identification based on the animal's pigmentation pattern. For more details consult the mentionned report: Gagné, J.A., Ouellet, P., Savenkoff, C., Galbraith, P.S., Bui, A.O.V. et Bourassa, M.-N. Éd. 2013. Rapport intégré de l’initiative de recherche écosystémique (IRÉ) de la région du Québec pour le projet : les espèces fourragères responsables de la présence des rorquals dans l’estuaire maritime du Saint-Laurent. Secr. can. de consult. sci. du MPO. Doc. de rech. 2013/086. vi + 181 p.
-

This layer represents the Harp seal (Pagophilus groenlandicus) distribution. During the summer, the Harp seal is in Arctic and it migrates south of its distribution range during the fall. It migrates back to the Arctic after the moulting period which occurs in April and May. Reference: DFO. 2020. 2019 Status of Northwest Atlantic Harp Seals, Pagophilus groenlandicus. DFO Can. Sci. Advis. Sec. Sci. Advis. Rep. 2020/020.
-

Description of the submarine morphology and characteristics of the sediments (lithology, grain size, mineralogy, and chemistry) of the Saguenay fjord, the lower Estuary and Gulf of St. Lawrence. The layer contains a synthesis of geological and geochemical data collected and interpreted over 10 years and is accompanied by detailed bathymetric and surface sediment maps. Most of this study deals with the geomorphology, surface sediments (lithology, mineralogy, and chemistry), and present depositional conditions, but several studies have also been made of the bedrock geology and the stratigraphy of the unconsolidated sediments. Purpose These studies are regional and of a reconnaissance nature in the sense that they have been designed to obtain acoustical and sampling data on the morphology and basic properties of the sediments from the whole Gulf. This approach was used to provide a broad appraisal of the sedimentary environment of the Gulf and its late-glacial and postglacial history. Additional Information Unknown date of numeric version. Acoustical and sampling data were obtained in the River and Gulf of St. Lawrence on board of different boats over the years. Sounding lines and sample stations were selected initially on the basis of submarine morphology and later in combination with a preliminary sedimentological map as the sea floor data accumulated. More specifically, acoustical data on the topography and nature of the sea floor was obtained from echosounding and continuous seismic profiling. Sounding records were studied, interpreted, and reduced manually in most cases to a scale suitable for plotting and presentation. The information on the continuous seismic records was first interpreted visually and the reduced to constant scale with the aid of a pantograph with independently vertical and horizontal scales. Also, about 1500 sediments samples have been collected from various parts of the Gulf to obtain a regional coverage of the sedimentary environment in the area. The sediment sample were sorted and split after their water content had been determined. Mineralogical analyses were carried out after separation into a heavy and light fraction. The light minerals were identified by a combined method of staining and the use of immersion liquids. For more details on consulted documents and their limit, see the following report: Loring, D. H., and D. J. G. Nota. 1973. Morphology and sediments of the Gulf of St. Lawrence. Bull. Fish. Res. Bd. Can. 182. 147 p. + 7 charts.
-

A geospatial database involving 130 descriptors was created describing the pelagic and benthic habitats of the 0–30 m surface layer in the estuary and Gulf of St. Lawrence. A grid made of 6.25 km² cells (2.5 x 2.5 km) was used to aggregate the data. Each of the 39,337 cells overlapping the marine environment was characterized using landscape, hydrographic, and oceanographic parameters determined from observations (including satellite imagery), a 3D circulation model, and published and unpublished material available at local and regional scales. Purpose The dataset provides useful information on the spatial extent of major coastal epipelagic habitats in the study area and can be used for mapping purposes and for analyses of species-habitat relationships. Additional Information The low tide limit was taken as the upper (0 m) boundary, but neighbouring landscape features, such as the proximity to freshwater inflows, surface area of the tidal zone, and characteristics of the shoreline, were also taken into consideration. Also, each cell was classified as being marine, intertidal, or terrestrial using the high and low tide marks. Those marks were determined using NRCan CANVEC topographic map products (1:50,000). The high tide mark was determined as the limit between the land and water layers. The low tide mark (0 m depth) was determined as the lower limit of the tidal zone in areas with a tidal zone, and as the limit between the land and water layers elsewhere. See the report mentioned below for a more detailed description of the treatments for each variable: Dutil, J.-D., S. Proulx, P. Galbraith, J. Chassé and N. Lambert 2012. Coastal and epipelagic habitats of the St. Lawrence estuary and Gulf. Can. Tech. Rep. Fish. Aquat. Sci. 3009 : ix +87 pp.
-

Available information for the Estuary and Gulf of St. Lawrence on salinity, temperature, dissolved oxygen, depth, slope, and variability in landscape and sediments, were aggregated using a grid made up of 100 km2 cells as a basis for mapping and describing marine habitats for conservation and integrated management purposes. For example, 26 variables were selected to describe depth, slope, salinity and temperature. Based on that information, cluster analyses were conducted grouping cells into 13 different megahabitats. Four megahabitats described the deep waters, and areas outside channels formed 9 megahabitats: four in the southern Gulf and five in the northern Gulf. Purpose The tool proposes a novel way of making validated and integrated data available to end users. Potential applications include the screening of areas considered for inclusion in a network of protected areas and a quantitative assessment of surface areas for each class of habitat. The method can also be applied to describe the habitats of species at risk. Additional Information See the report mentioned below for a more detailed description of the treatments for each variable: Dutil, J.-D., Proulx, S., Chouinard, P.-M., and Borcard. D. 2011. A hierarchical classification of the seabed based on physiographic and oceanographic features in the St. Lawrence. Can. Tech. Rep. Fish. Aquat. Sci. 2916: vii + 72 p.