 Arctic SDI catalogue
Substrate
Type of resources
Available actions
Topics
Keywords
Contact for the resource
Provided by
Years
Formats
Representation types
Update frequencies
status
Service types
-

This deep water substrate bottom type model was created to aid in habitat modeling, and to complement the nearshore bottom patches. It was created from a combination of bathymetrically-derived layers in addition to bottom type observations. Using random forest classification, the relationship between observed substrates and bathymetric derivatives was estimated across the entire area of interest. The raster is categorized into: 1) Rock, 2) Mixed, 3) Sand, 4) Mud
-

The shallow, coastal regions of the world’s oceans are highly productive ecosystems providing important habitat for commercial, forage, endangered, and iconic species. Given the diversity of ecosystem services produced or supported by this ecosystem, a better understanding of its structure and function is central to developing an ecosystem-based approach to management. However this region termed the ‘white strip’ by marine geologists because of the general lack of high-resolution bathymetric data - is dynamic, highly variable, and difficult to access making data collection challenging and expensive. Since substrate is a key indicator of habitat in this important ecosystem, we created a continuous substrate map of Bottom Patches (BoPs) from the best available bottom type data using an approach that is simple, quantitative, and transparent making it amenable to iterative improvement as data quality and availability improve. To provide subsequent analyses (such as habitat models) with some confidence in the defined bottom type values, we developed a corresponding confidence surface based on the agreement of, and distance between observations. Such data are critical to assessments of species distributions and anthropogenic risk. Bottom patches (BoPs) have been created to represent bottom type for the entire Pacific Canadian coast from the high high water line to a depth of 50 metres (m). As a polygon representation, the BoPs describe patches of similar substrate prescribed by depth classes and the available field observations. In the areas where no observations are available, predicted bottom type values are used. The approach is described in Gregr et al. (2013), as a spatial framework for representing nearshore ecosystems. Accuracy of the bottom type depends on a multitude of factors but primarily the reliability and density of the bottom type observations. The horizontal accuracy of these data likely ranges from metres to 10s of metres because of the source data or data processing required. Areas with a higher data density, where the data show strong coherence, are understood to have higher accuracy. The BoPs use depth ribbons (polygons describing bathymetric ecozones) as an input. Depth ribbons for Pacific Canada were created from a high resolution (20 x 20 m2) bathymetry. Given the resolution of these data, processing was facilitated by dividing the Pacific Coast into 5 regions. The West Coast of Vancouver Island, extending from Cape Sutil in the North past Port San Juan to the South, includes a total of 110,313 BoP polygons. Bottom Patches for Queen Charlotte Strait and Strait of Georgia regions were combined for a total of 235,754 BoP polygons. The North Central Coast region, extending from the Alaskan border in the North to Cape Caution in the South, includes a total of 431,639 BoP polygons. The Haida Gwaii region includes a total of 86,825 BoP polygons. These data are intended for scientific research only. The developers (Fisheries and Oceans Canada, SciTech Environmental Consulting) are not responsible for damages resulting from any omissions or errors that may be contained in this dataset and expressly disclaims any warranty of fitness for any particular purpose. Developers shall not be liable for any losses, financial or otherwise, due to the use of these data. The user assumes the entire risk as to the suitability, results and performance of the dataset for their proposed use. Please credit SciTech and Fisheries and Oceans Canada as the source of the data in any maps, reports, or articles that are printed or published on paper or the Internet.
-
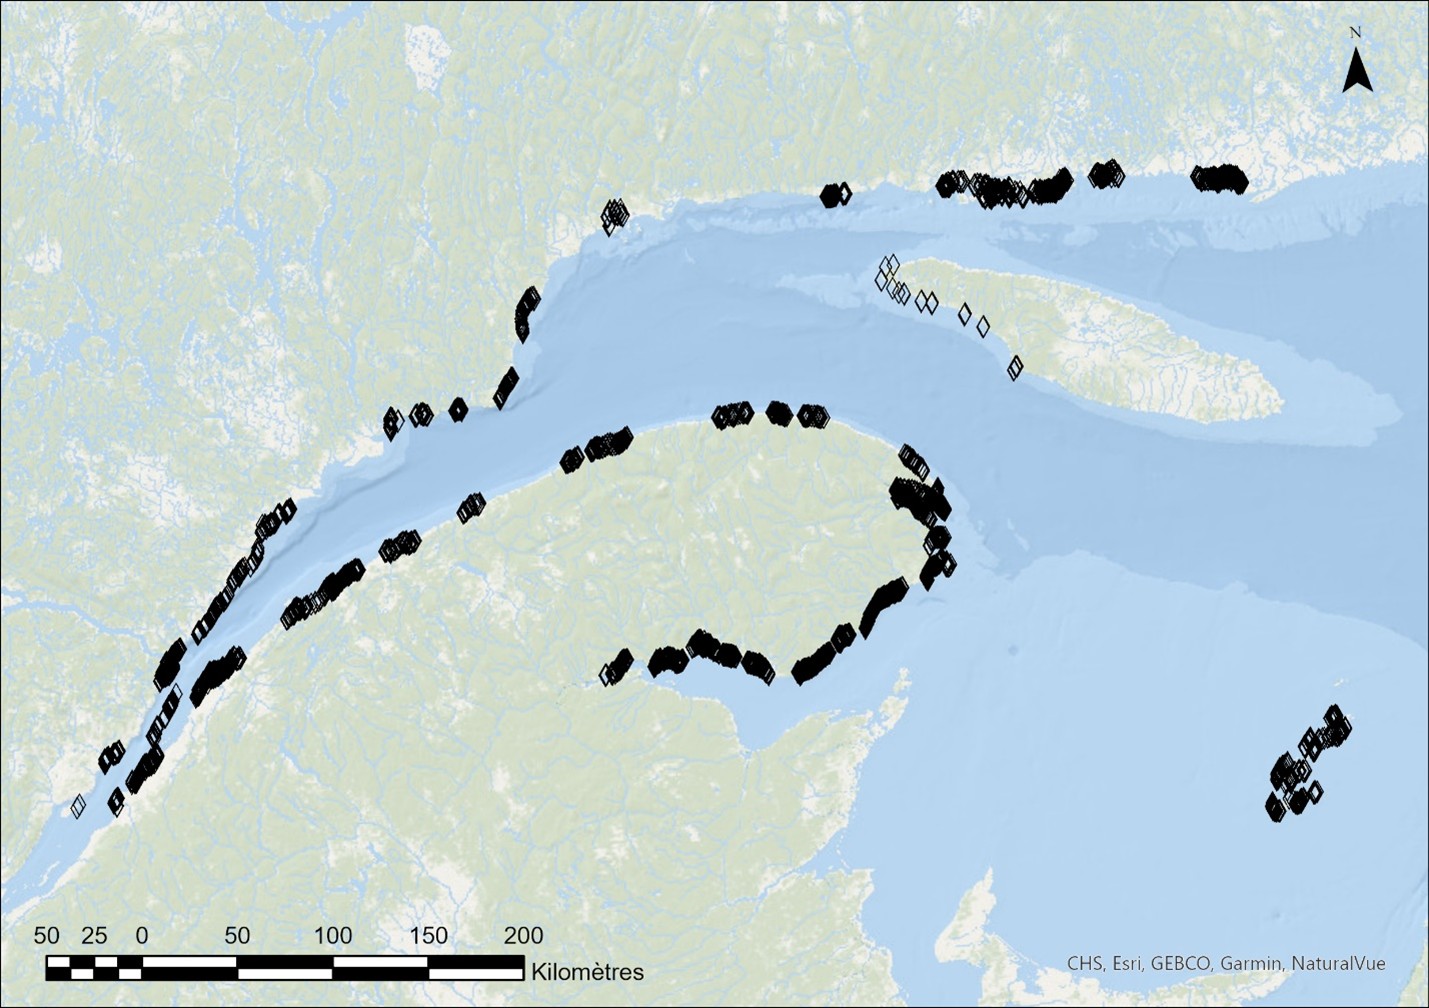
Between 2017 and 2024, underwater imaging sampling campaigns were conducted by Fisheries and Oceans Canada across a broad area of the shallow coastal zone of the St. Lawrence Estuary and Gulf. The sampling targeted the lower intertidal and subtidal zones, to a maximum depth of approximately 10 m, with an emphasis on eelgrass beds and macroalgae. These targeted surveys were primarily intended to produce ground-truth data for the mapping of estuarine and marine macrophytes of the Québec maritime region (Provencher-Nolet et al., 2025), supporting oil spill preparedness and response activities. This dataset summarizes information generated from the analysis of underwater video footage collected at 3,179 sampling stations using small boats equipped with a pole-mounted camera system, as described in Grégoire et al. (2025). The dataset documents multiple characteristics of coastal ecosystems, including the cover of erect vegetation, vegetation assemblages, dominant and minor vegetation, substrates, fauna, as well as the presence of encrusting algae, for each sampling station. The different attributes recorded during video analysis, along with certain identification criteria, are presented in the visual dictionary of Grégoire et al. (2022).
-
Sea-bed substrate map, sediment accumulation rate map and case studies of the EMODnet-Geology study area. The sea-bed substrate map of the Baltic Sea, the Greater North Sea and the Celtic Seas is presented at 1: 1 000 000 scale. The sea-bed substrate map is collated from more than 200 separate sea-bed substrate maps. The sediment accumulation rate map of the Baltic Sea and parts of the Greater North Sea shows point-source data from more than 600 sea-bed sediment sampling sites. Six case studies emphasize the importance of marine geological information, local features and detailed surveys in marine spatial planning and use of marine resources. The maps and case studies are collated and compiled within the EMODNET-Geology project.