 Arctic SDI catalogue
earth sciences
Type of resources
Available actions
Topics
Keywords
Contact for the resource
Provided by
Years
Formats
Representation types
Update frequencies
status
Service types
Scale
Resolution
-

The distribution of Base - Small Scale Topographic data to the public is provided by AltaLIS Ltd., distributing agent for the Alberta Data Partnerships Ltd. (ADP), formerly Spatial Data Warehouse Ltd. (SDW), on behalf of the Government of Alberta. The Base - Small Scale Topographic data includes a vector mapping database created by Alberta Environment and Parks and includes the following: 1:250 000 Base, 1:1 000 000 Base and 1:2 000 000 Base.
-
The distribution of Property - Municipal Boundaries data to the public is provided by AltaLIS Ltd., distributing agent for the Alberta Data Partnerships Ltd. (ADP), formerly Spatial Data Warehouse Ltd. (SDW), on behalf of the Government of Alberta. The Property - Municipal Boundaries data includes a GIS-ready mapping database created by Alberta Environment and Parks and includes the following: Counties, MD’s, Special Areas, Improvement Districts, Cities, Towns, Villages, Summer Villages and Hamlets. This product is available from AltaLIS Ltd. under the Province of Alberta’s ‘Open Government Licence’.
-
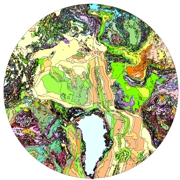
As part of the International Polar Year (IPY) 2007'08 and 2008'09 activities, and related objectives of the Commission for the Geological Map of the World (CGMW), nations of the circumpolar Arctic have co-operated to produce a new bedrock geology map and related digital map database at a scale of 1:5 000 000. The map, released in north polar stereographic projection using the World Geodetic System (WGS) 84 datum, includes complete geological and physiographic coverage of all onshore and offshore bedrock areas north of latitude 60° north.
-
GEO - Geological and geophysical (geoscientificInformation)The earth sciences. For example, resources describing geophysical features and processes; minerals; the composition, structure, and origin of the earths rocks; earthquakes; volcanic activity; landslides; gravity information; soils; permafrost; hydrogeology; and erosion
-
The digital Polling Division boundary files provided are made available from Elections Canada. The data contains the digital federal electoral districts under the Representation Order of 2015.
-

The Geological Survey of Canada (Atlantic and Pacific) has collected marine survey field records on marine expeditions for over 50 years. This release makes available the results of an ongoing effort to scan and convert our inventory of analog marine survey field records (seismic, sidescan and sounder) to digital format. These records were scanned at 300 dpi and converted into JPEG2000 format. Typically, each of these files was between 1 to 2 gbyte in size before compression and compressed by a factor of 10:1. Empirical tests with a number of data sets suggest that there is minimal visual distortion of the scanned data at this level of compression. In this KML file, scanned data are available in a reduced-scale thumbnail format and a compressed full-resolution JPEG2000 format.
-

Prospectivity model highlights areas of Canada with the greatest potential for magmatic nickel deposits. The preferred prospectivity model is based on public geological, geochemical, and geophysical datasets that were spatially indexed using the H3 discrete global grid system. Each H3 cell is associated with a prospectivity value, or class probability, calculated from the best-performing gradient boosting machines model. Model results are filtered to include the top 20% of prospectivity values for visualization purposes.
-

Prospectivity model highlights areas of Canada with the greatest potential for Mississippi Valley-type zinc deposits. The preferred prospectivity model is based on public geological, geochemical, and geophysical datasets that were spatially indexed using the H3 discrete global grid system. Each H3 cell is associated with a prospectivity value, or class probability, calculated from the best-performing gradient boosting machines model. Model results are filtered to include the top 20% of prospectivity values for visualization purposes.
-

Prospectivity model highlights areas of Canada with the greatest potential for clastic-dominated zinc deposits. The preferred prospectivity model is based on public geological, geochemical, and geophysical datasets that were spatially indexed using the H3 discrete global grid system. Each H3 cell is associated with a prospectivity value, or class probability, calculated from the best-performing gradient boosting machines model. Model results are filtered to include the top 20% of prospectivity values for visualization purposes.
-
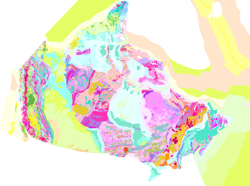
The map displays bedrock formations at or near the surface of the land, on the sea floor above the continental crust that forms the Canadian landmass, and oceanic crust surrounding the landmass. The bedrock units are grouped and coloured according to geological age and composition. The colours of offshore units and oceanic crust are paler and more generalized than those on land, although the constituent units offshore are still easily discernible from their dashed boundaries. This colour design, coupled with the use of a white buffer zone at the coast allows the coastline of Canada to be readily distinguished and still show the grand geological architecture of the Canadian landmass. The map also shows major faults that have disrupted the Earth's crust, onshore and offshore, and a variety of special geological features such as kimberlite pipes, which locally contain diamonds, impact structures suspected to have been caused by meteorites, and extinct and active spreading centres in the surrounding oceans.