 Arctic SDI catalogue
observation
Type of resources
Available actions
Topics
Keywords
Contact for the resource
Provided by
Years
Formats
Representation types
Update frequencies
status
Service types
-
Carte de tous les puits et stations de surveillance d'eau souterraine enregistrés dans RIES (Réseau d'information sur les eaux souterraines) et certaines couches de référence relatives au programme des géoscience sur eaux souterraines de Ressources naturelles Canada. Les données proviennent de plusieurs bases de données distribuées et sont converties dynamiquement vers un point de service unique. Certaines couches qui comportent un grand nombre d'entités sont affichées sous forme généralisées à l'échelle nationale, pour afficher les entités distinctes seulement à l'échelle locale.
-
[ARCHIVED] Recommendation is to discontinue the “Nova Scotia Groundwater Observation Well Temperature Data”. This is for scientific / technical reasons. The data was never designed to be collected as a dataset on its own, but is used by sensors to create a correction facter for other data (groundwater levels). Developments in academic research show that the type of water wells we monitor for groundwater levels do not have the correct design for measuring temperature, with issues that include the potential within wells for thermal convection cells that cause groundwater temperature readings to fluctuate inconsistently. Groundwater temperatures have been recorded from the NS Groundwater Observation Well monitoring network since 2003. This temperature data is presented as daily averages and may be influenced by a number of variable factors including air temperature, well construction, depth, geology and groundwater conditions.
-

The data in this dataset represent an amalgamation of sea turtle sighting, stranding, and entrapment events, mainly near Newfoundland and Labrador (NL), Canada. This document summarises the detection events data for Leatherback (Dermochelys coriacea), Loggerhead (Caretta caretta), and Green (Chelonia mydas) Turtles that has been collected from opportunistic and systematic survey sources, plus stranding and entrapment records, in the waters of NL from 1946 to 2023. To a much lesser extent there are also detection records for the southern Gulf of St. Lawrence. Scotian Shelf, and northeastern U.S. waters. These detection records are mostly derived from opportunistic reports, so there are rarely data for a report that includes measures of the observer effort expended to make the detection, and rarely associated imagery. During DFO aerial surveys there are measures of effort in most cases, enabling the turtle sightings reports to be used in habitat modelling (e.g., Mosnier et al. 2018). Most of the information variables (such as “Date”, “Latitude”, “Longitude”, “Number of Animals”) have been obtained from the detection report. In some cases data for variables such as “Location Reliability”, “ID Reliability”, “Platform”, and “Strand or Entrapment Outcome” were derived from interpretation of the comments associated with the report, if available. For description of the variables in the dataset see the Data Dictionary. References: Mosnier, A., Gosselin, J.-F., Lawson, J., Plourde, S., and Lesage, V. 2018. Predicting seasonal occurrence of leatherback turtles (Dermochelys coriacea) in eastern Canadian waters from turtle and sunfish (Mola mola) sighting data and habitat characteristics. Can. J. Zool. 97: 464-478. https://doi.org/10.1139/cjz-2018-0167
-

The United States population of California Sea Lions (Zalophus californianus) range from southeast Alaska to the Pacific coast of central Mexico. While this population does not breed in Canada, some sub-adult and adult males migrate northwards to British Columbia (BC) during the non-breeding season with an arrival in August–October and a departure in April–May. The population in coastal BC was assessed in 1985 and again in 2023 from dedicated over-winter aerial surveys. The most recent assessment used counts from 2020–2021surveys that were restricted to southern BC as few animals have been documented further north. Additional observations of California Sea Lions were collected while surveying sites for Steller Sea Lions. These opportunistic counts increased from approximately 1,000 animals in the mid-2000s to several thousand individuals in more recent years. Historically occupied sea lion rookeries and haul-out sites were surveyed with nearby areas monitored for potential shifts in distribution. This dataset contains counts that have been collected from sightings of individuals from 1971 through 2021and replaces a previous dataset limited to the 2016/2017 survey season.
-
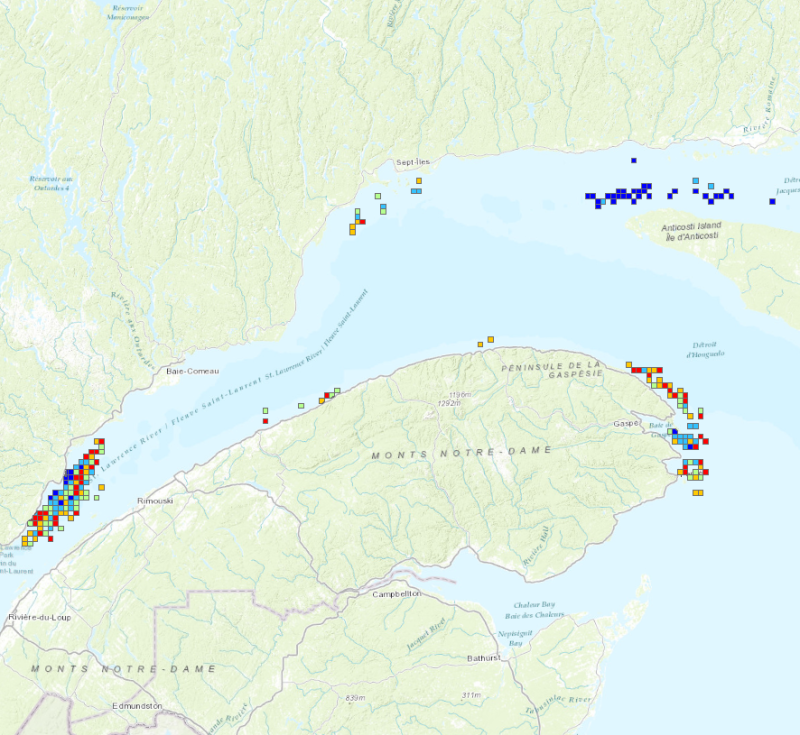
Sightings data were collected by the Mingan Island Cetacean Study (MICS) from 1980 to 2008 with annual surveys realised in the Gulf of St. Lawrence between the end of may and early november. Surveys were conducted using inflatable boats enabling the close approaches necessary to photograph and biopsy blue whales. The aim of this project was to provide additional information for designating blue whale critical habitat as required under the Canadian Species at Risk Act. For more details consult the following report: Ramp, C. and Sears, R. 2013. Distribution, densities, and annual occurrence of individual blue whales (Balaenoptera musculus) in the Gulf of St. Lawrence, Canada from 1980-2008. DFO Can. Sci. Advis. Sec. Res. Doc. 2012/157. vii + 37 p. http://www.dfo-mpo.gc.ca/csas-sccs/Publications/ResDocs-DocRech/2012/2012_157-eng.html Data of blue whale sightings, collected by the MICS, have been analysed per km of effort in 3 x 3 km grid cells in the Gulf of St. Lawrence for the 2000-2008 period.
-

General distribution of Humpback Whales in the Estuary and Gulf of St. Lawrence based on all identified whales from the entire MICS database (Mingan Island Cetacean Study). Additional information The MICS (Mingan Island Cetacean Study) has been collecting and compiling in a photo-identification catalogue, blue whale (and other type of whales) sightings for the western North Atlantic since 1979. Since 1987, the material and sampling protocol has been being relatively stable, neither random nor systematic. Field work is conducted abord inflatable boats. Because the whole Gulf ot St. Lawrence cannot be thoroughly studied, MCIS conducts surveys in known whale aggregation areas. The spatial effort is also weather dependent and is mainly constrained by wind direction and strength. Therefore, the study area is not homogeneously covered. Each whale observation is associated with a picture that allows individual identification based on the animal's pigmentation pattern. For more details consult the mentionned report: Gagné, J.A., Ouellet, P., Savenkoff, C., Galbraith, P.S., Bui, A.O.V. et Bourassa, M.-N. Éd. 2013. Rapport intégré de l’initiative de recherche écosystémique (IRÉ) de la région du Québec pour le projet : les espèces fourragères responsables de la présence des rorquals dans l’estuaire maritime du Saint-Laurent. Secr. can. de consult. sci. du MPO. Doc. de rech. 2013/086. vi + 181 p.
-
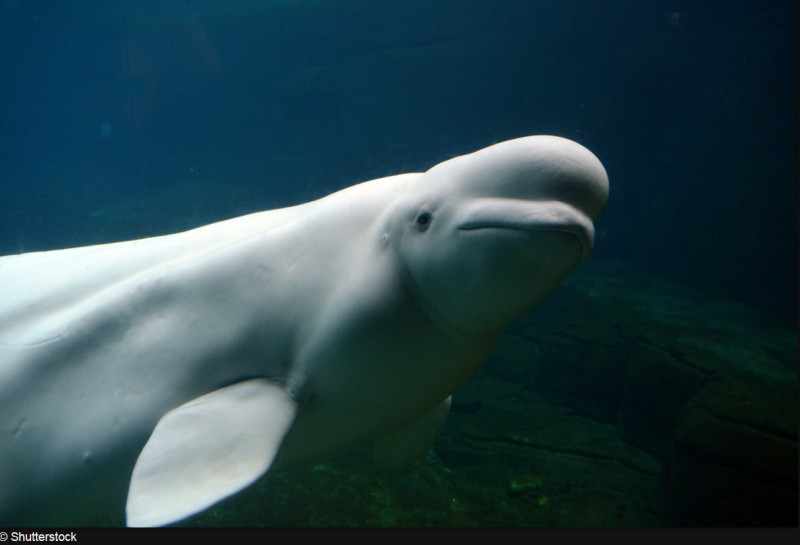
Layers that present various important parameters such as inventories, presence, sightings, distribution, relative occurrence or catch rates, critical habitat, breeding and feeding areas, potential spawning and haul-out sites for the different species with status under the Species at Risk Act (SARA). The act classifies those species as being either extirpated, endangered, threatened, or of special concern. Under SARA, Fisheries and Oceans Canada must produce recovery strategies and action plans for aquatic species listed as endangered or threatened. The act is part of Canada’s strategy to protect hundreds of wild plants and animal species from becoming extinct, and to help in their recovery. The different species represented by the layers are the following: 1. American shad (Alosa sapidissima) 2. Atlantic sturgeon (Acipenser oxyrinchus) 3. Atlantic wolffish (Anarhichas lupus) 4. Beluga whale (Delphinapterus leucas) 5. Blue whale (Balaenoptera musculus) 6. Copper redhorse (Moxostoma hubbsi) 7. Eelgrass (Zostera marina) 8. Grey seal (Halichoerus grypus) 9. Harbor seal (Phoca vitulina) 10. Humpback whale (Megaptera novaeangliae) 11. Lake sturgeon (Acipenser fulvescens) 12. Lumpfish (Cyclopterus lumpus) 13. Northern wolffish (Anarhichas denticulatus) 14. Rainbow smelt (Osmerus mordax) 15. Sea pens (Pennatulacea) 16. Seaweed 17. Smooth skate (Malacoraja senta) 18. Sponges 19. Spotted wolffish (Anarhichas minor) 20. Striped bass (Morone saxatilis) 21. Thorny skate (Amblyraja radiata) 22. Winter skate (Leucoraja ocellata)