 Arctic SDI catalogue
snow cover
Type of resources
Available actions
Topics
Keywords
Contact for the resource
Provided by
Formats
Representation types
Update frequencies
status
-
The Annual Minimum Snow and Ice (MSI) Extent of the Atlas of Canada National Scale Data, are data sets compiled containing annual data from 2000 to present. The data sets were derived from research published by the Canada Centre for Remote Sensing which classified satellite imagery over Canada and neighbouring regions for the continued presence or absence of snow and ice from April 1 to September 20 each year. The Atlas of Canada MSI products consist of a vector dataset and a raster time-series animation application. VECTOR DATASET The vector dataset has been generalized to display at the scale of 1:1,000,000. TIME-SERIES ANIMATION APPLICATION The time-series animation application has not been generalized from its original scale (250 m pixels). The application is disseminated through the Data Cube Platform, implemented by the Canada Centre for Mapping and Earth Observation, Natural Resources Canada using geospatial big data management techniques. These technologies enable the rapid and efficient visualization of high-resolution geospatial data and allow for the rapid generation of dynamically derived products. The time-series is also available as a Web Map Service (WMS) and Web Coverage Service (WCS). CREDIT Source data provided by Alexander P. Trishchenko, Canada Centre for Remote Sensing, Natural Resources Canada Metadata record: https://open.canada.ca/data/en/dataset/808b84a1-6356-4103-a8e9-db46d5c20fcf
-

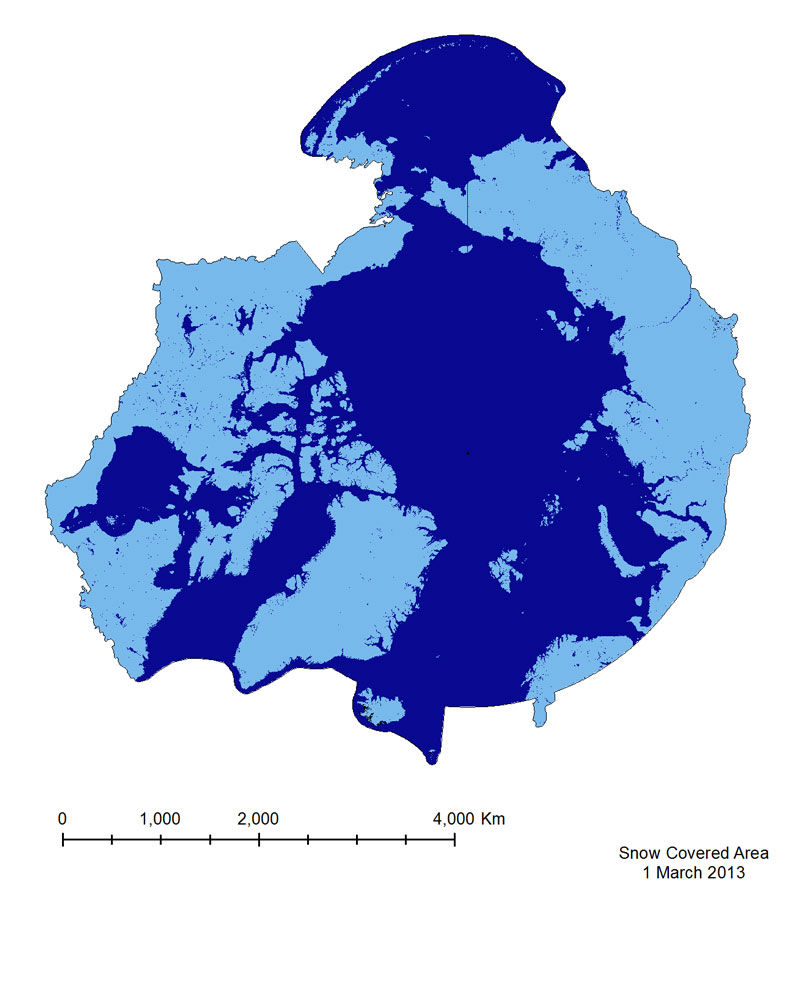
Snow and ice are important hydrological resources. Their minimum spatial extent here referred to as annual minimum snow/ice (MSI) cover, plays a very important role as an indicator of long-term changes and baseline capacity for surface water storage. The MSI probability is derived from sequence of seventeen 10-day clear-sky composites corresponding to April, 1 to September, 20 warm period for each year since 2000. Data from Moderate Resolution Imaging Spectroradiometer (MODIS) on Terra satellite for the period since 2000 have been processed with the special technology developed at the Canada Centre for Remote Sensing (CCRS) as described in Trishchenko, 2016; Trishchenko et al., 2016; 2009, 2006, Trishchenko and Ungureanu, 2021, Khlopenkov and Trishchenko, 2008, Luo et al., 2008. The presence of snow or ice is determined for each pixel of the image based on snow/ice scene identification procedure and the probability if computed for the entire warm season as a ratio of number of snow/ice flags to the total number of pixels available (less or equal to 17). The minimum snow and ice extent can be derived from the probability map by applying a certain threshold. New data version V5.0 replaces previous version V4.0 for all data available since 2000. All MSI files were reprocessed for all MODIS input data based on collection 6.1. The output format has not changed since previous version. It is described in Trishchenko (2024). The impact of input data change is small and can be detected only for time interval 2000-2015. Data starting 2016 has been already derived using MODIS collection 6.1 input. The differences between the MSI data based on MODIS Collection 5 (i.e. MSI V4) versus MODIS Collection 6.1 (i.e. MSI V5), on average, are quite small. The region-wide relative difference in the MSI extent varies from -3.97% to +1.75%. The mean value is -0.14%, the median value is 0.18% and standard deviation is 1.83%. As such, we do not expect any sizeable impact of the version change on our previous conclusions regarding trends and climate variations, except for refining the relative values of statistical parameters within the range of a few percents. References: TRISHCHENKO, A.P., 2024: Probability maps of the annual minimum snow and ice (MSI) presence over April,1 to September, 20 period since 2000 derived from MODIS 250m imagery over Canada and neighbouring regions. Data format description. CCRS, NRCan. 4pp.
-
The Snow Covered Area product is based on a Normalized Difference Snow Index(NDSI), which is similar to NDVI, but exploits different bands in the equation (Equation 3),namely Green (Band 4) and Short Wavelength Near-infrared (SWNIR, Band 6). It isimportant to note that the Band 6 sensor on MODIS Aqua malfunctioned shortly after launch,so Snow Covered Area from the Aqua sensor is calculated using Bands 3 and 7. This mayintroduce errors in identifying snow in vegetated areas, as the use of Band 7 results in falsesnow detection. For this reason the MODIS Terra product has been provided for the CAFF-system.
-

This dataset corresponds to daily snow cover percentage at 1km resolution grid over land areas of Canada from 2006-2010. The data are subsampled by 4km to reduce data volumes and considering the geolocation uncertainty of the input satellite imagery. The daily maps are generated by assimilation of daily cloud screened NOAA AVHRR satellite imagery and Canadian Meteorological Centre (CMC) snow depth analysis snow depth and density fields within an off-line version of the CMC daily snow depth model. The snow depth model is modified to include snowpack reflectance model and a surface radiative transfer scheme that relates vegetation and snowpack reflectance to top-of-canopy bi-directional reflectance. A logistic vegetation phenology model is used to parameterize temporal dynamics of canopy leaf area index. A per-pixel particle filter with a 30 day moving window is applied to assimilation observations corresponding to 1km resolution visible band directional reflectance and normalized difference vegetation index and 24km CMC daily snow depth and monthly snow density fields. The assimilation is forced using daily air temperature and precipitation fields. Validation of the datasets has been performed by comparison to MODIS snow cover maps and in-situ snow depth stations across Canada. Validation suggests similar accuracy to MODIS snow cover products over relatively flat terrain. Validation over mountainous regions is ongoing.