 Arctic SDI catalogue
Satellites
Type of resources
Available actions
Topics
Keywords
Contact for the resource
Provided by
Formats
Representation types
Update frequencies
status
-

The 2015 AAFC Land Use is a culmination and curated metaanalysis of several high-quality spatial datasets produced between 1990 and 2021 using a variety of methods by teams of researchers as techniques and capabilities have evolved. The information from the input datasets was consolidated and embedded within each 30m x 30m pixel to create consolidated pixel histories, resulting in thousands of unique combinations of evidence ready for careful consideration. Informed by many sources of high-quality evidence and visual observation of imagery in Google Earth, we apply an incremental strategy to develop a coherent best current understanding of what has happened in each pixel through the time series.
-
The 2020 AAFC Land Use is a culmination and curated metaanalysis of several high-quality spatial datasets produced between 1990 and 2021 using a variety of methods by teams of researchers as techniques and capabilities have evolved. The information from the input datasets was consolidated and embedded within each 30m x 30m pixel to create consolidated pixel histories, resulting in thousands of unique combinations of evidence ready for careful consideration. Informed by many sources of high-quality evidence and visual observation of imagery in Google Earth, we apply an incremental strategy to develop a coherent best current understanding of what has happened in each pixel through the time series.
-

The 2005 AAFC Land Use is a culmination and curated metaanalysis of several high-quality spatial datasets produced between 1990 and 2021 using a variety of methods by teams of researchers as techniques and capabilities have evolved. The information from the input datasets was consolidated and embedded within each 30m x 30m pixel to create consolidated pixel histories, resulting in thousands of unique combinations of evidence ready for careful consideration. Informed by many sources of high-quality evidence and visual observation of imagery in Google Earth, we apply an incremental strategy to develop a coherent best current understanding of what has happened in each pixel through the time series.
-

The 2010 AAFC Land Use is a culmination and curated metaanalysis of several high-quality spatial datasets produced between 1990 and 2021 using a variety of methods by teams of researchers as techniques and capabilities have evolved. The information from the input datasets was consolidated and embedded within each 30m x 30m pixel to create consolidated pixel histories, resulting in thousands of unique combinations of evidence ready for careful consideration. Informed by many sources of high-quality evidence and visual observation of imagery in Google Earth, we apply an incremental strategy to develop a coherent best current understanding of what has happened in each pixel through the time series.
-

The AAFC Land Use Time Series is a culmination and curated meta-analysis of several high-quality spatial datasets produced between 2000 and 2021 using a variety of methods by teams of researchers as techniques and capabilities have evolved. The information from the input datasets was consolidated and embedded within each 30m x 30m pixel to create consolidated pixel histories, resulting in thousands of unique combinations of evidence ready for careful consideration. Informed by many sources of high-quality evidence and visual observation of imagery in Google Earth, we apply an incremental strategy to develop a coherent best current understanding of what has happened in each pixel through the time series.
-

The 2000 AAFC Land Use is a culmination and curated metaanalysis of several high-quality spatial datasets produced between 1990 and 2021 using a variety of methods by teams of researchers as techniques and capabilities have evolved. The information from the input datasets was consolidated and embedded within each 30m x 30m pixel to create consolidated pixel histories, resulting in thousands of unique combinations of evidence ready for careful consideration. Informed by many sources of high-quality evidence and visual observation of imagery in Google Earth, we apply an incremental strategy to develop a coherent best current understanding of what has happened in each pixel through the time series.
-

In 2012, the Earth Observation Team of the Science and Technology Branch (STB) at Agriculture and Agri-Food Canada (AAFC) repeated the process of generating annual crop inventory digital maps using satellite imagery to for all of Canada (except Newfoundland), in support of a national crop inventory. A Decision Tree (DT) based methodology was applied using optical (DMC, SPOT) and radar (RADARSAT-2) based satellite images, and having a final spatial resolution of 30m. In conjunction with satellite acquisitions, ground-truth information was provided by provincial crop insurance companies and point observations from our regional AAFC colleagues.
-
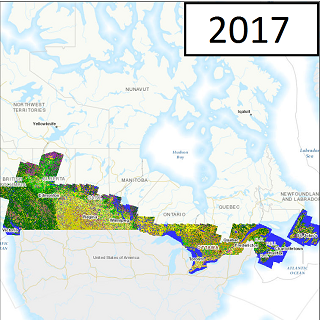
In 2017, the Earth Observation Team of the Science and Technology Branch (STB) at Agriculture and Agri-Food Canada (AAFC) repeated the process of generating annual crop inventory digital maps using satellite imagery to for all of Canada, in support of a national crop inventory. A Decision Tree (DT) based methodology was applied using optical (Landsat-8, Sentinel-2, Gaofen-1) and radar (RADARSAT-2) based satellite images, and having a final spatial resolution of 30m. In conjunction with satellite acquisitions, ground-truth information was provided by: provincial crop insurance companies in Alberta, Saskatchewan, Manitoba, & Quebec; point observations from the BC Ministry of Agriculture, & the Ontario Ministry of Agriculture, Food and Rural Affairs; and data collection supported by our regional AAFC Research and Development Centres in St. John’s, Kentville, Charlottetown, Fredericton, Guelph, and Summerland
-

In 2016, the Earth Observation Team of the Science and Technology Branch (STB) at Agriculture and Agri-Food Canada (AAFC) repeated the process of generating annual crop inventory digital maps using satellite imagery to for all of Canada, in support of a national crop inventory. A Decision Tree (DT) based methodology was applied using optical (Landsat-8, Sentinel-2, Gaofen-1) and radar (RADARSAT-2) based satellite images, and having a final spatial resolution of 30m. In conjunction with satellite acquisitions, ground-truth information was provided by: provincial crop insurance companies in Alberta, Saskatchewan, Manitoba, & Quebec; point observations from the BC Ministry of Agriculture, & the Ontario Ministry of Agriculture, Food and Rural Affairs; and data collection supported by our regional AAFC Research and Development Centres in St. John’s, Kentville, Charlottetown, Fredericton, Guelph, and Summerland.
-

In 2024, the Earth Observation Team of the Science and Technology Branch (STB) at Agriculture and Agri-Food Canada (AAFC) repeated the process of generating annual crop inventory digital maps using satellite imagery for all Canadian provinces and the Yukon Territory, in support of a national crop inventory. A Decision Tree (DT) based methodology was applied using optical (Landsat-8, Landsat-9, Sentinel-2), and radar (RCM) based satellite images, and having a final spatial resolution of 30m. In conjunction with satellite acquisitions, ground-truth information was provided by: provincial crop insurance companies in Alberta, Saskatchewan, Manitoba, & Quebec; point observations from the PEI Department of Environment, Water and Climate Change; and data collection supported by our regional AAFC Research and Development Centres in St. John's, Kentville, Fredericton, Guelph, Summerland and Whitehorse. Forest Fire Perimeter Estimate polygons from Natural Resources Canada’s Canadian Forest Service are used to show burned areas of landcover (Class - 60).