 Arctic SDI catalogue
Glaciers
Type of resources
Available actions
Topics
Keywords
Contact for the resource
Provided by
Years
Formats
Representation types
Update frequencies
status
Service types
Scale
-
The Global Land Ice Measurements from Space (GLIMS) initiative is a cooperative effort of over sixty institutions world-wide with the goal of inventorying and monitoring a majority of the world\'s estimated 160000 glaciers. Each GLIMS institution oversees the analysis of satellite imagery for a particular region containing glacier ice. Data received by the GLIMS team at the National Snow and Ice Data Center (NSIDC) in Boulder, Colorado are inserted into a geospatial database and made available via an on-line interactive map, text-based search interface, a Web Map Service (WMS), and a Web Feature Service (WFS). The GLIMS Glacier Database contains outlines for glaciers smapping all continents having glacial ice. This OGC Web Service is designed to serve GLIMS Glacier Outlines (http://www.glims.org) via the OGC WMS and WFS protocols.
-
The National Snow and Ice Data Center (NSIDC) Atlas of the Cryosphere is a map server that provides data and information pertinent to the frozen regions of Earth, including monthly climatologies of sea ice extent and concentration, snow cover extent, and snow water equivalent, in addition to glacier outlines, permafrost extent and classification, ice sheet elevation and accumulation, and more. In order to support polar projections, the Atlas is divided into two separate map servers: one for the Northern Hemisphere and one for the Southern Hemisphere. In addition to providing map images and source data through Open Geospatial Consortium, Inc. (OGC) protocols (WMS, WFS, and WCS), a dynamic web interface for exploring these data is also available at http://nsidc.org/data/atlas. If you have questions, comments or suggestions, please contact NSIDC User Services at +1.303.492.6199 or nsidc@nsidc.org. The development of this map server application was supported by NASA's Earth Observing System (EOS) Program under contract NAS5-03099 and was developed using MapServer, an Open Source development environment for building spatially-enabled internet applications. To cite the Atlas of the Cryosphere: Maurer, J. 2007. Atlas of the Cryosphere. Boulder, Colorado USA: National Snow and Ice Data Center. Digital media. Available at http://nsidc.org/data/atlas/.
-

Snow and ice are important hydrological resources. Their minimum spatial extent here referred to as annual minimum snow/ice (MSI) cover, plays a very important role as an indicator of long-term changes and baseline capacity for surface water storage. The MSI probability is derived from sequence of seventeen 10-day clear-sky composites corresponding to April, 1 to September, 20 warm period for each year since 2000. Data from Moderate Resolution Imaging Spectroradiometer (MODIS) on Terra satellite for the period since 2000 have been processed with the special technology developed at the Canada Centre for Remote Sensing (CCRS) as described in Trishchenko, 2016; Trishchenko et al., 2016; 2009, 2006, Trishchenko and Ungureanu, 2021, Khlopenkov and Trishchenko, 2008, Luo et al., 2008. The presence of snow or ice is determined for each pixel of the image based on snow/ice scene identification procedure and the probability if computed for the entire warm season as a ratio of number of snow/ice flags to the total number of pixels available (less or equal to 17). The minimum snow and ice extent can be derived from the probability map by applying a certain threshold. New data version V5.0 replaces previous version V4.0 for all data available since 2000. All MSI files were reprocessed for all MODIS input data based on collection 6.1. The output format has not changed since previous version. It is described in Trishchenko (2024). The impact of input data change is small and can be detected only for time interval 2000-2015. Data starting 2016 has been already derived using MODIS collection 6.1 input. The differences between the MSI data based on MODIS Collection 5 (i.e. MSI V4) versus MODIS Collection 6.1 (i.e. MSI V5), on average, are quite small. The region-wide relative difference in the MSI extent varies from -3.97% to +1.75%. The mean value is -0.14%, the median value is 0.18% and standard deviation is 1.83%. As such, we do not expect any sizeable impact of the version change on our previous conclusions regarding trends and climate variations, except for refining the relative values of statistical parameters within the range of a few percents. References: TRISHCHENKO, A.P., 2024: Probability maps of the annual minimum snow and ice (MSI) presence over April,1 to September, 20 period since 2000 derived from MODIS 250m imagery over Canada and neighbouring regions. Data format description. CCRS, NRCan. 4pp.
-
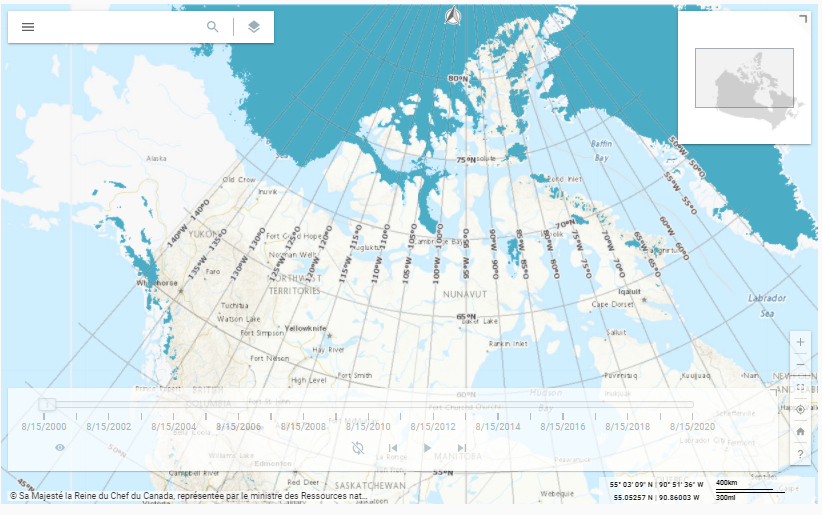
The Annual Minimum Snow and Ice (MSI) Extent of the Atlas of Canada National Scale Data, are data sets compiled containing annual data from 2000 to present. The data sets were derived from research published by the Canada Centre for Remote Sensing which classified satellite imagery over Canada and neighbouring regions for the continued presence or absence of snow and ice from April 1 to September 20 each year. The Atlas of Canada MSI products consist of a vector dataset and a raster time-series animation application. VECTOR DATASET The vector dataset has been generalized to display at the scale of 1:1,000,000. TIME-SERIES ANIMATION APPLICATION The time-series animation application has not been generalized from its original scale (250 m pixels). The application is disseminated through the Data Cube Platform, implemented by the Canada Centre for Mapping and Earth Observation, Natural Resources Canada using geospatial big data management techniques. These technologies enable the rapid and efficient visualization of high-resolution geospatial data and allow for the rapid generation of dynamically derived products. The time-series is also available as a Web Map Service (WMS) and Web Coverage Service (WCS). CREDIT Source data provided by Alexander P. Trishchenko, Canada Centre for Remote Sensing, Natural Resources Canada Metadata record: https://open.canada.ca/data/en/dataset/808b84a1-6356-4103-a8e9-db46d5c20fcf
-
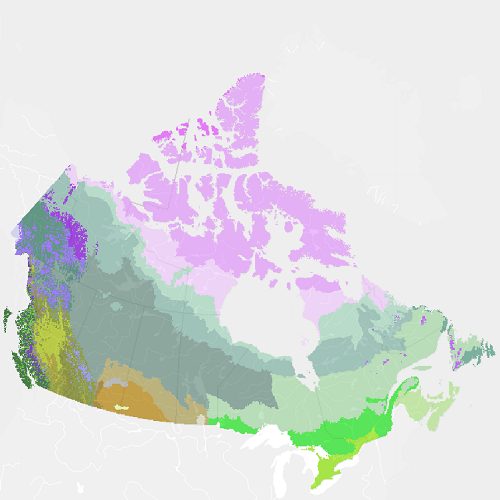
"Vegetation Zones of Canada: a Biogeoclimatic Perspective" maps Canadian geography in relation to gradients of regional climate, as expressed by potential vegetation on zonal sites. Compared to previous similar national-scale products, "Vegetation Zones of Canada" benefits from the work of provincial and territorial ecological classification programs over the last 30+ years, incorporating this regional knowledge of ecologically significant climatic gradients into a harmonized national map. This new map, reflecting vegetation and soils adapted to climates prior to approximately 1960, can serve as a broad-scale (approximately 1:5 M to 1:10 M) geospatial reference for monitoring and modeling effects of climate changes on Canadian ecosystems. "Vegetation Zones of Canada: a Biogeoclimatic Perspective" employs a two-level hierarchical legend. Level 1 vegetation zones reflect the global-scale latitudinal gradient of annual net radiation, as well as the effects of high elevation and west to east climatic and biogeographic variation across Canada. Within the level 1 vegetation zones, level 2 zones distinguish finer scale variation in zonal vegetation, especially in response to elevational and arctic climatic gradients, climate-related floristics and physiognomic diversity in the Great Plains, and maritime climatic influences on the east and west coasts. Thirty-three level 2 vegetation zones are recognized: High Arctic Sparse Tundra Mid-Arctic Dwarf Shrub Tundra Low Arctic Shrub Tundra Subarctic Alpine Tundra Western Boreal Alpine Tundra Cordilleran Alpine Tundra Pacific Alpine Tundra Eastern Alpine Tundra Subarctic Woodland-Tundra Northern Boreal Woodland Northwestern Boreal Forest West-Central Boreal Forest Eastern Boreal Forest Atlantic Maritime Heathland Pacific Maritime Rainforest Pacific Dry Forest Pacific Montane Forest Cordilleran Subboreal Forest Cordilleran Montane Forest Cordilleran Rainforest Cordilleran Dry Forest Eastern Temperate Mixed Forest Eastern Temperate Deciduous Forest Acadian Temperate Forest Rocky Mountains Foothills Parkland Great Plains Parkland Intermontane Shrub-Steppe Rocky Mountains Foothills Fescue Grassland Great Plains Fescue Grassland Great Plains Mixedgrass Grassland Central Tallgrass Grassland Cypress Hills Glaciers Please cite this dataset as: Baldwin, K.; Allen, L.; Basquill, S.; Chapman, K.; Downing, D.; Flynn, N.; MacKenzie, W.; Major, M.; Meades, W.; Meidinger, D.; Morneau, C.; Saucier, J-P.; Thorpe, J.; Uhlig, P. 2019. Vegetation Zones of Canada: a Biogeoclimatic Perspective. [Map] Scale 1:5,000,000. Natural Resources Canada, Canadian Forest Service. Great Lake Forestry Center, Sault Ste. Marie, ON, Canada.
-
The National Snow and Ice Data Center (NSIDC) Atlas of the Cryosphere is a map server that provides data and information pertinent to the frozen regions of Earth, including monthly climatologies of sea ice extent and concentration, snow cover extent, and snow water equivalent, in addition to glacier outlines, ice sheet elevation and accumulation, and more. In order to support polar projections, the Atlas is divided into two separate map servers: one for the Northern Hemisphere and one for the Southern Hemisphere. In addition to providing map images and source data through Open Geospatial Consortium, Inc. (OGC) protocols (WMS, WFS, and WCS), a dynamic web interface for exploring these data is also available at http://nsidc.org/data/atlas. If you have questions, comments or suggestions, please contact NSIDC User Services at +1.303.492.6199 or nsidc@nsidc.org. The development of this map server application was supported by NASA's Earth Observing System (EOS) Program under contract NAS5-03099 and was developed using MapServer, an Open Source development environment for building spatially-enabled internet applications. To cite the Atlas of the Cryosphere: Maurer, J. 2007. Atlas of the Cryosphere. Boulder, Colorado USA: National Snow and Ice Data Center. Digital media. Available at http://nsidc.org/data/atlas/.
-
The National Snow and Ice Data Center (NSIDC) Antarctic Cryosphere Access Portal (A-CAP) is a map server that provides data and information pertinent to the frozen regions of the Antarctic ice sheet and the Southern Ocean, including monthly climatologies of sea ice extent and concentration, ice sheet elevation and accumulation, satellite imagery, and more. In addition to providing map images and source data through Open Geospatial Consortium, Inc. (OGC) protocols--Web Map Service (WMS), Web Feature Service (WFS), and Web Coverage Service (WCS)--a dynamic Web interface for exploring these data is also available at http://nsidc.org/agdc/acap/. If you have questions, comments or suggestions, please contact NSIDC User Services at +1.303.492.6199 or nsidc@nsidc.org.
-
The National Snow and Ice Data Center (NSIDC) Atlas of the Cryosphere is a map server that provides data and information pertinent to the frozen regions of Earth, including monthly climatologies of sea ice extent and concentration, snow cover extent, and snow water equivalent, in addition to glacier outlines, permafrost extent and classification, ice sheet elevation and accumulation, and more. In order to support polar projections, the Atlas is divided into two separate map servers: one for the Northern Hemisphere and one for the Southern Hemisphere. In addition to providing map images and source data through Open Geospatial Consortium, Inc. (OGC) protocols (WMS, WFS, and WCS), a dynamic web interface for exploring these data is also available at http://nsidc.org/data/atlas. If you have questions, comments or suggestions, please contact NSIDC User Services at +1.303.492.6199 or nsidc@nsidc.org. The development of this map server application was supported by NASA's Earth Observing System (EOS) Program under contract NAS5-03099 and was developed using MapServer, an Open Source development environment for building spatially-enabled internet applications. To cite the Atlas of the Cryosphere: Maurer, J. 2007. Atlas of the Cryosphere. Boulder, Colorado USA: National Snow and Ice Data Center. Digital media. Available at http://nsidc.org/data/atlas/.
-

This collection is a legacy product that is no longer supported. It may not meet current government standards. The North American Atlas data are standardized geospatial data sets at 1:10,000,000 scale. A variety of basic data layers (e.g. roads, railroads, populated places, political boundaries, hydrography, bathymetry, sea ice and glaciers) have been integrated so that their relative positions are correct. This collection of data sets forms a base with which other North American thematic data may be integrated. The North American Atlas data are intended for geographic display and analysis at the national and continental level. Any data outside of Canada, Mexico, and the United States of America included in the North American Atlas data sets is strictly to complete the context of the data.