 Arctic SDI catalogue
statistics
Type of resources
Available actions
Topics
Keywords
Contact for the resource
Provided by
Years
Formats
Representation types
Update frequencies
status
Service types
-
Population density in Canada based on the 2006 and 2011 census data at three levels of geography: census division (CD) (1:5,000,001 and over), census sub-division (CSD) (1:5,000,000 to 1:288,897) and dissemination areas (DA) (1:288,897 and under). Population density is the number of people per square kilometer. Population density change measures the rate of change calculated by the difference in total population density values for each area between 2006 and 2011, divided by the total population density of 2006. The CD and CSD boundaries are based on 2011 data. The 2006 population figures have been adjusted accordingly. The DA boundaries are based on 2006 data. All areas with no data are indicated with a value of -999.
-

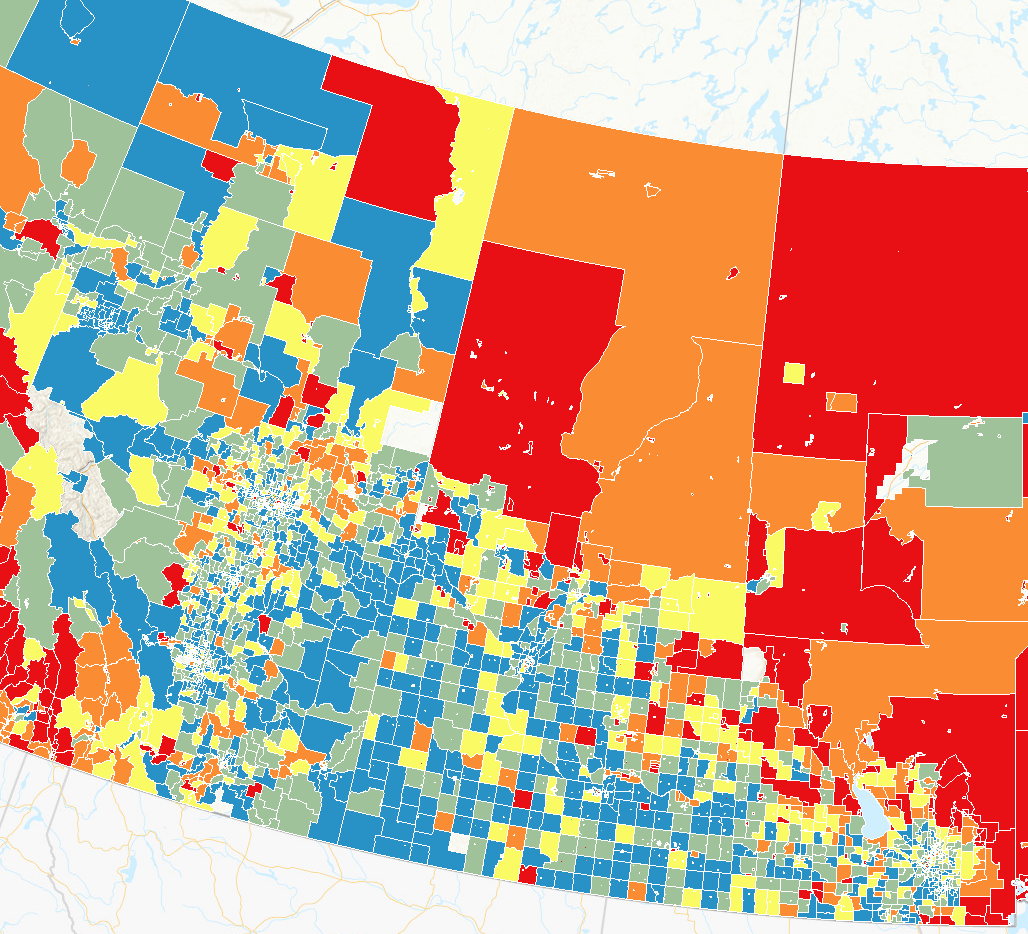
The Canadian Index of Multiple Deprivation (CIMD) is an area-based index which used 2021 Census of Population microdata to measure four key dimensions of deprivation at the dissemination area (DA)-level: residential instability, economic dependency, situational vulnerability and ethno-cultural composition. Using factor analysis, DA-level factor scores were calculated for each dimension. Within a dimension, ordered scores were assigned a quintile value, 1 through 5, where 1 represents the least deprived and 5 represents the most deprived. The CIMD allows for an understanding of inequalities in various measures of health and social well-being. While it is a geographically-based index of deprivation and marginalization, it can also be used as a proxy for an individual. The CIMD has the potential to be widely used by researchers on a variety of topics related to socio-economic research. Other uses for the index may include: policy planning and evaluation, or resource allocation. *** Correction October 22, 2024 *** A correction has been made to the variables in the following downloadable 2021 CIMD index datasets : Canada, Atlantic, Quebec, Ontario, Prairies, and British-Columbia. This correction impacts all the data in these datasets.
-

This service shows the ratio of immigrants who arrived between 2001 and 2016 to immigrants who arrived before 2001, by 2016 census division. The data is a custom extraction from the 2016 Census - 25% sample data. This data pertains to persons in private households who are immigrants by their period of immigration. 'Immigrant' includes persons who are, or who have ever been, landed immigrants or permanent residents. Such persons have been granted the right to live in Canada permanently by immigration authorities. Immigrants who have obtained Canadian citizenship by naturalization are included in this category. In the 2016 Census of Population, 'Immigrant' includes immigrants who landed in Canada on or prior to May 10, 2016. 'Period of immigration' refers to the period in which the immigrant first obtained landed immigrant or permanent resident status. For additional information refer to the 2016 Census Dictionary for 'Immigrant status' and 'Period of immigration'. For additional information refer to the 2016 Census Dictionary for 'Immigrant status' and 'Period of immigration'. To have a cartographic representation of the ecumene with this socio-economic indicator, it is recommended to add as the first layer, the “NRCan - 2016 population ecumene by census division” web service, accessible in the data resources section below.
-

This service shows the ratio of persons aged 0 to 14 and 65 and over (children and seniors) versus persons aged 15 to 64 (working-age) by census division. The data is a custom extraction from the 2016 Census - 100% data. This data pertains to the total population by age. 'Age' refers to the age at last birthday before the reference date, that is, before May 10, 2016. For additional information refer to 'Age' in the 2016 Census Dictionary. For additional information refer to 'Age' in the 2016 Census Dictionary. To have a cartographic representation of the ecumene with this socio-economic indicator, it is recommended to add as the first layer, the “NRCan - 2016 population ecumene by census division” web service, accessible in the data resources section below.
-

Statistics Canada, in collaboration with the Public Health Agency of Canada and Natural Resources Canada, is presenting selected Census data to help inform Canadians on the public health risk of the COVID-19 pandemic and to be used for modelling analysis.The data provided here show the population counts and percentage distribution for various geographic levels by broad age groups, males, females and both sexes, from the 2016 Census.
-

This service shows the percentage of population, excluding institutional residents, with knowledge of English and French for Canada by 2016 census subdivision. The data is from the Census Profile, Statistics Canada Catalogue no. 98-316-X2016001. Knowledge of official languages refers to whether the person can conduct a conversation in English only, French only, in both languages or in neither language. For a child who has not yet learned to speak, this includes languages that the child is learning to speak at home. For additional information refer to 'Knowledge of official languages' in the 2016 Census Dictionary. For additional information refer to 'Knowledge of official languages' in the 2016 Census Dictionary. To have a cartographic representation of the ecumene with this socio-economic indicator, it is recommended to add as the first layer, the “NRCan - 2016 population ecumene by census subdivision” web service, accessible in the data resources section below.
-

This service shows the predominant mother tongue in each census division based on English, French or non-official language. The data is from the data table Mother Tongue (10), Age (27) and Sex (3) for the Population of Canada, Provinces and Territories, Census Divisions and Census Subdivisions, 2016 Census - 100% Data, Statistics Canada Catalogue no. 98-400-X2016046. Mother tongue refers to the first language learned at home in childhood and still understood by the person at the time the data was collected. If the person no longer understands the first language learned, the mother tongue is the second language learned. For a person who learned two languages at the same time in early childhood, the mother tongue is the language this person spoke most often at home before starting school. The person has two mother tongues only if the two languages were used equally often and are still understood by the person. For a child who has not yet learned to speak, the mother tongue is the language spoken most often to this child at home. The child has two mother tongues only if both languages are spoken equally often so that the child learns both languages at the same time. For additional information refer to the 2016 Census Dictionary for 'Mother tongue'. To have a cartographic representation of the ecumene with this socio-economic indicator, it is recommended to add as the first layer, the “NRCan - 2016 population ecumene by census division” web service, accessible in the data resources section below.
-
The Canadian Index of Multiple Deprivation (CIMD) is an area-based index which used 2016 Census of Population microdata to measure four key dimensions of deprivation at the dissemination area (DA)-level: residential instability, economic dependency, situational vulnerability and ethno-cultural composition. Using factor analysis, DA-level factor scores were calculated for each dimension. Within a dimension, ordered scores were assigned a quintile value, 1 through 5, where 1 represents the least deprived and 5 represents the most deprived. The CIMD allows for an understanding of inequalities in various measures of health and social well-being. While it is a geographically-based index of deprivation and marginalization, it can also be used as a proxy for an individual. The CIMD has the potential to be widely used by researchers on a variety of topics related to socio-economic research. Other uses for the index may include: policy planning and evaluation, or resource allocation.
-

This service shows the percentage of population aged 25 to 64 years in private households with a postsecondary certificate, diploma or degree by census division, 2016. The data is from the Census Profile, Statistics Canada Catalogue no. 98-316-X2016001. This data pertains to the population aged 25 to 64 years in private households by the highest level of education that a person has successfully completed. Persons with a post-secondary certificate, diploma or degree includes those with an apprenticeship or trades certificate or diploma; a college, CEGEP or other non-university certificate or diploma; a university certificate or diploma below bachelor level or a university certificate, diploma or degree at bachelor level or above. For additional information refer to the 2016 Census Dictionary for ' Highest certificate, diploma or degree'. For additional information refer to the 2016 Census Dictionary for ' Highest certificate, diploma or degree'. To have a cartographic representation of the ecumene with this socio-economic indicator, it is recommended to add as the first layer, the “NRCan - 2016 population ecumene by census division” web service, accessible in the data resources section below.
-

This service shows the ratio of persons aged 0 to 14 and 65 and over (children and seniors) versus persons aged 15 to 64 (working-age) by census subdivision. The data is a custom extraction from the 2016 Census - 100% data. This data pertains to the total population by age. 'Age' refers to the age at last birthday before the reference date, that is, before May 10, 2016. For additional information refer to 'Age' in the 2016 Census Dictionary. For additional information refer to 'Age' in the 2016 Census Dictionary. To have a cartographic representation of the ecumene with this socio-economic indicator, it is recommended to add as the first layer, the “NRCan - 2016 population ecumene by census subdivision” web service, accessible in the data resources section below.