Society
Type of resources
Available actions
Topics
Keywords
Contact for the resource
Provided by
Years
Formats
Representation types
Update frequencies
status
Service types
Scale
-

The “Businesses by Census Subdivision” is derived from the Statistics Canada’s Business Register. At the request of Agriculture and Agri-Food Canada, Statistics Canada aggregated the number of businesses per NAICS classification and employment class for each Census Subdivision. The data includes the individual occurrences of a business in each census subdivision by indicating its NAICS classification and employment class. The name, location, and any other identifying information about the businesses has been suppressed by Statistics Canada.
-

Vinsamlega hafið samband við Hagstofuna vegna nánari upplýsinga.
-
A population ecumene is the area of inhabited lands or settled areas generally delimited by a minimum population density. This ecumene shows the areas of the densest and most extended population within census divisions. Census divisions are the provincially legislated areas (such as county, municipalité régionale de comté, and regional district) or their equivalents. Census divisions are intermediate geographic areas between the province or territory level and the municipality (census subdivision). For further information, consult the Statistics Canada’s 2016 Illustrated Glossary (see below under Data Resources). The assemblage of dissemination area population density data from the 2016 Census of Population are used to form the ecumene within census divisions. Areas included in the ecumene are dissemination areas where the population density is greater than or equal to 0.4 persons per square kilometre or about one person per square mile. In some areas to capture more population within the ecumene the criteria was extended to 0.2 persons per square kilometre. The ecumene areas were generalized in certain areas to enhance the size of some isolated ecumene areas in northern Canada. This map can be used as an “ecumene” overlay to differentiate the sparsely populated areas from the ecumene in conjunction with census division data or other small-scale maps. This ecumene shows a more meaningful distribution of the population for Canada.
-

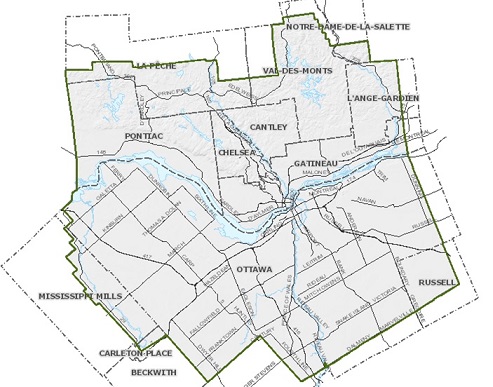
Boundaries of the National Capital Region since 1959, with the coming into force of the National Capital Act
-

[ARCHIVED] The “Nova Scotia Communities Engaged in Age-Friendly Community Planning” dataset is no longer being updated. This dataset has been superseded by Age-Friendly Communities Grant Funding Recipients. List of communities across Nova Scotia that are engaged in Age-Friendly Community planning.
-

A listing of SchoolsPlus sites, including Hub sites and schools by Hub.
-

This the data for the Winnipeg AVPA Regulation's interactive web map. It contains two polygon datasets that help users determine whether a property is affected by requirements in the regulation and a point dataset to help users navigate to properties This is the data for the Winnipeg Airport Vicinity Protection Area Regulation's interactive web map. It was developed to help interested parties determine whether a property is affected by the Airport Vicinity Protection Area Regulation. To protect and foster the airport’s operations and continued growth, while ensuring orderly and efficient development within Winnipeg, the Province has adopted an Airport Vicinity Protection Area Regulation under The City of Winnipeg Charter. The regulation defines two protection areas called "Area 1" and "Area 2".These areas provide direction on where and what type of residential development may take place near the airport. Area 1 comprises of lands immediately adjacent to the airport, where no new residential development will be permitted, except for replacement of buildings and minor infilling. Area 2 is located further away from the airport, where new or replacement residential development may be constructed. All development within the regulated lands must comply with indoor noise level limits set out in the Regulation. The parcel boundaries in this interactive map are representations of parcels as defined by plan of subdivision or plan of survey registered at the Land Titles Office. This type of property boundary was chosen because the land division in these plans is used to define property ownership in Manitoba.
-
In the Greenbelt Master Plan (2013), the proposed land designations are a “classification” which assigns desired landscape character and uses to defined land areas across the Greenbelt. Areas are classified according to their desired role, whether to protect biodiversity, maintain agricultural resources, or accommodate permanent facilities. https://ncc-ccn.gc.ca/our-plans/greenbelt-master-plan https://ncc-website-2.s3.amazonaws.com/documents/final-2013-greenbelt-master-plan-en.pdf#page=69
-

This the data for the Winnipeg AVPA Regulation's interactive web map. It contains two polygon datasets that help users determine whether a property is affected by requirements in the regulation and a point dataset to help users navigate to properties This is the data for the Winnipeg Airport Vicinity Protection Area Regulation's interactive web map. It was developed to help interested parties determine whether a property is affected by the Airport Vicinity Protection Area Regulation. To protect and foster the airport’s operations and continued growth, while ensuring orderly and efficient development within Winnipeg, the Province has adopted an Airport Vicinity Protection Area Regulation under The City of Winnipeg Charter. The regulation defines two protection areas called "Area 1" and "Area 2".These areas provide direction on where and what type of residential development may take place near the airport. Area 1 comprises of lands immediately adjacent to the airport, where no new residential development will be permitted, except for replacement of buildings and minor infilling. Area 2 is located further away from the airport, where new or replacement residential development may be constructed. All development within the regulated lands must comply with indoor noise level limits set out in the Regulation. The parcel boundaries in this interactive map are representations of parcels as defined by plan of subdivision or plan of survey registered at the Land Titles Office. This type of property boundary was chosen because the land division in these plans is used to define property ownership in Manitoba.
-

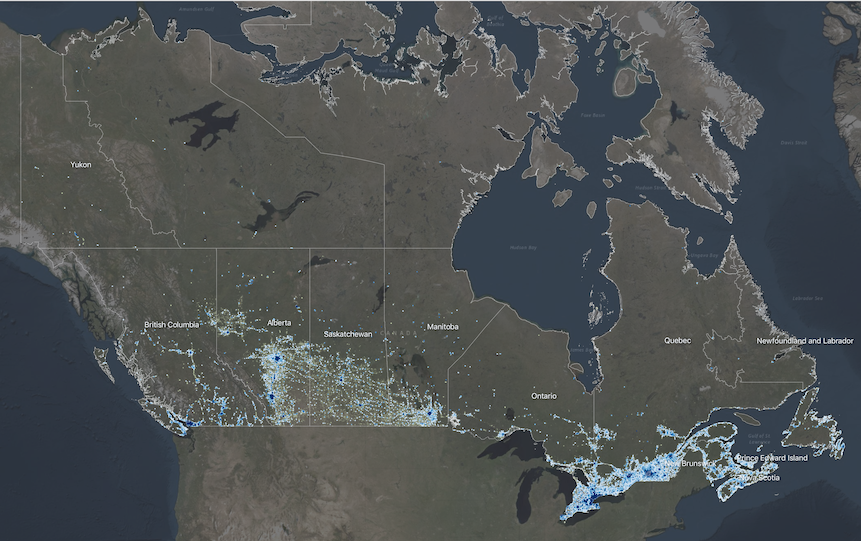
The Physical Exposure component of the National Human Settlement Layer (NHSL), defined here as the ‘Physical Exposure Model’, includes a delineation of settled areas and related land use across Canada, as well as information about buildings, persons, and building replacement values (structure and contents) within those areas. Buildings within the inventory are classified using a combination of occupancy types, engineering-based construction types adopted for Canada, and design levels representing the approximate building code requirements at the time of construction. The inventory is derived from detailed housing statistics provided at the dissemination area level as part of the 2016 national census and from georeferenced business listings. Building populations at different times of day are estimated for standard daytime hours (9am-5pm); for morning and evening commute hours (7am-9am; 5pm-7pm), and; for nighttime hours when the majority of people are home (7pm-7am). Replacement values are provided for structural, nonstructural, and contents components of buildings, based on industry replacement costs for representative regions across Canada. The physical exposure model is provided in two formats: (1) According to settled areas (i.e., polygons), which are areas that approximately delineate clusters of buildings across Canada. Summary statistics about buildings and populations within each settled area boundary are provided. (2) According to building archetypes (i.e., points) within settled areas. These are represented as point locations at the centroid of the corresponding settled area, and each settled area can have multiple point features corresponding to different building archetypes present within that area. In total, the model characterizes 35.2 million people in 9.7 million buildings across 390,000 locations with a total approximate replacement value of $8.2 trillion (2019 CAD) including contents.
 Arctic SDI catalogue