 Arctic SDI catalogue
Drainage
Type of resources
Available actions
Topics
Keywords
Contact for the resource
Provided by
Years
Formats
Representation types
Update frequencies
status
Service types
Scale
-

LiDAR data was collected using LSI's proprietary Helix LiDAR system - Novatel GPS and SPANS inertial unit, coupled to a Riegl Q560 digital waveform ranging laser and mounted in a Cessna 185 aircraft. LiDAR was collected at 600m AGL, and a ground speed of 160km/h. Original data was in an ASCII XYZ coordinate format.
-
Lignes de courbes de niveau générés à partir des données LiDAR capturés par McElhanney Consulting Services Ltd (MCSL). Les courbes de niveau relient les points de même élévation pour le paysage visé par le projet. Pour plus d'information, consulter : http://ouvert.canada.ca/data/fr/dataset/9bdc1a9c-baf7-4eb0-a532-c1057b284b8f
-
Contour Lines generated from LiDAR data captured by McElhanney Consulting Services Ltd (MCSL). The contour lines connect points of equal elevation for the landscape covered by this project. For more information, visit: http://open.canada.ca/data/en/dataset/9bdc1a9c-baf7-4eb0-a532-c1057b284b8f
-
Contour Lines generated from LiDAR data captured by McElhanney Consulting Services Ltd (MCSL). The contour lines connect points of equal elevation for the landscape covered by this project. For more information, visit: http://open.canada.ca/data/en/dataset/9bdc1a9c-baf7-4eb0-a532-c1057b284b8f
-

The “Gross and Effective Drainage Areas for Hydrometric Gauging Stations of the AAFC Watersheds Project - 2013” dataset is a table that provides the calculated gross and effective drainage areas associated with the hydrometric gauging stations of the Agriculture and Agri-Food Canada (AAFC) Watersheds Project. Areas are provided in square kilometres. ‘Gross drainage’ describes the total area of a catchment. ‘Effective drainage’ describes areas that are expected to contribute to an average runoff.
-
The Agriculture and Agri-Food Canada's (AAFC) Watersheds Project level series supplies a number of watershed and watershed related datasets for the Prairie Provinces. The levels are greater or smaller assemblages of hydrometric areas, or the components defining them. The Project is organized by the hydrometric gauging station which are sourced from Environment Canada, the United States and Canadian provinces. Additional stations were generated to address structural issues, like river confluences or lake inlets. Collectively, they are referred to as the gauging stations, or simply, the stations. The drainage area that each station monitors, between itself and one or more of its upstream neighbours, is called an 'incremental gross drainage area'. The incremental gross drainage areas are collected into larger or smaller groupings based on size or defined interest to generate the various 'levels'of the series. For more information, visit: http://open.canada.ca/data/en/dataset/c20d97e7-60d8-4df8-8611-4d499a796493
-

The "Total Effective Drainage Areas of the AAFC Watersheds Project – 2013” dataset is a geospatial data layer containing polygon features representing the areas within the “total gross drainage areas” of each hydrometric gauging station of the Agriculture and Agri-Food Canada (AAFC) Watersheds Project that would contribute to average runoff. A ‘total gross drainage area’ is the maximum area that could contribute runoff for a single gauging station – the ‘total effective drainage areas’ are those parts of that ‘total gross drainage area’ that would contribute surface runoff to an average runoff. For each “total gross drainage area” there can be only one “total effective drainage areas”. These polygons may overlap with those from other gauging stations’ “total gross drainage area”, as upstream land surfaces form part of multiple downstream gauging stations’ “total gross drainage areas”.
-

McElhanney Consulting Services Ltd (MCSL) has performed a LiDAR and Imagery survey in southern Saskatchewan. The purpose was to generate DEMs for hydraulic modeling of floodplain, digital terrain maps, and other products for portions of the Swift Current Creek valley and other miscellaneous tributaries and related water course valleys in and around the City of Swift Current. The acquisition was completed between the 16th and 25th of October, 2009. The survey consisted of approximately 790 square kilometers of coverage. While collecting the LiDAR data, we also acquired aerial photo in RGB and NIR modes consisting of 1649 frames each. In addition to the main area of interest, McElhanney has acquired some LiDAR and photo of low lying areas adjacent to the project area. This additional area was acquired on speculation that the data may be required in the future. The 3Dimensional laser returns (point cloud) were classified using Microstation (v8), Terrascan and TerraModeler. A series of algorithms based on topography were created to separate laser returns that hit the ground from the ones that hit objects above the ground. Steps taken are: Classified LiDAR surface as Bare earth, Classified other features as non-bare earth or default, Formatted to ASPRS .LAS V1.1 (Class 1 - Default (non-bare earth), Class 2 – Ground points (bare earth)), 239 tiles each 2km x2km generated for LiDAR data, File prefix FF – Classified (Non-Bare Earth and Bare Earth), File Prefix BE – Bare Earth only, Bare Earth Model Key Point (MKPts) surface files are thinned Bare earth LiDAR points. MKPts files generate a virtually identical surface without the large file size, MKPts file format is ASCII (Easting Northing Z-elevation) xyz and LAS format.
-
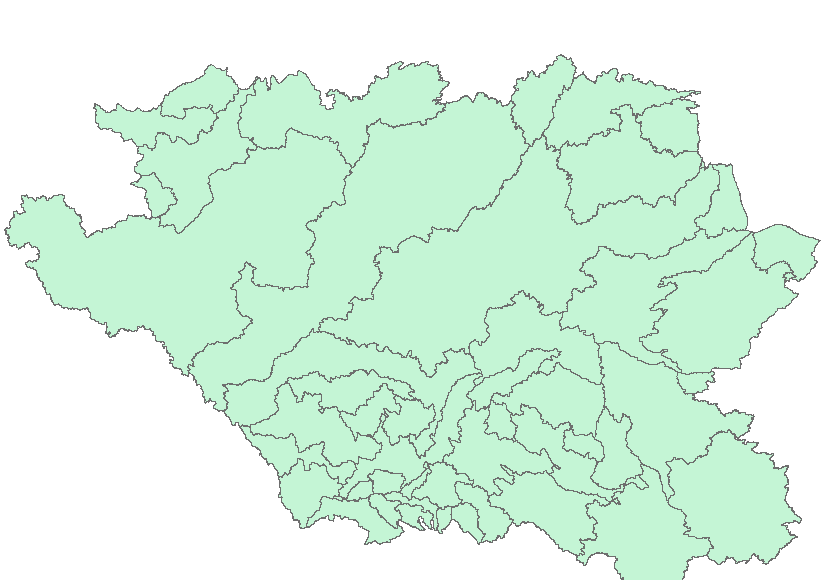
The “PFRA Sub-basins of the AAFC Watersheds Project – 2013” dataset is a geospatial data layer containing polygon features representing the 47 sub-basins within the Agriculture and Agri-Food Canada (AAFC) Watersheds Project, tailored for the Prairie Farm Rehabilitation Administration (PFRA) business needs.