farming
Type of resources
Available actions
Topics
Keywords
Contact for the resource
Provided by
Years
Formats
Representation types
Update frequencies
status
Scale
Resolution
-

In 2020, the Earth Observation Team of the Science and Technology Branch (STB) at Agriculture and Agri-Food Canada (AAFC) repeated the process of generating annual crop inventory digital maps using satellite imagery to for all of Canada, in support of a national crop inventory. A Decision Tree (DT) based methodology was applied using optical (Landsat-8, Sentinel-2) based satellite images, and having a final spatial resolution of 30m. In conjunction with satellite acquisitions, ground-truth information was provided by: provincial crop insurance companies in Alberta, Manitoba, & Quebec; point observations from the PEI Department of Environment, Water and Climate Change; the Ontario Ministry of Agriculture, Food and Rural Affairs; and data collection supported by our regional AAFC Research and Development Centres in St. John’s, Charlottetown, Fredericton, and Guelph. Due to COVID-19 travel restrictions, complete sampling coverages in NL, NS, NB and BC were not possible, as a result the general agriculture class (120) is found in these provinces in areas where there was no ground data collected.
-

Map showing where custom packaging services in Manitoba are located. This map shows where custom packaging services in Manitoba are located. A contract packager (subcontractor) is a company that manufactures and packages food products sold by other businesses. This list is not exhaustive and does not constitute a recommendation for services. For more information, visit the Manitoba Agriculture website. <o:p></o:p>This map uses the Manitoba contract packaging point layer and is part of the Manitoba contract packaging app. **This third party metadata element was translated using an automated translation tool (Amazon Translate).**
-

The Canada Land Inventory (CLI), 1:000,000, Land Capability for Agriculture dataset illustrates the varying potential of a specific area for agricultural production. Classes of land capability for agriculture are based on mineral soils grouped according to their potential and limitations for agricultural use. The classes indicate the degree of limitation imposed by the soil in its use for mechanized agriculture. The subclasses indicate the kinds of limitations that individually or in combination with others, are affecting agricultural land use. Characteristics of the soil as determined by soil surveys.
-

The Grain Elevators in Canada - 2022 dataset maps the list of grain elevators in Canada as provided by the Canadian Grain Commission (CGC). The elevators have been located as much as possible to an actual location rather than generalizing to the station name centroid. Additionally car spot information from CN, CP and the grain companies has been added where this has been published. This dataset attempts to provide a temporal and geographical extent of the grain elevators in Canada.
-

The 2006 Derived Interpolated Census of Agriculture by Soil Landscapes of Canada takes a subset of attributes from the 2006 Agricultural Census and creates new derived attributes that show the proportionate contribution of a variable to the total.
-

The following dataset correspond to the 230 m agricultural mask from Statistics Canada’s Crop Condition Assessment Program (CCAP). The mask have been generated from the classes 110 to 199 of the 2015 Agriculture and Agri-Food Canada’s landcover classification. The selection was then generalized to a spatial resolution of 230 m. The 2015 mask was used from the 2015 to the 2018 growing seasons inclusively.
-

The Census of Agriculture is disseminated by Statistics Canada's standard geographic units (boundaries). Since these census units do not reflect or correspond with biophysical landscape units (such as ecological regions, soil landscapes or drainage areas), Agriculture and Agri-Food Canada in collaboration with Statistics Canada's Agriculture Division, have developed a process for interpolating (reallocating or proportioning) Census of Agriculture information from census polygon-based units to biophysical polygon-based units. In the “Interpolated census of agriculture”, suppression confidentiality procedures were applied by Statistics Canada to the custom tabulations to prevent the possibility of associating statistical data with any specific identifiable agricultural operation or individual. Confidentiality flags are denoted where "-1" appears in data cell. This indicates information has been suppressed by Statistics Canada to protect confidentiality. Null values/cells simply indicate no data is reported.
-

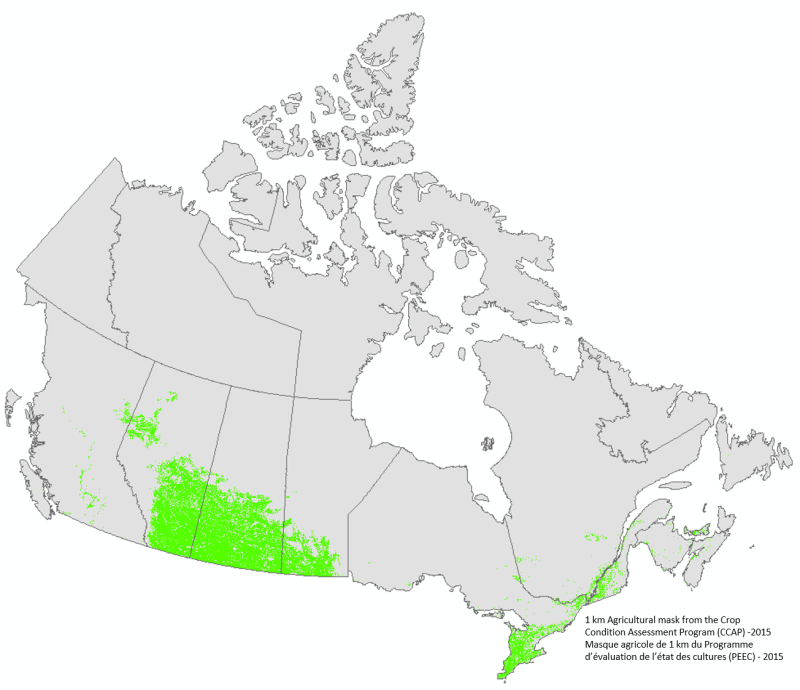
The following dataset correspond to the 1 km agricultural mask from Statistics Canada’s Crop Condition Assessment Program (CCAP). The mask have been generated from the classes 110 to 199 of the 2015 Agriculture and Agri-Food Canada’s landcover classification. The selection was then generalized to a spatial resolution of 1 km. The 2015 mask was used from the 2015 to the 2018 growing seasons inclusively.
-

The cloud-corrected NDVI data extracted from historical MODIS satellite images at 250 metre resolution provides reliable, objective, and timely information on the state of vegetation throughout Canada and the northern United States. The methodology applied to the images has remained the same as for the program formerly known as the Crop Condition Assessment Program (CCAP). Since the 2000 growing season, Statistics Canada has been processing and compiling MODerate-resolution Imaging Spectoradiometer (MODIS) data (250 metre resolution). The Multi-Spectral Instrument (MSI) captures two spectral bands (red and infrared) that have proven to be extremely useful to produce the Normalized Difference Vegetation Index (NDVI) utilized for vegetation monitoring. The original NDVI image composites were produced by Agriculture and Agri-Food Canada (link to original data in the resources section). Additional computations were completed by Statistics Canada to remove the effects of residual clouds and to calculate and extract the NDVI by geographic region. This dataset provides access to the MODIS images from 2000 to present in GeoTIFF format and covers the crop area during the growing season (Julian weeks 15 to 37; mid-April to mid-September). It also provides access to a database that contains the statistical NDVI by geographic regions (Townships, Census Consolidated Subdivisions (CCS), Census Divisions (CD) and Census Agricultural Regions (CAR)) and agricultural masks (Agriculture (AGR), Crop (CROP) and Pasture (PAS)).
-

In 2015, the Earth Observation Team of the Science and Technology Branch (STB) at Agriculture and Agri-Food Canada (AAFC) repeated the process of generating annual crop inventory digital maps using satellite imagery to for all of Canada, in support of a national crop inventory. A Decision Tree (DT) based methodology was applied using optical (Landsat-8) and radar (RADARSAT-2) based satellite images, and having a final spatial resolution of 30m. In conjunction with satellite acquisitions, ground-truth information was provided by provincial crop insurance companies and point observations from the BC Ministry of Agriculture and our regional AAFC colleagues.
 Arctic SDI catalogue