 Arctic SDI catalogue
Land Cover
Type of resources
Available actions
Topics
Keywords
Contact for the resource
Provided by
Years
Formats
Representation types
Update frequencies
status
Service types
Scale
-
NLCD 1992, NLCD 2001, NLCD 2006, and NLCD 2011 are National Land Cover Database classification schemes based primarily on Landsat data along with ancillary data sources, such as topography, census and agricultural statistics, soil characteristics, wetlands, and other land cover maps. NLCD 1992 is a 21-class land cover classification scheme that has been applied consistently across the conterminous U.S. at a spatial resolution of 30 meters. NLCD 2001 is a 16-class land cover classification scheme that also has been applied to the conterminous U.S. at a spatial resolution of 30 meters, and includes Alaska, Hawaii, and Puerto Rico. NLCD 2006 quantifies land cover change for the conterminous U.S. between the years 2001 to 2006. Generation of NLCD 2006 helped identify and correct issues in the NLCD 2001 land cover and impervious surface products only, and no changes were made to the NLCD 2001 canopy product. For additional information, go to http://www.mrlc.gov/. See http://viewer.nationalmap.gov/help for assistance with The National Map viewer, services, or metadata.
-

Riparian zones represent transitional areas occurring between land and freshwater ecosystems, characterised by distinctive hydrology, soil and biotic conditions and strongly influenced by the stream water. They provide a wide range of riparian functions (e.g. chemical filtration, flood control, bank stabilization, aquatic life and riparian wildlife support, etc.) and ecosystem services. The Riparian Zones products will support the objectives of several European legal acts and policy initiatives, such as the EU Biodiversity Strategy to 2020, the Habitats and Birds Directives and the Water Framework Directive. Land Cover/Land Use (LC/LU) classification is tailored to the needs of biodiversity monitoring in a tailored buffer zone along large and medium-sized European rivers (with Strahler levels 3-8 derived from EU-Hydro). LC/LU is extracted from VHR satellite data and other available data in a buffer zone of selected rivers. The classes follow the pre-defined nomenclature on the basis of MAES typology of ecosystems (Level 1 to Level 4) and Corine Land Cover, providing 80 distinct thematic classes with a Minimum Mapping Unit (MMU) of 0.5 ha and a Minimum Mapping Width (MMW) of 10 m. The production of the Riparian Zones products was coordinated by the European Environment Agency in the frame of the EU Copernicus programme.
-
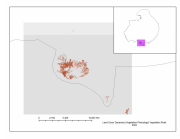
The Land Cover Dynamics MODIS product is a yearly product that represents thetiming of vegetation phenology globally. Sub-datasets include vegetation growth, maturity,senescence, and dormancy. This product also includes the NBAR-(Nadir Bidirectionalreflectance distribution function (BRDF) adjusted Reflectance) based EVI, in part becausethe EVI is used to create the Land Cover Dynamics. The Land Cover Dynamics product uses both Terra and Aqua MODIS data. Version005 (provided) has a 500 m spatial resolution, which is an improvement from the 1,000 mversion 004 product. This product is only available in MODIS tiles, so the tiles needed tocover the CAFF pan-Arctic region has been downloaded but not clipped to the pan-Arcticextent at this time.
-

Land cover information is essential for a wide range of environmental applications, including climate impact assessment and adaptation, emergency response, and wildlife habitat monitoring. In Canada, a 2008 user survey identified that the most practical format for land cover data is a nationwide map with a 30 m spatial resolution, updated every five years. To meet this need, the Canada Centre for Remote Sensing (CCRS) has been producing 30 m resolution land cover maps since 2010, with updates released in 2015 and 2020. These datasets also serve as Canada’s contribution to the 30 m Land Cover Map of North America, developed collaboratively by government agencies in Mexico, the United States, and Canada through the North American Land Change Monitoring System (NALCMS). The classification system used in these maps is designed for consistency across North America. It follows a two-level hierarchy based on the Food and Agriculture Organization (FAO) Land Cover Classification System (LCCS), consisting of 12 classes at Level I and 19 classes at Level II. Of the 19 Level II classes, 15 are applicable to Canada and are included in the national land cover dataset. Tropical vegetation classes (specifically classes 3, 4, 7, and 9) are either absent or occur only minimally in Canada and are therefore excluded from the national dataset. Canada’s land cover maps are generated using observations from the Operational Land Imager (OLI) Landsat sensor. An accuracy assessment based on 832 randomly distributed samples indicates that the latest dataset achieves 86.9% overall accuracy, with no marked spatial inconsistencies. - [Land Cover of Canada - Cartographic Product Collection](https://open.canada.ca/data/en/dataset/11990a35-912e-4002-b197-d57dd88836d7) - [NALCMS — The North American Land Change Monitoring System](https://www.cec.org/publications/nalcms/)
-

Land cover information is necessary for a large range of environmental applications related to climate impacts and adaption, emergency response, wildlife habitat, etc. In Canada, a 2008 user survey indicated that the most practical land cover data is provided in a nationwide 30 m spatial resolution format, with an update frequency of five years. In response to this need, the Canada Centre for Remote Sensing (CCRS) has generated a 30 m land cover map of Canada for the base year 2010, as the first of a planned series of maps to be updated every five years, or more frequently. This land cover dataset is also the Canadian contribution to the 30 m spatial resolution 2010 Land Cover Map of North America, which is produced by Mexican, American and Canadian government institutions under a collaboration called the North American Land Change Monitoring System (NALCMS). This land cover dataset for Canada is produced using observation from Thematic Mapper (TM) and Enhanced Thematic Mapper (ETM+) Landsat sensors. An accuracy assessment based on 2811 randomly distributed samples shows that land cover data produced with this new approach has achieved 76.60% accuracy with no marked spatial disparities. - [Land Cover of Canada - Cartographic Product Collection](https://open.canada.ca/data/en/dataset/11990a35-912e-4002-b197-d57dd88836d7)
-
Collection of Land Cover products for Canada as produced by Natural Resources Canada using Landsat satellite imagery. This collection of cartographic products offers classified Land Cover of Canada at a 30 metre scale, updated on a 5 year basis. - [Landcover of Canada 2010](https://open.canada.ca/data/en/dataset/c688b87f-e85f-4842-b0e1-a8f79ebf1133) - [Landcover of Canada 2015](https://open.canada.ca/data/en/dataset/4e615eae-b90c-420b-adee-2ca35896caf6) - [Landcover of Canada 2020](https://open.canada.ca/data/en/dataset/ee1580ab-a23d-4f86-a09b-79763677eb47)
-

The European Urban Atlas provides reliable, inter-comparable, high-resolution land use and land cover data for 800 Functional Urban Area (FUA) for the 2012 reference year in EEA39 countries. The spatial data can be downloaded together with a map for each FUA covered and a report with the metadata for the respective area. Additional information (product description, mapping guidance and class description) can be found here: https://land.copernicus.eu/user-corner/technical-library/urban-atlas-2012-mapping-guide-new Commission Directorate-General for Regional and Urban Policy and the Directorate-General for Enterprise and Industry in the frame of the EU Copernicus programme, with the support of the European Space Agency and the European Environment Agency.
-
Land cover information is necessary for a large range of environmental applications related to climate impacts and adaption, emergency response, wildlife habitat, etc. In Canada, a 2008 user survey indicated that the most practical land cover data is provided in a nationwide 30 m spatial resolution format, with an update frequency of five years. In response to this need, the Canada Centre for Remote Sensing (CCRS) has generated a 30 m land cover map of Canada for the base year 2010, as well as this 2015 land cover map. This land cover dataset is also the Canadian contribution to the 30 m spatial resolution 2015 Land Cover Map of North America, which is produced by Mexican, American and Canadian government institutions under a collaboration called the North American Land Change Monitoring System (NALCMS). This land cover dataset for Canada is produced using observation from Operational Land Imager (OLI) Landsat sensor. An accuracy assessment based on 806 randomly distributed samples shows that land cover data produced with this new approach has achieved 79.90% accuracy with no marked spatial disparities. - [Land Cover of Canada - Cartographic Product Collection](https://open.canada.ca/data/en/dataset/11990a35-912e-4002-b197-d57dd88836d7)
-
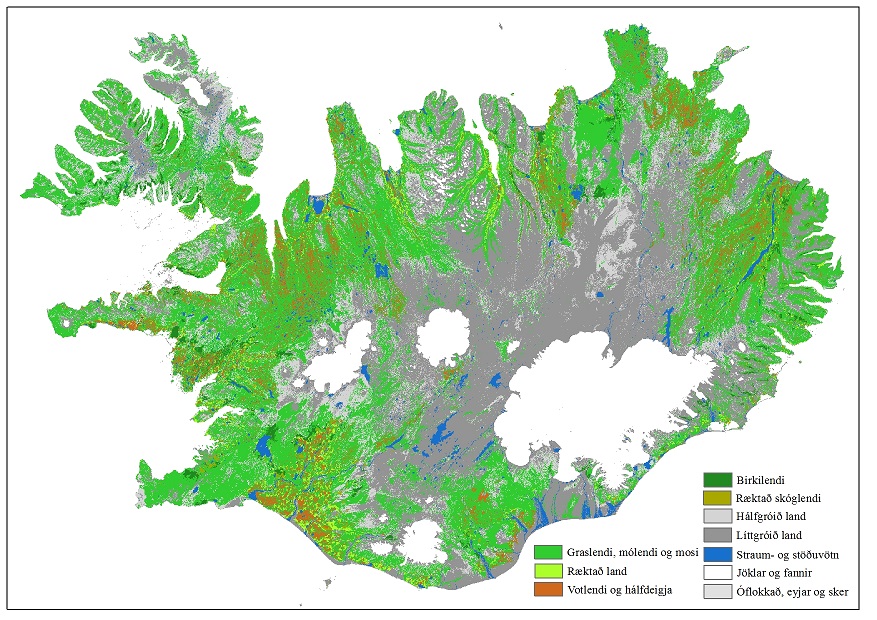
Nytjaland er verkefni sem miðaði að því að kortleggja yfirborð landsins, m.t.t. hversu grósku mikið það væri. Flokkunun var unnin með fjarkönnunaraðferðum á grunni Landsat 7 og SPOT 5 gervitunglamynda. Verkefnið var unnið á árunum 1999-2007. Var þá búið að gera yfirborðsflokkun á um 70% landsins í 12 flokka og 30% af yfirborðinu í 6 flokka. Nytjaland_N8 er einfölduð mynd af Nytjalandsgögnunum þar sem 12 flokka gögnin hafa verið aðlöguð að 6 flokka gögnunum. Flokkarnir graslendi, mólendi, rýrt mólendi og mosi (úr 12 flokka gögnunum) voru sameinaðir í einn flokk „Graslendi“. Inn í flokkuðu myndina Nytjaland_N8 hefur verið bætt gögnum Skógræktar ríkisins (2013) um "Náttúrulegt birkilendi“ og „Ræktaðan skóg". Flokkurinn ræktað land var hnitaður inn af gervitunglamyndum og var settur í rastagrunninn. Ár, vötn, jöklar og strandlína var samræmt vatnafarsgrunni LMÍ 2013. Viðmiðunarmælikvarði 1:30000
-

This group of maps, which includes the CanMatrix and CanTopo collections, is now a legacy product that is no longer maintained. It may not meet current government standards. Natural Resources Canada's (NRCan) topographic raster maps provide a representation of the topographic phenomena of the Canadian landmass. Several editions of paper maps have been produced over time in order to offer improved products compared to their predecessors in terms of quality and the most up to date information possible. The georeferenced maps can be used in a Geographic Information System (GIS). In all cases, they accurately represent the topographical data available for the date indicated (validity date). The combination of CanMatrix and CanTopo data provides complete national coverage. • CanMatrix - Print Ready: Raster maps produced by scanning topographic maps at scales from 1:25 000 to 1:1 000 000. This product is not georeferenced. Validity dates: 1944 to 2005 (1980 on average). Available formats: PDF and TIFF • CanMatrix - Georeferenced: Raster maps produced by scanning topographic maps at scales of 1:50 000 and 1:250 000. These maps are georeferenced according to the 1983 North American Reference System (NAD 83). Validity dates: 1944 to 2005 (1980 on average). Available format: GeoTIFF • CanTopo: Digital raster maps produced mainly from the GeoBase initiative, NRCan digital topographic data, and other sources. Approximately 2,234 datasets (maps) at scale of 1:50 000, primarily covering northern Canada, are available. CanTopo datasets in GeoPDF and GeoTIFF format are georeferenced according to the 1983 North American Reference System (NAD 83). Validity dates: 1946 to 2012 (2007 on average). Available formats: PDF, GeoPDF, TIFF and GeoTIFF