 Arctic SDI catalogue
Occurence
Type of resources
Topics
Keywords
Contact for the resource
Provided by
Formats
Representation types
Update frequencies
status
-

## #Mise in custody and data use limits: * ** The report by Lesmerises and St-Laurent (2018) must be cited when using this file (see Literature section) . ** * The distribution area of the mountain caribou population in Gaspésie in this file represents the state of knowledge on the use of land by mountain caribou between 1988 and 2016. * Information on the distribution of the local population does not make it possible to establish with certainty that caribou are absent in territories outside this range. * The range is subject to change, depending on new telemetry data that will be acquired, as our local knowledge is refined, and as caribou land use patterns change. ## #Description of the distribution area of the local woodland caribou population, mountain ecotype, Gaspésie population The data represent the distribution area of woodland caribou, mountain ecotype, population of Gaspésie (hereinafter mountain caribou of Gaspésie). The file contains the polygon and the name assigned to the population, the period covered by the telemetry data used during the delimitation exercise, and the date of the last update. The information contained in the file of occurrences of species in a precarious situation of the Quebec Natural Heritage Data Center (CDPNQ) is also present in the file (CDPNQ occurrence number, French, English and scientific name of the species, the type of occurrence, the rank of precariousness (rank S) and the status under the Act Respecting Threatened or Vulnerable Species, see MELCCFP 2023 for a description of these fields.). ## #Contexte of the publication The Ministry of the Environment, the Fight against Climate Change, Wildlife and Parks (hereinafter MELCCFP) is responsible for the monitoring and management of mountain caribou in Gaspésie (Government of Quebec, 2021 a, b). The local population has been identified as the appropriate monitoring and management scale for this species since each population may face different threats depending on the habitat and socio-economic context in which it is found (Environment Canada, 2008). The local population is defined as a group of caribou occupying a defined territory that is spatially distinct from the territories occupied by other caribou groups. The dynamics of the local population are determined primarily by local factors influencing birth and mortality rates, rather than by the contributions or losses resulting from immigration or emigration between groups. As a result, the distribution area of the local population of mountain caribou in Gaspésie is defined as the geographic area where a group of individuals exposed to similar factors influencing their demographics live and which meets the needs of their life cycle during a given period of time (e.g. calving, rutting, wintering). In 2018, Lesmerises and St-Laurent produced the report *Influence of the rate of habitat disturbance, regional coyote abundance, and predator control on the demographic parameters of the Gaspesia-Atlantic caribou population* report presented to the Canadian Wildlife Service (Environment Canada). One of the objectives of the report was to delineate the range of this population. The MELCCFP uses the distribution area delimited by Lesmerises and St-Laurent (2018) as part of the monitoring and management of mountain caribou in Gaspésie. For any questions related to the Lesmerises and St-Laurent report (2018), please contact Mr. St-Laurent ([Martin-hugues_St-laurent@uqar.ca] (mailto: Martin-hugues_St-laurent@uqar.ca)). ## #Méthodologie in a nutshell The methodology presented here is a summary of that described in Lesmerises and St-Laurent (2018). Telemetry data from three follow-ups carried out during different periods of time were used (1988-1991, 1998-2008 and 2013-2016). The caribou were equipped with VHF collars during the first two follow-ups. Aerial flights were carried out at various times in order to locate the caribou. During the follow-up from 2013 to 2016, the caribou were equipped with GPS/Argos collars programmed to acquire locations every 2 or 3 hours depending on the collar model used. The range of the mountain caribou population in Gaspésie was defined by estimating a minimum convex polygon comprising 99% of telemetry locations plus a 10 km buffer zone. Finally, the parts superimposed on the St. Lawrence River were removed. ## #Littérature Environment Canada. 2008. Scientific review for the identification of critical habitat for the boreal population of woodland caribou (*Rangifer tarandus caribou*) in Canada. August 2008. Ottawa: Environment Canada. 80 pp. + 192 pp. appendices. Government of Quebec. 2021 a. Monitoring system for forest caribou populations in Quebec and mountain caribou in Gaspésie 2020-2031: summary document, Ministry of Forests, Wildlife and Parks, Directorate of Expertise on Terrestrial Wildlife, Herpetofauna and Avifauna, 16 pp. Government of Quebec. 2021 b. Literature review on the factors involved in the decline of forest caribou populations in Quebec and mountain caribou in Gaspésie, Ministère des Forêts, de la Faune et des Parcs, Direction of expertise on terrestrial fauna, herpetofauna and avifauna, 244 pp. + 15p. appendices Lesmerises, F. and M.-H. St-Laurent. 2018. Influence of the rate of habitat disturbance, regional coyote abundance, and predator control on the demographic parameters of the caribou population in Gaspesia-Atlantique. Scientific report submitted to Environment Canada — Canadian Wildlife Service, Rimouski (Quebec). 22 pp. + 8 appendices. Ministry of the Environment, the Fight against Climate Change, Wildlife and Parks (MELCCFP). 2023. The Quebec Natural Heritage Data Center — Information document, Government of Quebec, Quebec, 32 pp.**This third party metadata element was translated using an automated translation tool (Amazon Translate).**
-
## #Description of the distribution areas of local populations of woodland caribou, forest ecotype, in Quebec The data represent the distribution areas of 13 local populations and two areas of knowledge acquisition for woodland caribou, a forest ecotype in Quebec (hereinafter forest caribou). The file contains the polygons and the name assigned to each population or knowledge acquisition sector, the period covered by the telemetry data used during the delimitation exercise, and the date these boundaries were last updated. The information contained in the file of occurrences of species in a precarious situation of the Quebec Natural Heritage Data Center (CDPNQ) is also present in the file (CDPNQ occurrence number, French, English and scientific name of the species, the type of occurrence, the rank of precariousness [rank S] and the status under the Act Respecting Threatened or Vulnerable Species, see MELCCFP 2023 for a description of these fields.). ## #Contexte The Ministry of the Environment, the Fight against Climate Change, Wildlife and Parks (hereinafter MELCCFP) is responsible for the monitoring and management of forest caribou in Quebec (Government of Quebec, 2021 a). In 2017-2018, the MELCCFP improved its monitoring activities in order to obtain an accurate and up-to-date portrait of the situation of the various populations on its territory (see [Literature review on the factors involved in the decline of caribou populations in Quebec, Government of Quebec] (https://consultation.quebec.ca/rails/active_storage/blobs/eyJfcmFpbHMiOnsibWVzc2FnZSI6IkJBaHBjZz09IiwiZXhwIjpudWxsLCJwdXIiOiJibG9iX2lkIn19--45f10ff67d1f9e80ca714b08f984b5965760abd3/RevueLitterature_CaribouVF.pdf), 2021 b). The local population has been identified as the appropriate monitoring and management scale for this species since each population may face different threats depending on the habitat and socio-economic context in which it is found (Environment Canada, 2008). It is within this framework that the work to identify and delimit the distribution areas of forest caribou populations carried out in 2021-2022 is part of. The local population is defined as a group of caribou occupying a defined territory that is spatially distinct from the territories occupied by other caribou groups. The dynamics of the local population are determined primarily by local factors influencing birth and mortality rates, rather than by the contributions or losses resulting from immigration or emigration between groups. Therefore, the ranges of local forest caribou populations in this file are defined as the geographic area where a group of individuals exposed to similar factors influencing their demographics live and which meets the needs of their life cycle over a given period of time (e.g. calving, rutting, wintering). Note that for the two knowledge acquisition sectors, Baie-James and Matamec, the number of caribou monitored and the temporal scale of monitoring do not allow to date clearly conclude that they are distinct local populations or to associate these caribou with an adjacent population. ## #Méthodologie in a nutshell The forest caribou populations in Charlevoix and Val-d'Or were excluded from the following manipulations, as their geographic isolation is sufficient to demonstrate that they are local populations distinct from other caribou groups. A minimal convex polygon was made using 100% of telemetry data from 2004-2012 and 2017-2021 for the population of Charlevoix and from 1986 to 2020 for that of Val-d'Or. For other forest caribou populations, telemetry data from collars placed on caribou by the MELCCFP and various partners (Université Laval, Université du Québec à Rimouski, Hydro-Québec, Government of Ontario and Government of Ontario and Government of Newfoundland and Labrador) were used to identify and delimit the distribution areas of local populations. The data ranges from 2001 to 2021, but the period covered by the data varies by sector of study (see field: Layer tempo for information). Forest caribou populations in Quebec were identified by assigning caribou monitored by telemetry to a population using the fuzzy classification method (*c-mean fuzzy clustering*; Schaefer et al., 2001; Schaefer et al., 2001; Schaefer and Wilson, 2002). This method aims to unite individuals into groups in order to maximize the distance between members of distinct groups and to minimize the distance between members of the same group. Centroids from individual home ranges were used in this analysis. The ranges were delineated by creating minimal convex polygons including 100% of caribou locations (100% MCP) assigned to a population. For the Baie-James sector, the area was delimited by removing the overlaps between the area inventoried in 2020 (Szor and Gingras, 2020) and the distribution areas of the surrounding local populations. For the Matamec sector, the area represents the non-overlap between the distribution area of the local population of the Lower North Shore and a minimum convex polygon encompassing all telemetry data for caribou in the Matamec sector and the local Lower North Shore population. The acquisition of knowledge on the distribution of caribou and the presence of distinct populations continues in the Baie-James sector (Nord-du-Québec) and the Matamec sector (Côte-Nord). The last update was made in 2021-2022. ## #Mise in custody and data use limits: * The distribution areas of forest caribou populations in Quebec in this file represent the state of knowledge on the use of land by caribou between 2001 and 2021. * Information on the ranges of local populations does not make it possible to establish with certainty that caribou are absent in territories outside the ranges. * Distribution areas represent areas where caribou belonging to the same population are likely to be found. They do not make it possible to identify the sectors used more or less strongly by caribou in this population or the sectors used by caribou to move within the range or from one population to another (connectivity sectors). * The ranges are subject to change, depending on the new telemetry data that will be acquired, the refinement of our local knowledge and the changes in the patterns of land use by caribou. ## #Littérature Environment Canada. 2008. Scientific review for the identification of critical habitat for the boreal population of woodland caribou (*Rangifer tarandus caribou*) in Canada. August 2008. Ottawa: Environment Canada. 80 pp. + 192 pp. appendices Government of Quebec. 2021 a. Monitoring system for forest caribou populations in Quebec and mountain caribou in Gaspésie 2020-2031: summary document, Ministry of Forests, Wildlife and Parks, Directorate of Expertise on Terrestrial Wildlife, Herpetofauna and Avifauna, 16 pp. Government of Quebec. 2021 b. Literature review on the factors involved in the decline of forest caribou populations in Quebec and mountain caribou in Gaspésie, Ministère des Forêts, de la Faune et des Parcs, Direction of expertise on terrestrial fauna, herpetofauna and avifauna, 244 pp. + 15p. appendices Ministry of the Environment, the Fight against Climate Change, Wildlife and Parks (MELCCFP). 2023. The Quebec Natural Heritage Data Center — Information document, Government of Quebec, Quebec, 32 pp. Schaefer, J.A., Veitch, A.M., Harrington, F.H., Harrington, F.H., Brown, W.K., Theberge, J.B., & Luttich, S.N. 2001. Fuzzy structure and spatial dynamics of a declining woodland caribou population. *Oecologia*, 126 (4), 507—514. https://doi.org/10.1007/s004420000555 Schaefer, J.A., & Wilson, C.C. 2002. The fuzzy structure of populations. *Canadian Journal of Zoology*, 80 (12), 2235—2241. https://doi.org/10.1139/z02-184 Szor, G and G. Gingras. 2020. Aerial inventory of forest caribou (*Rangifer tarandus caribou*) in the James Bay, Rupert and La Grande sectors, Nord-du-Québec, in winter 2020, Ministry of Forests, Wildlife and Parks, Direction de la gestion de la fauna du Nord-du-Québec, 31 p. **This third party metadata element was translated using an automated translation tool (Amazon Translate).**
-
## Information document concerning the results of the threat analysis This document provides additional information to better understand and use the threat data produced as part of the integrated recovery approach. This data highlights the sectors where the impacts of threats on occurrences listed by the [Quebec Natural Heritage Data Center (CDPNQ)] (https://www.quebec.ca/gouvernement/gouvernement-ouvert/transparence-performance/indicateurs-statistiques/donnees-especes-situation-precaire) are the most important. # #Quelles data included in the analyses? The analyses focus on the following 67 elements (wildlife species): * Amphibians: swamp frog, boreal chorus frog, western chorus frog, western chorus frog, purple salamander, Adirondack and Appalachian pop., mountain dusky salamander, mountain dusky salamander, mountain dusky salamander, mountain dusky salamander, mountain dusky salamander, mountain dusky salamander, mountain dusky salamander, mountain dusky salamander, mountain dusky salamander, mountain dusky salamander, mountain dusky salamander, mountain dusky salamander, mountain dusky salamander, mountain dusky salamander, mountain dusky salamander, mountain * Insects: satyr tawny from the Maritimes * Mammals: pygmy weasel, rock vole, forest vole, forest vole, forest vole, Cooper lemming vole, northern bat, eastern pygmy bat, Gaspé shrew, longicaude shrew, longicaude shrew, little flying squirrel, little flying squirrel, pop. of the plains of the Great Lakes, small brown bat, eastern pipistrelle * Birds: golden eagle, diving harlequin, eastern pop., eastern pop., bunting grasshopper pratensis, Pratensis, grasshopper, rufa, peregrine falcon, Anatum/tundrius, Iceland tourniquet, eastern pop., eastern pop., eastern pop., Bicknell's thrush, Bicknell's thrush, horned grebe, black tern, short-eared owl, shore swallow, chimney swift, eastern pop., eastern pop., Bicknell's thrush, thrush of Bicknell, thrush, horned grebe, black tern, short-eared owl, shore swallow, chimney swift, eastern pop. White-tailed Plover, Cerulean Warbler, Golden-winged Warbler, Golden-winged Warbler, Lesser Bittern, Melodus Piping Plover, Bald Eagle, Yellow Rail, Yellow Rail, Roseate Tern * Fish: savory shad, mesh pike, vermiculated pike, vermiculated pike, crazy cat-rapids, copper redhorse, river redhorse, northern crappy, sand stinger, lake sturgeon, black sturgeon, black sturgeon, black sturgeon, black sturgeon, Atlantic sturgeon, Atlantic sturgeon, black sturgeon, Atlantic sturgeon, black sturgeon, Atlantic sturgeon, black sturgeon, Atlantic sturgeon, Atlantic sturgeon, black sturgeon, gray rock digger, rock darter, northern lamprey, northern lamprey, grass minnow, brass minnow, oquassa arctic char, rainbow smelt, southern pop. of St. Lawrence Estuary * Reptiles: brown snake, northern water snake, northern ribbonsnake, northern ribbonsnake, spotted snake, green snake, northern collared snake, wood turtle, geographic turtle, geographic turtle, speckled turtle, speckled turtle, musky turtle, spiny softshell turtle Other species, including floristic species, could be added to the analyses. Threats: Threats are activities that, by their location, intensity, or time in which they occur, generate stress (see next section) that affects elements of biodiversity. In total, the available data concerns 16 threats: * Future conversion risk: Development of residential, industrial and commercial areas; * Ski resorts; * Future conversion risk: Annual agriculture (field crops); * Sustainable agriculture; * Quarries and sandpits; * Roads; * Total removal of forest cover; * Partial removal of forest cover; * Educational treatments; * Motorized vehicles; * Boating; * Drainage in agricultural areas; * Phragmites australis; * Rhamnus cathartica; * Increase in predation by mesopredators; * Nutrient load. # #Méthode for calculating the impact rating * The method used to calculate the impact score is presented in the document Integrated Recovery Approach for Threatened or Vulnerable Species — Development of a New Tool for Conservation Planning. * The results are presented using a map grid in which each 10 km x 10 km plot shows the cumulative impact of a threat on the occurrences present in this portion of territory. The cumulative impact is obtained by adding up the impact ratings of all the occurrences present within the plot. This accumulation makes it possible to identify, using a color code, the “hot spots” of a threat on occurrences. The absence of color indicates the absence of calculated or listed impacts on occurrences. The color gradient illustrates the variation in the cumulative impact of this threat on all occurrences in the plot, from the lowest score (yellow) to the highest (red). * Each threat is presented on a separate layer, while an additional layer called “Threat Compilation” shows the sum of the threats over all the occurrences present in a plot. # #Quelle is standardized classification used for analysis? The threats analyzed were defined according to the document Standardized Classification of Threats Affecting Biodiversity — Definitions for the Quebec Conservation Data Center (CDC) v1.0, published in 2021.**This third party metadata element was translated using an automated translation tool (Amazon Translate).**
-

Spatial distribution of the relative occurrence of northern wolffish in the annual DFO groundfish research surveys conducted by the Québec (1978-2008) and Gulf (1971-2008) regions. Catch and effort data were aggregated by 100 km² cells. The probability of catching an northern wolffish in a set and within a cell (relative occurrence) was calculated as the ratio of the number of sets in which a species was recorded and the total number of sets made. This method allows the mapping of catch and effort for numerous time series based on data from different programs in both the whole study area (research surveys and Sentinel Fisheries using bottom trawls and a random stratified design) or in specific areas within the Gulf. Source: Dutil, J.-D., S. Proulx, S. Hurtubise, and J. Gauthier 2011. Recent findings on the life history and catches of wolffish (Anarhichas sp.) in research surveys and in the Sentinel Fisheries and Observer Program for the Estuary and Gulf of St-Lawrence. DFO Can. Sci. Advis. Sec. Res. Doc. 2010/126: x + 71 pages. Associated publication: Dutil, J.-D., Proulx, S., Chouinard, P.-M., and Borcard, D. 2011. A hierarchical classification of the seabed based on physiographic and oceanographic features in the St. Lawrence. Can. Tech. Rep. Fish. Aquat. Sci. 2916: vii + 72 pages. http:/ / www.dfo-mpo.gc.ca/ Library/ 342703.pdf.
-

Spatial distribution of the relative occurrence of Atlantic Wolffish in the annual DFO groundfish research surveys conducted by the Québec (1978-2008) and Gulf (1971-2008) regions. Catch and effort data were aggregated by 100 km² cells. The probability of catching an Atlantic Wolffish in a set and within a cell (relative occurrence) was calculated as the ratio of the number of sets in which a species was recorded and the total number of sets made. This method allows the mapping of catch and effort for numerous time series based on data from different programs in both the whole study area (research surveys and Sentinel Fisheries using bottom trawls and a random stratified design) or in specific areas within the Gulf. Source: Dutil, J.-D., S. Proulx, S. Hurtubise, and J. Gauthier 2011. Recent findings on the life history and catches of wolffish (Anarhichas sp.) in research surveys and in the Sentinel Fisheries and Observer Program for the Estuary and Gulf of St-Lawrence. DFO Can. Sci. Advis. Sec. Res. Doc. 2010/126: x + 71 pages. Associated publication: Dutil, J.-D., Proulx, S., Chouinard, P.-M., and Borcard, D. 2011. A hierarchical classification of the seabed based on physiographic and oceanographic features in the St. Lawrence. Can. Tech. Rep. Fish. Aquat. Sci. 2916: vii + 72 pages. http:/ / www.dfo-mpo.gc.ca/ Library/ 342703.pdf.
-

Spatial distribution of the relative occurrence of Spotted Wolffish in the annual DFO groundfish research surveys conducted by the Québec (1978-2008) and Gulf (1971-2008) regions. Catch and effort data were aggregated by 100 km² cells. The probability of catching an Spotted Wolffish in a set and within a cell (relative occurrence) was calculated as the ratio of the number of sets in which a species was recorded and the total number of sets made. This method allows the mapping of catch and effort for numerous time series based on data from different programs in both the whole study area (research surveys and Sentinel Fisheries using bottom trawls and a random stratified design) or in specific areas within the Gulf. Source: Dutil, J.-D., S. Proulx, S. Hurtubise, and J. Gauthier 2011. Recent findings on the life history and catches of wolffish (Anarhichas sp.) in research surveys and in the Sentinel Fisheries and Observer Program for the Estuary and Gulf of St-Lawrence. DFO Can. Sci. Advis. Sec. Res. Doc. 2010/126: x + 71 pages. Associated publication: Dutil, J.-D., Proulx, S., Chouinard, P.-M., and Borcard, D. 2011. A hierarchical classification of the seabed based on physiographic and oceanographic features in the St. Lawrence. Can. Tech. Rep. Fish. Aquat. Sci. 2916: vii + 72 pages. http:/ / www.dfo-mpo.gc.ca/ Library/ 342703.pdf.
-
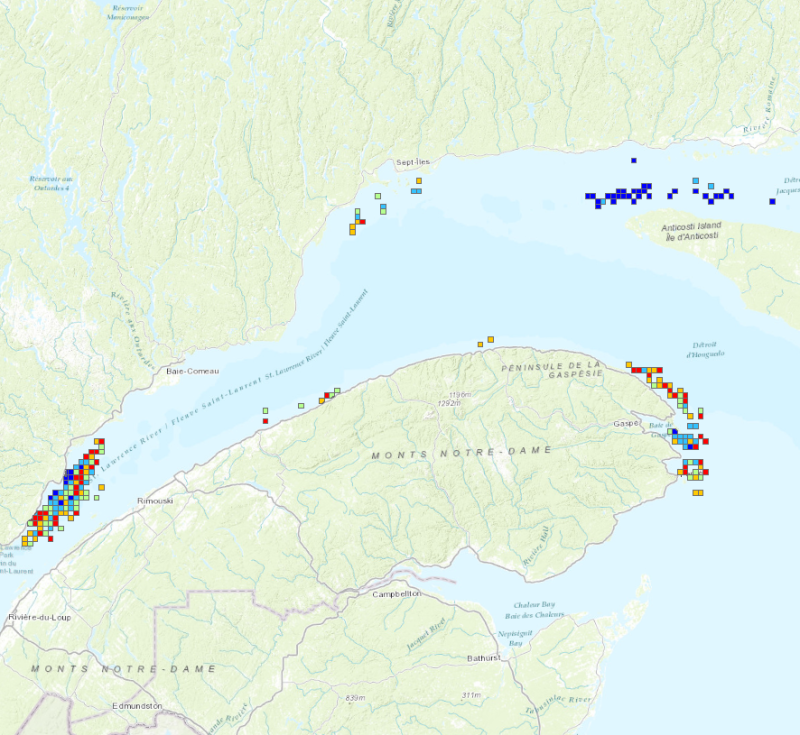
Sightings data were collected by the Mingan Island Cetacean Study (MICS) from 1980 to 2008 with annual surveys realised in the Gulf of St. Lawrence between the end of may and early november. Surveys were conducted using inflatable boats enabling the close approaches necessary to photograph and biopsy blue whales. The aim of this project was to provide additional information for designating blue whale critical habitat as required under the Canadian Species at Risk Act. For more details consult the following report: Ramp, C. and Sears, R. 2013. Distribution, densities, and annual occurrence of individual blue whales (Balaenoptera musculus) in the Gulf of St. Lawrence, Canada from 1980-2008. DFO Can. Sci. Advis. Sec. Res. Doc. 2012/157. vii + 37 p. http://www.dfo-mpo.gc.ca/csas-sccs/Publications/ResDocs-DocRech/2012/2012_157-eng.html Data of blue whale sightings, collected by the MICS, have been analysed per km of effort in 3 x 3 km grid cells in the Gulf of St. Lawrence for the 2000-2008 period.
-
Layers that present various important parameters such as inventories, presence, sightings, distribution, relative occurrence or catch rates, critical habitat, breeding and feeding areas, potential spawning and haul-out sites for the different species with status under the Species at Risk Act (SARA). The act classifies those species as being either extirpated, endangered, threatened, or of special concern. Under SARA, Fisheries and Oceans Canada must produce recovery strategies and action plans for aquatic species listed as endangered or threatened. The act is part of Canada’s strategy to protect hundreds of wild plants and animal species from becoming extinct, and to help in their recovery. The different species represented by the layers are the following: 1. American shad (Alosa sapidissima) 2. Atlantic sturgeon (Acipenser oxyrinchus) 3. Atlantic wolffish (Anarhichas lupus) 4. Beluga whale (Delphinapterus leucas) 5. Blue whale (Balaenoptera musculus) 6. Copper redhorse (Moxostoma hubbsi) 7. Eelgrass (Zostera marina) 8. Grey seal (Halichoerus grypus) 9. Harbor seal (Phoca vitulina) 10. Humpback whale (Megaptera novaeangliae) 11. Lake sturgeon (Acipenser fulvescens) 12. Lumpfish (Cyclopterus lumpus) 13. Northern wolffish (Anarhichas denticulatus) 14. Rainbow smelt (Osmerus mordax) 15. Sea pens (Pennatulacea) 16. Seaweed 17. Smooth skate (Malacoraja senta) 18. Sponges 19. Spotted wolffish (Anarhichas minor) 20. Striped bass (Morone saxatilis) 21. Thorny skate (Amblyraja radiata) 22. Winter skate (Leucoraja ocellata)