 Arctic SDI catalogue
Habitat
Type of resources
Topics
Keywords
Contact for the resource
Provided by
Years
Formats
Representation types
Update frequencies
status
Service types
-
Distribution of natural habitat types of community interest is a product of species and habitat surveillance under the obligations of Article 17 of EU Habitats Directive (92/43/ EEC). The natural habitat type grid distribution (EEA reference grid 1 x 1 km) from data of habitat reports 2013 is presented. For detailed description and commentary see CHOBOT, K. (ed.) (2016). Druhy a přírodní stanoviště: Hodnotící zprávy o stavu v České republice. Praha: Agentura ochrany přírody a krajiny ČR a Ministerstvo životního prostředí. 226 s. ISBN 978-80-88076-20-9. Habitat classification and national interpretation manual see CHYTRÝ, M.; KUČERA, T.; KOČÍ, M. (eds.) et al. (2010). Katalog biotopů České republiky. 2.upr. a rozš. vyd. Praha: Agentura ochrany přírody a krajiny ČR. 445 s. ISBN 978-80-87457-03-0
-
-
Distribution of natural habitat types is a product of species and biotopes surveillance under the obligations of Article 17 of EU Habitats Directive (92/43/ EEC). The grid distribution of natural habitat types (EEA reference grid 1 x 1 km) from data of habitat reports 2013 is presented. For detailed description and commentary see CHOBOT K. (2016). Druhy a přírodní stanoviště. Hodnotící zprávy o stavu v České republice 2013. Agentura ochrany přírody a krajiny ČR & Ministerstvo životního prostředí, Praha. 226 str., ISBN 978-80-8076-20-9. Habitat classification and national interpretation manual see CHYTRÝ, M.; KUČERA, T.; KOČÍ, M. (eds.) et al. (2010). Katalog biotopů České republiky. 2.upr. a rozš. vyd. Praha: Agentura ochrany přírody a krajiny ČR. 445 s. ISBN 978-80-87457-03-0. © NCA CR (AOPK ČR), 2013
-
PURPOSE: The objective of the program is to gather environmental coastal data to better understand fluctuations in water temperature and its effect on coastal marine species. DESCRIPTION: Bottom and surface water temperatures are monitored in coastal waters of the southern Gulf of St. Lawrence using electronic recording devices attached to navigational buoys or moorings and set to record every two hours. PARAMETERS COLLECTED: Temperature (environmental); point (spatial). NOTES ON QUALITY CONTROL: Data are checked for irregularities. SAMPLING METHODS: Temperature recording devices are installed by fishermen, DFO staff and, since 2000, by the Canadian Coast Guard staff. USE LIMITATION: To ensure scientific integrity and appropriate use of the data, we would encourage you to contact the data custodian.
-

Identification of a potential spawning site for lumpfish during an ichtyofauna inventory conducted in the eelgrass in Sept-Îles bay by Calderón (1996). Purpose: The 1996 document by par Isabel Calderón has been achieved by the "Corporation de protection de l'environnement de Sept-Îles" with the support of Department of Fisheries and Oceans (DFO) as part of the "Biodiversity" program, St. Lawrence Vision 2000 (Canada). Source: Calderón, I. 1996. Caractérisation des habitats du poisson de la baie de Sept-Îles - Phase II. Corporation de protection de l'environnement de Sept-Îles. 37 pages.
-
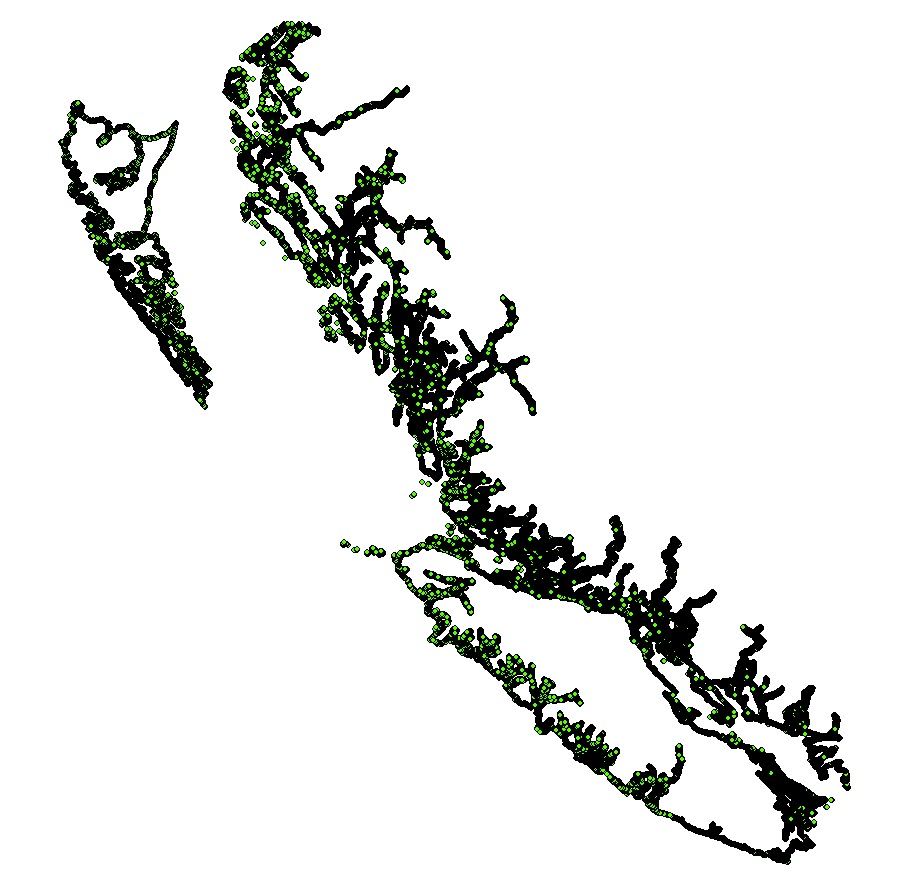
Fetch is a proxy for wind-wave action and exposure. Estimates of fetch over a total of 39,938 km of the BC coastline were calculated at 50 m intervals, yielding 799,220 near shore fetch points. Fetch was calculated for five regions in Pacific Canada: Haida Gwaii (HG), North and Central Coast (NCC), Queen Charlotte and Johnstone Straits (QCS), Salish Sea (SoG), and West Coast Vancouver Island (WCVI). For all regions, a bearing interval of 5 degrees was used to generate fetch lines for each point along the shoreline, resulting in 72 fetch lines per point. A maximum fetch distance of 200 km was used to ensure the barrier effect of Haida Gwaii was captured. Supplementary information provided includes the fetch geometry calculator script and user guide (Gregr 2014) and a report on the fetch processing objectives, process, and results (Gregr 2015).
-

Greenland Sharks (Somniosus microcephalus) are estimated to have the highest longevity of any invertebrate (392 ± 120 years), making bycatch a significant concern (Nielsen et al. 2016). However, in the Newfoundland and Labrador (NL) region, accurate estimates of bycatch are not often available for the species (Simpson et al. 2021). To address this, species distribution models (SDMs) were generated to delineate habitat suitability for the species throughout the NL region in order to identify areas where a higher rate of bycatch is expected to occur. Observations of Greenland shark bycatch recorded by At-Sea Observers (ASOs) in NL (1983 – 2019), Spain (1999 – 2017), and by the Northwest Atlantic Fisheries Organization (NAFO) Secretariat (2014 – 2019) were compiled to generate a presence-only dataset. Multiple environmental variables were assessed for collinearity, and non-collinear variables (Bathymetry and mean monthly bottom temperature for March and November (1990 – 2015)) were retained for use in the SDM. MaxEnt (maximum entropy) software was used to model habitat suitability because it is a presence-only modelling program that is able to account for a lack of absence data by comparing the environmental conditions at occurrence locations to those at randomly selected background points. Overall, the results indicated that habitat suitability for Greenland Shark was highest in deeper waters along the shelf edge in NAFO Divisions 3OP, and the Laurentian Channel, but also extended along the edge of the Labrador shelf, the Grand Banks, and deeper areas along the continental shelf such as the Hawke Channel, Funk Island Deep, and the slopes of Saglek, Nain, and Hamilton Banks. Beyond the Economic Exclusive Zone (EEZ) and within the NAFO regulatory area (NRA), suitable habitat was also present within the Flemish Pass, and along the slope of the Flemish Cap and shelf edge in NAFO Divisions 3NO (Simpson et al. 2021). More detailed information can be found in Simpson et al. 2021. References: Nielsen, J., R. B. Hedeholm, J. Heinemeier, P. G. Bushnell, J. S. Christiansen, J. Olsen, C. B. Ramsey, R. W. Brill, M. Simon, K. F. Steffensen, J. F. Steffensen. 2016. Eye lens radiocarbon reveals centuries of longevity in the Greenland shark (Somniosus microcephalus). Science 353 (6300):702-704 Simpson, M. R., Gullage, L., Konecny, C., Ollerhead, N., Treble, M.A., Nogueira, A., González-Costas, F. 2021. Spatial-temporal variation in Greenland shark (Somniosus microcephalus) bycatch in the NAFO Regulatory Area. NAFO SCR Doc. 21/028
-

PURPOSE: To characterize food webs of freshwater fish communities using stable isotopes DESCRIPTION: Data set containing the carbon, nitrogen, and sulphur stable isotope ratios of fishes caught in the Northwest Miramichi River system PARAMETERS COLLECTED: Species gut contents (ecological); species isotopic signatures (ecological); points (spatial) PHYSICAL SAMPLE DETAILS: Powdered animal tissue SAMPLING METHODS: Invertebrates were sampled via kicknet and were collected 1-4 meters from the shore of each location in one-minute intervals with 5-10 intervals per site. Fish were captured using a variety of net types in order to maximize sampling breadth. Please see below for list of net types and mesh sizes: Large fyke (box, lead line, and cod = 5mm tight, 10mm loose); 6mm beach seine; Site 3: two small fyke nets (box, lead line, and cod = 17mm, 17mm and 10mm tight, and 32mm, 32mm, 20mm loose), one trap net (box = 47.6mm and lead line = 146mm) were used). USE LIMITATION: To ensure scientific integrity and appropriate use of the data, we would encourage you to contact the data custodian.
-
Ecological Classification of the Coastal Territory of the Estuary and Gulf of St. Lawrence in Quebec

In 2009, DFO defined 12 marine bioregions across the three oceans bordering Canada to support its marine planning efforts, such as the establishment of networks of marine protected areas. However, these bioregions cover vast areas and exhibit significant ecological heterogeneity, especially along the coasts. Yet, this heterogeneity in coastal ecosystems often needs to be considered at the local scale, particularly for management and conservation purposes. The objective of this exercise is to subdivide the Estuary and Gulf of St. Lawrence (EGSL) bioregion for the province of Quebec into coastal sub-bioregions to better reflect local and regional coastal characteristics. The coastal classification presented in this report is based on the integration of four existing classification systems for the EGSL, which were not specifically designed for classifying coastal ecosystems. Integrating these classification systems into a single approach allowed us to define 13 coastal sub-bioregions for the EGSL. Data presented here are the limit of the 13 ecoregions made from this work. A technical report is available for more details. See supporting documents:Gendreau, Y., Narancic, B. et Bourassa, M-N. 2025. Classification écologique du territoire côtier de l’estuaire et du golfe du Saint-Laurent au Québec. Rapp. tech. can. sci. halieut. aquat. 0000 :v + 22p.
-
Eelgrass (Zostera marina) is important to waterfowl such as Atlantic Brant (Branta bernicla hrota), Canada Goose (Branta canadensis), American Black Duck (Anas rubripes), Common Goldeneye (Bucephala clangula) and Barrow's Goldeneye (Bucephala islandica). In New Brunswick eelgrass can be found along the Gulf of St. Lawrence, in protected harbours. Within this dataset are the results of eelgrass land-cover classifications using either satellite or aerial photography for seven harbours: Bouctouche (46 30’N, 64 39’W); Miscou (47.90 N, -64.55 W); Neguac (47.25 N, -65.03 W); Richibucto (46.70 N, -64.80 W); Saint-Simon (47.77 N, -64.76 W); Tracadie (47.55 N, -64.88 W); and Cocagne (46.370 N, -64.600 W). Information on each dataset is provided: 1. Bouctouche This dataset contains results from an eelgrass classification for Bouctouche Bay, New Brunswick. True colour aerial photography at 57 centimetre resolution was collected on September 2, 2009 by Nortek Resources of Thorburn, Nova Scotia (http://www.nortekresources.com/). Image classification was conducted using eCognition Developer v. 8 Software, which first segments the image into spectrally similar units, which were then classified manually. Additionally, the Department of Fisheries and Oceans (Gulf Region, Moncton, NB) conducted a visual field survey in the same field season at 688 sites. Two-thirds of these sites were used to assist in image classification, while the remainder were used to assess accuracy. Three classes were identified: i. Good Quality Eelgrass: relatively dense, clean, green blades with minimal epiphytes or algal growth. ii. Medium Quality Eelgrass: predominately green blades that may have some epiphyte or algal growth. These stands can be less or equally dense as Good Quality Eelgrass, but the best grasses are certainly not as abundant. iii. Eelgrass Absent/Poor Quality: eelgrass is absent, or if it is present it is typically covered with epiphytes or other algae or dying or dead. Eelgrass was classified correctly 83.7% of the time in a fuzzy accuracy assessment technique, whereby those classes that were ‘off’ by one class, e.g. Good Quality eelgrass classed as Medium Quality, were given half credit towards the overall accuracy. Of 187 sites that were within the classification area, 131 were correct, 51 were "one-off", and 5 were incorrect [(131 + (51/2))/ 187 = 0.837]. 2. Miscou True colour aerial photography at 57 centimetre resolution was collected on August 20th and 24th, 2009 by Nortek Resources of Thorburn, Nova Scotia (http://www.nortekresources.com/). Image classification was conducted using eCognition Developer v. 8 Software, which first segments the image into spectrally similar units, which were then classified manually. Additionally, the Department of Fisheries and Oceans (Gulf Region, Moncton, NB) conducted a visual field survey in the same field season at 103 sites. From these sites 70% were used to assist in image classification, while the remainder were used to assess accuracy. Three classes were identified: i. Good Quality Eelgrass: relatively dense, clean, green blades with minimal epiphytes or algal growth. ii. Medium Quality Eelgrass: predominately green blades that may have some epiphyte or algal growth. These stands can be less or equally dense as Good Quality Eelgrass, but the best grasses are certainly not as abundant. iii. Eelgrass Absent/Poor Quality: eelgrass is absent, or if it is present it is typically covered with epiphytes or other algae or dying or dead. Eelgrass was classified correctly 96.7% of the time (30/31 = 0.967). 3. Neguac This dataset contains results from an eelgrass classification for Neguac Bay, New Brunswick. True colour aerial photography at 57 centimetre resolution was collected on September 2, 2009 by Nortek Resources of Thorburn, Nova Scotia (http://www.nortekresources.com/). Image classification was conducted using eCognition Developer v. 8 Software, which first segments the image into spectrally similar units, which were then classified manually. Additionally, the Department of Fisheries and Oceans (Gulf Region, Moncton, NB) conducted a visual field survey in the same field season at 126 sites. Two-thirds of these sites were used to assist in image classification, while the remainder were used to assess accuracy. Three classes were identified: i. Good Quality Eelgrass: relatively dense, clean, green blades with minimal epiphytes or algal growth. ii. Medium Quality Eelgrass: predominately green blades that may have some epiphyte or algal growth. These stands can be less or equally dense as Good Quality Eelgrass, but the best grasses are certainly not as abundant. iii. Eelgrass Absent/Poor Quality: eelgrass is absent, or if it is present it is typically covered with epiphytes or other algae or dying or dead. Eelgrass was classified correctly 81% of the time in a fuzzy accuracy assessment technique, whereby those classes that were ‘off’ by one class, e.g. Good Quality eelgrass classed as Medium Quality, were given half credit towards the overall accuracy. Of 39 sites that were within the classification area, 27 were correct, 9 were "one-off", and 3 were incorrect [(27 + (9/2))/ 39 = 0.81]. 4. Richibucto Eelgrass classification in Richibucto Harbour, New Brunswick. Derived from a Quickbird satellite image collected on August 28, 2007 at as close to low-tide as possible. Quickbird's ground resolution is 2.4 m. Classification was objected-oriented using Definiens software. Accuracy was 81.5%. Data used for accuracy and training was collected along transects using a differential GPS positioned towfish holding sidescan sonar, and a video camera that was later transcribed as XY points to describe eel-grass presence. 5. Saint-Simon An eelgrass distribution map was classified from remotely sensed imagery in Shippagan Harbour, New Brunswick. Derived from a Quickbird satellite image collected on July 27, 2007 at as close to low-tide as possible. Classification was objected-oriented using Definiens software. Data used for accuracy and training was collected along transects using a differential GPS positioned towfish holding sidescan sonar, and a video camera that was later transcribed as XY points to describe eel-grass presence. 6. Tracadie This dataset contains results from an eelgrass classification for Tracadie Bay, New Brunswick. True colour aerial photography at 57 centimetre resolution was collected on September 2, 2009 by Nortek Resources of Thorburn, Nova Scotia (http://www.nortekresources.com/). Image classification was conducted using eCognition Developer v. 8 Software, which first segments the image into spectrally similar units, which were then classified manually. Additionally, the Department of Fisheries and Oceans (Gulf Region, Moncton, NB) conducted a visual field survey in the same field season at 101 sites. Approximately two-thirds of these sites were used to assist in image classification, while the remainder was used to assess accuracy. Three classes were identified: i. Good Quality Eelgrass: relatively dense, clean, green blades with minimal epiphytes or algal growth. ii. Medium Quality Eelgrass: predominately green blades that may have some epiphyte or algal growth. These stands can be less or equally dense as Good Quality Eelgrass, but the best grasses are certainly not as abundant. iii. Eelgrass Absent/Poor Quality: eelgrass is absent, or if it is present it is typically covered with epiphytes or other algae or dying or dead. Eelgrass was classified correctly 79.3% of the time in a fuzzy accuracy assessment technique, whereby those classes that were ‘off’ by one class, e.g. Good Quality eelgrass classed as Medium Quality, were given half credit towards the overall accuracy. Of 29 sites that were within the classification area, 18 were correct, 10 were "one-off", and 1 was incorrect [(18 + (10/2))/ 29 = 0.793]. 7. Cocagne Visible orthorectified aerial photography was used to classify polygons containing eelgrass in Cocagne Harbour. Field data for image training and validation were collected along transects in summer 2008 using a dGPS positioned towfish holding sidescan sonar and a video camera that was later transcribed as XY geographic points to describe eelgrass presence and a qualitative description of density. The area was flown for photography on September 24, 2008. eCognition Developer 8 software was used to segment the imagery, essentially polygons. Polygons were then classified manually for the presence of eelgrass. Using field data revealed eelgrass presence to be mapped correctly 87.2% of the time.