 Arctic SDI catalogue
Plankton
Type of resources
Available actions
Topics
Keywords
Contact for the resource
Provided by
Years
Formats
Representation types
Update frequencies
status
-
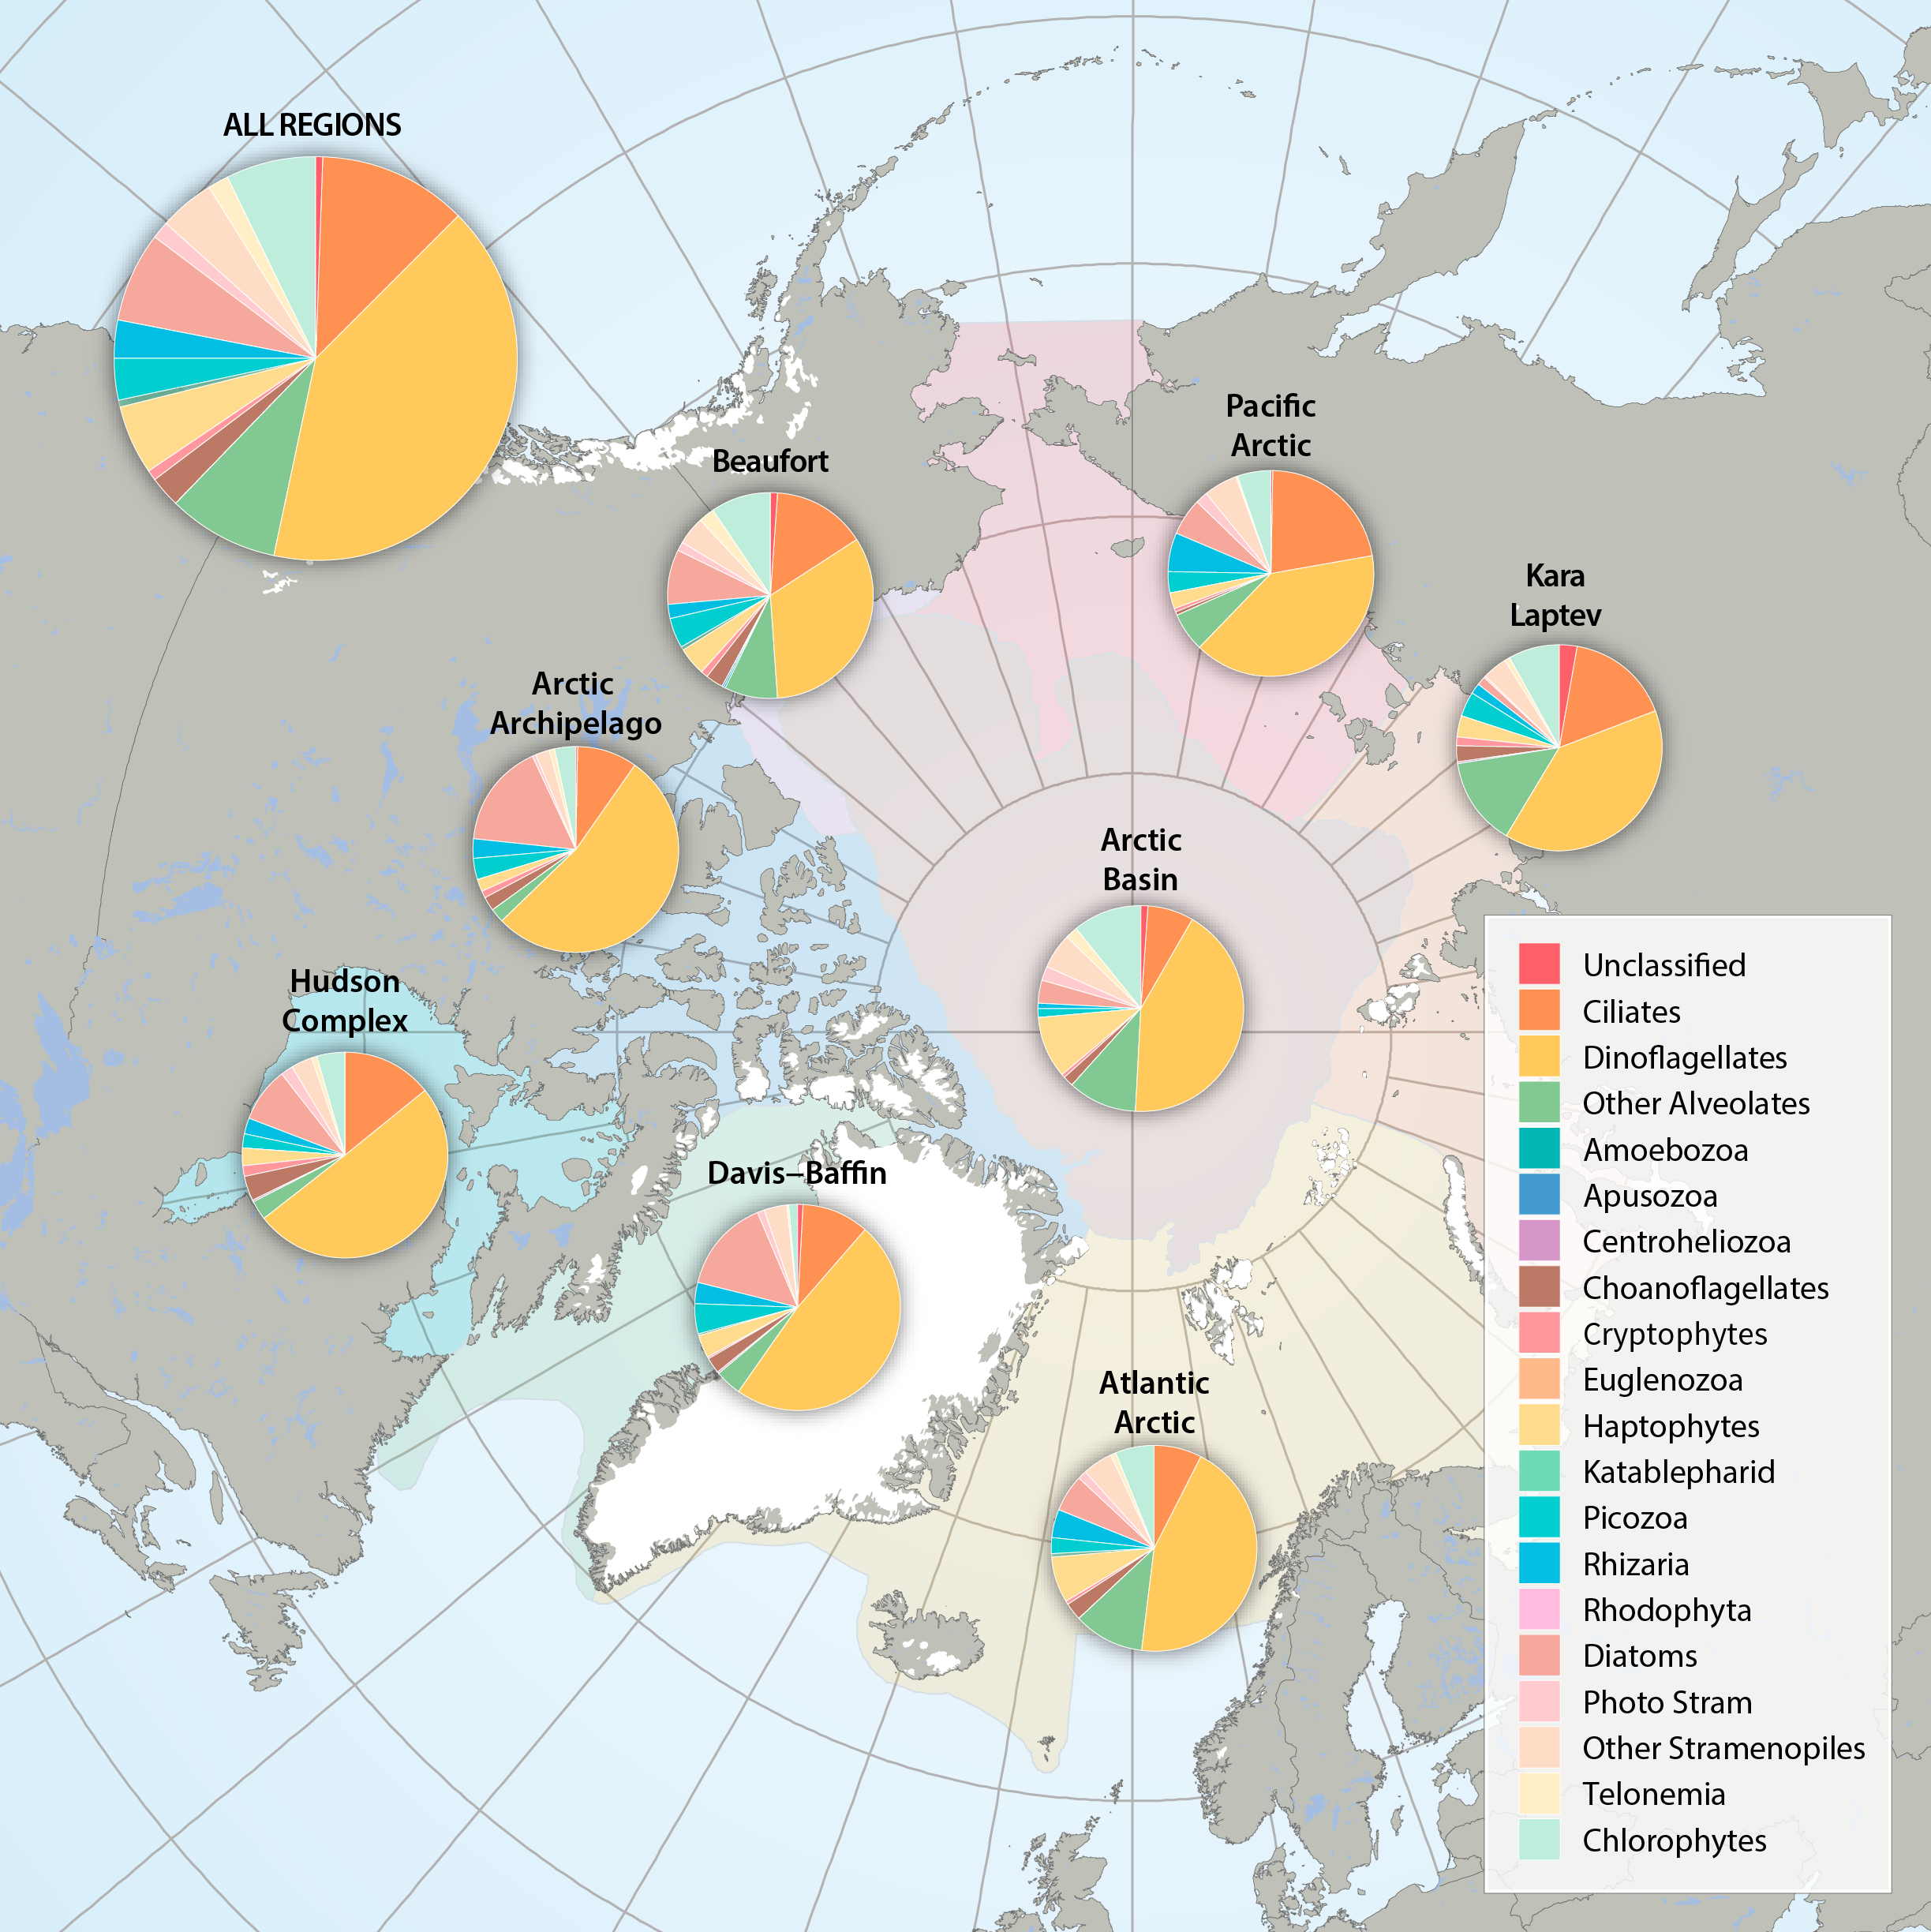
Figure 3.2.2a: Relative abundance of major eukaryote taxonomic groups found by high throughput sequencing of the small-subunit (18S) rRNA gene across Arctic Marine Areas. Figure 3.2.2b: Relative abundance of major eukaryote functional groups found by microscopy in the Arctic Marine Areas. STATE OF THE ARCTIC MARINE BIODIVERSITY REPORT - <a href="https://arcticbiodiversity.is/findings/plankton" target="_blank">Chapter 3</a> - Page 70 - Figures 3.2.2a and 3.2.2b
-
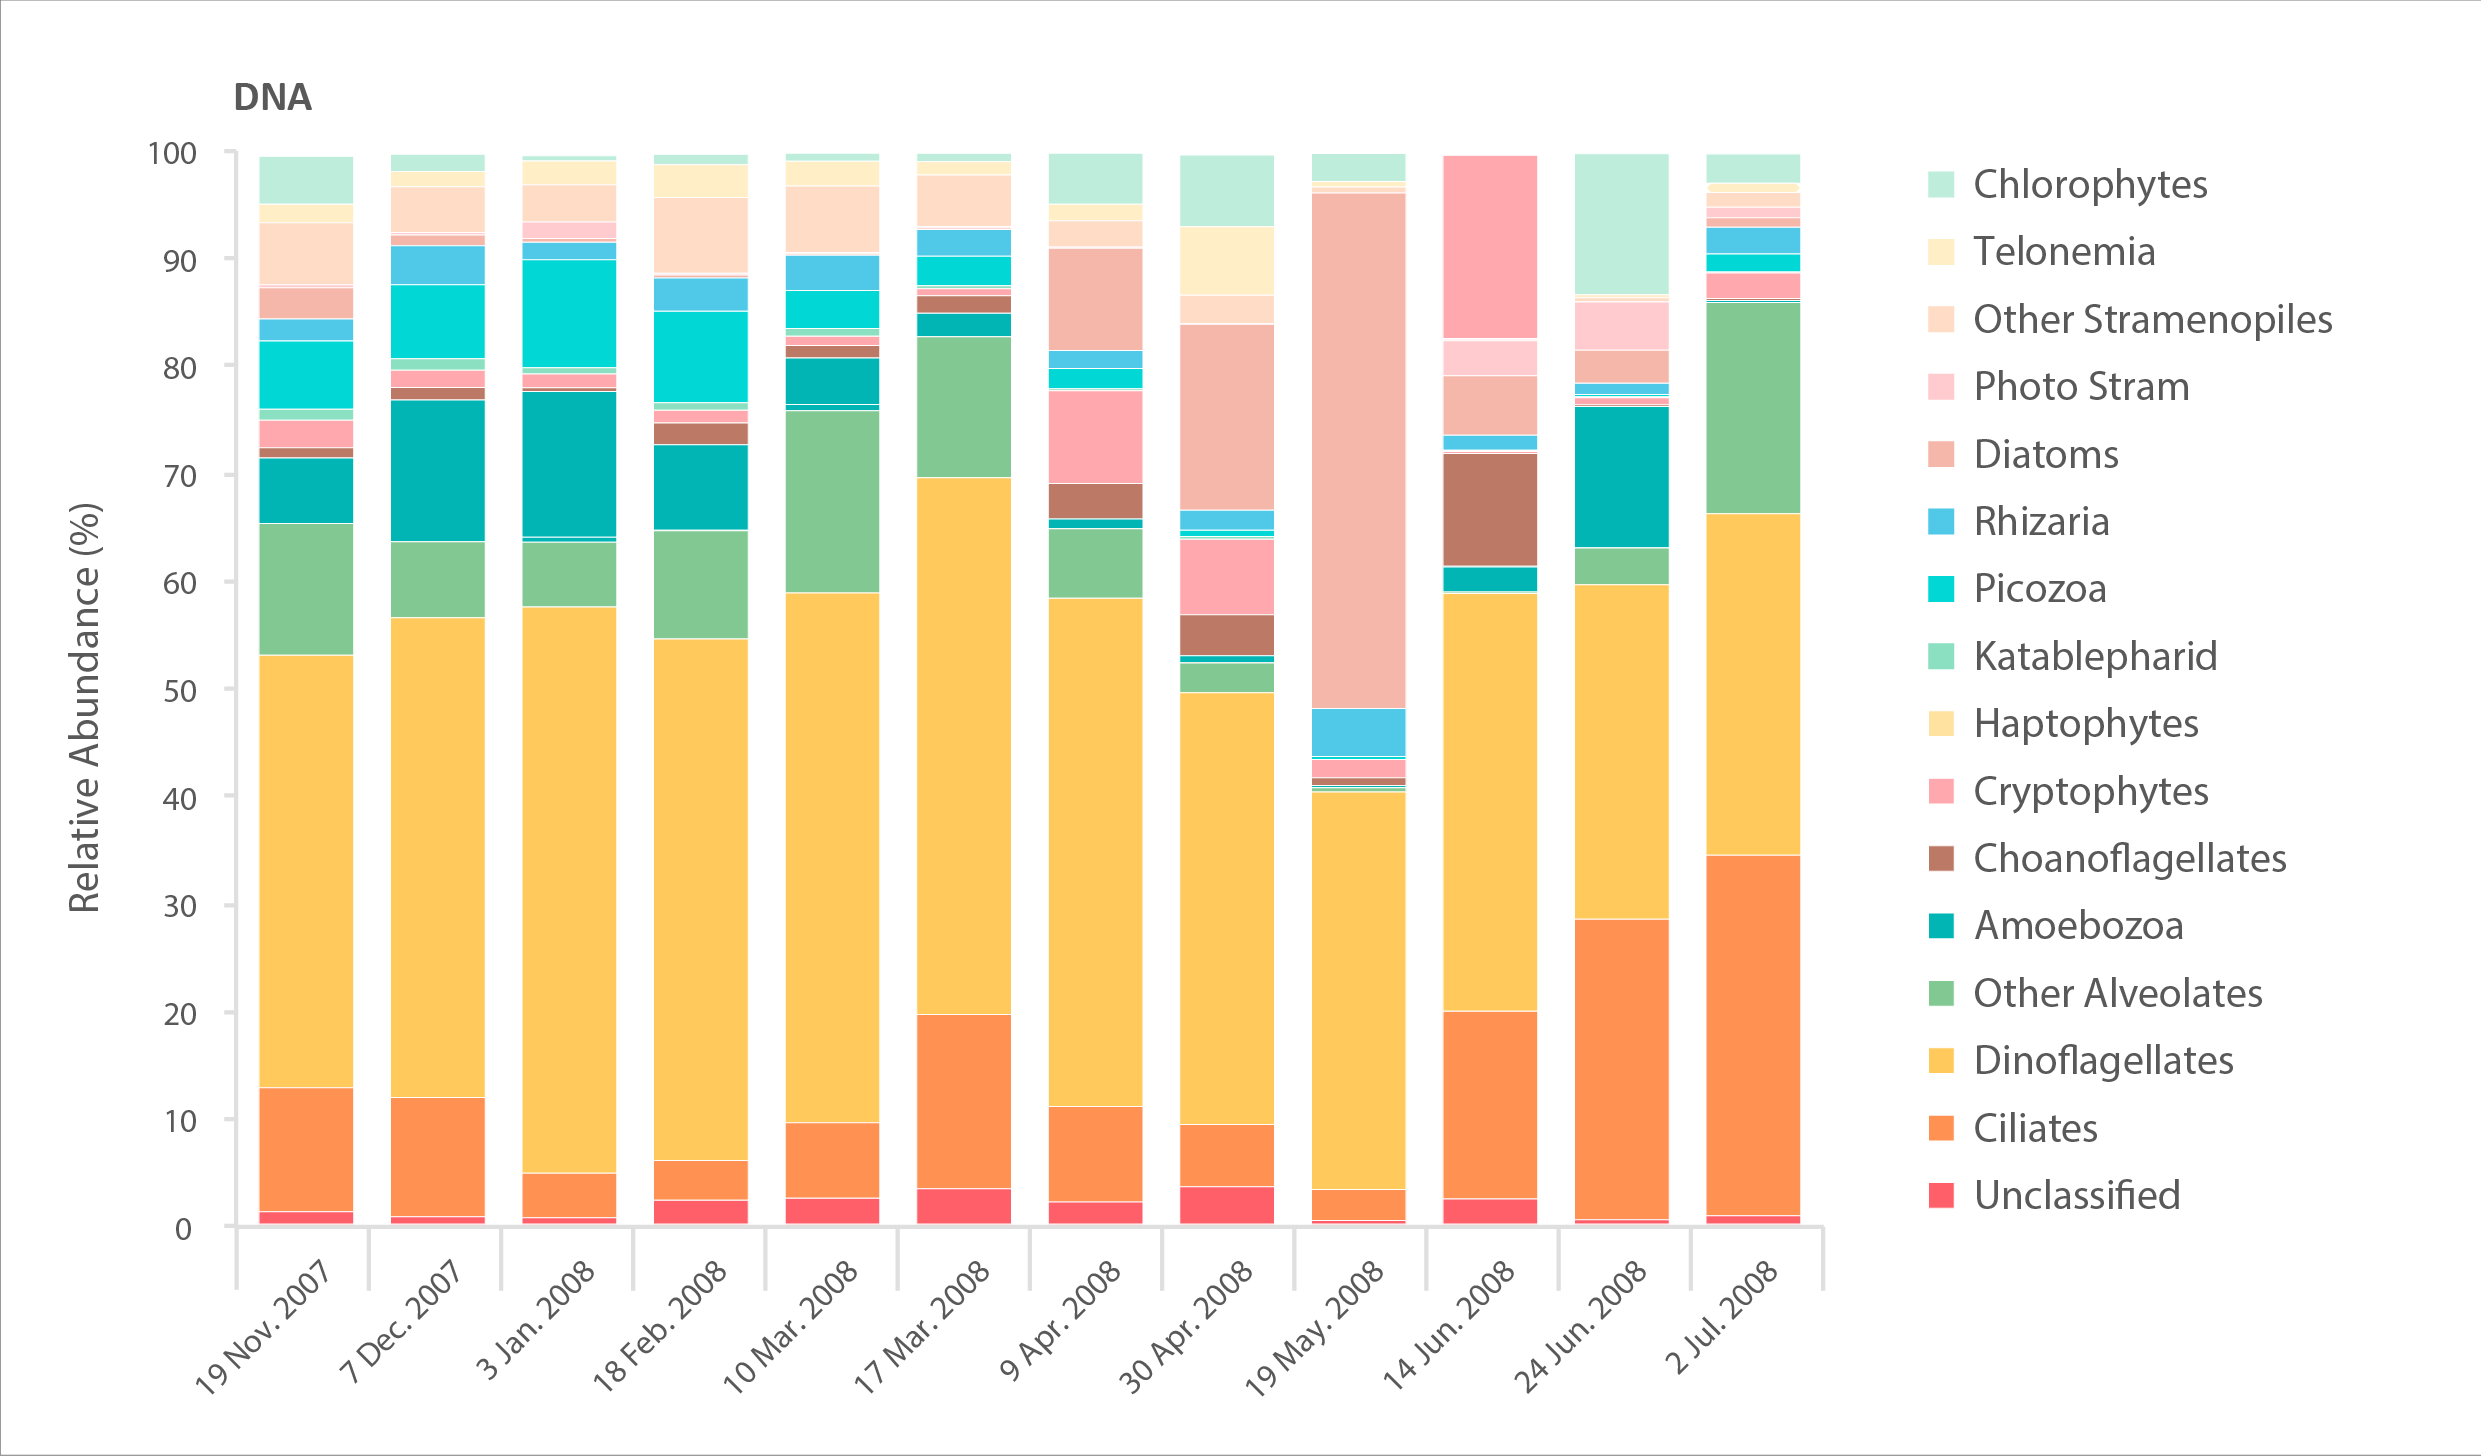
Relative abundance of major eukaryote taxonomic groups found by high throughput sequencing of the small-subunit (18S) rRNA gene. Time series collected by sampling every 2-6 weeks in Amundsen Gulf of the Beaufort Sea over the winter-spring transition in 2007–2008. Sampling DNA gives information about presence/absence, while sampling RNA gives information about the state of activity of different taxa. STATE OF THE ARCTIC MARINE BIODIVERSITY REPORT - <a href="https://arcticbiodiversity.is/findings/plankton" target="_blank">Chapter 3</a> - Page 72 - Figures 3.2.3
-

Plankton (zooplankton and large phytoplankton) are collected using the Continuous Plankton Recorder (CPR) in the Northwest (NW) Atlantic along tracks transited by container ships from Reykjavik (Iceland) to St. John’s, NL (the Z line), and between St. John’s and the New England Coast, along the Scotian Shelf (the E and MD lines). The CPR Survey is the longest running, most geographically extensive marine ecological survey in the world, providing comparable data on the geographical distribution, seasonal cycles and year-to-year changes in abundance of plankton over a large spatial area. The first northwest Atlantic samples were collected in the Irminger Sea in 1957, and sampling was extended farther west to the Scotian Shelf a few years later. Sampling has continued to the present with some interruptions during the late 1970s and 1980s. Sampling is nominally once per month along the E, MD, and Z lines. DFO Sample collection and analysis are led by the Continuous Plankton Recorder Survey program at the Marine Biological Association of the UK. DFO provides partial support for the northwest Atlantic survey carried out on the E, MD, and Z lines and incorporates CPR data in Atlantic Zone Monitoring Program ocean environmental status reporting.
-
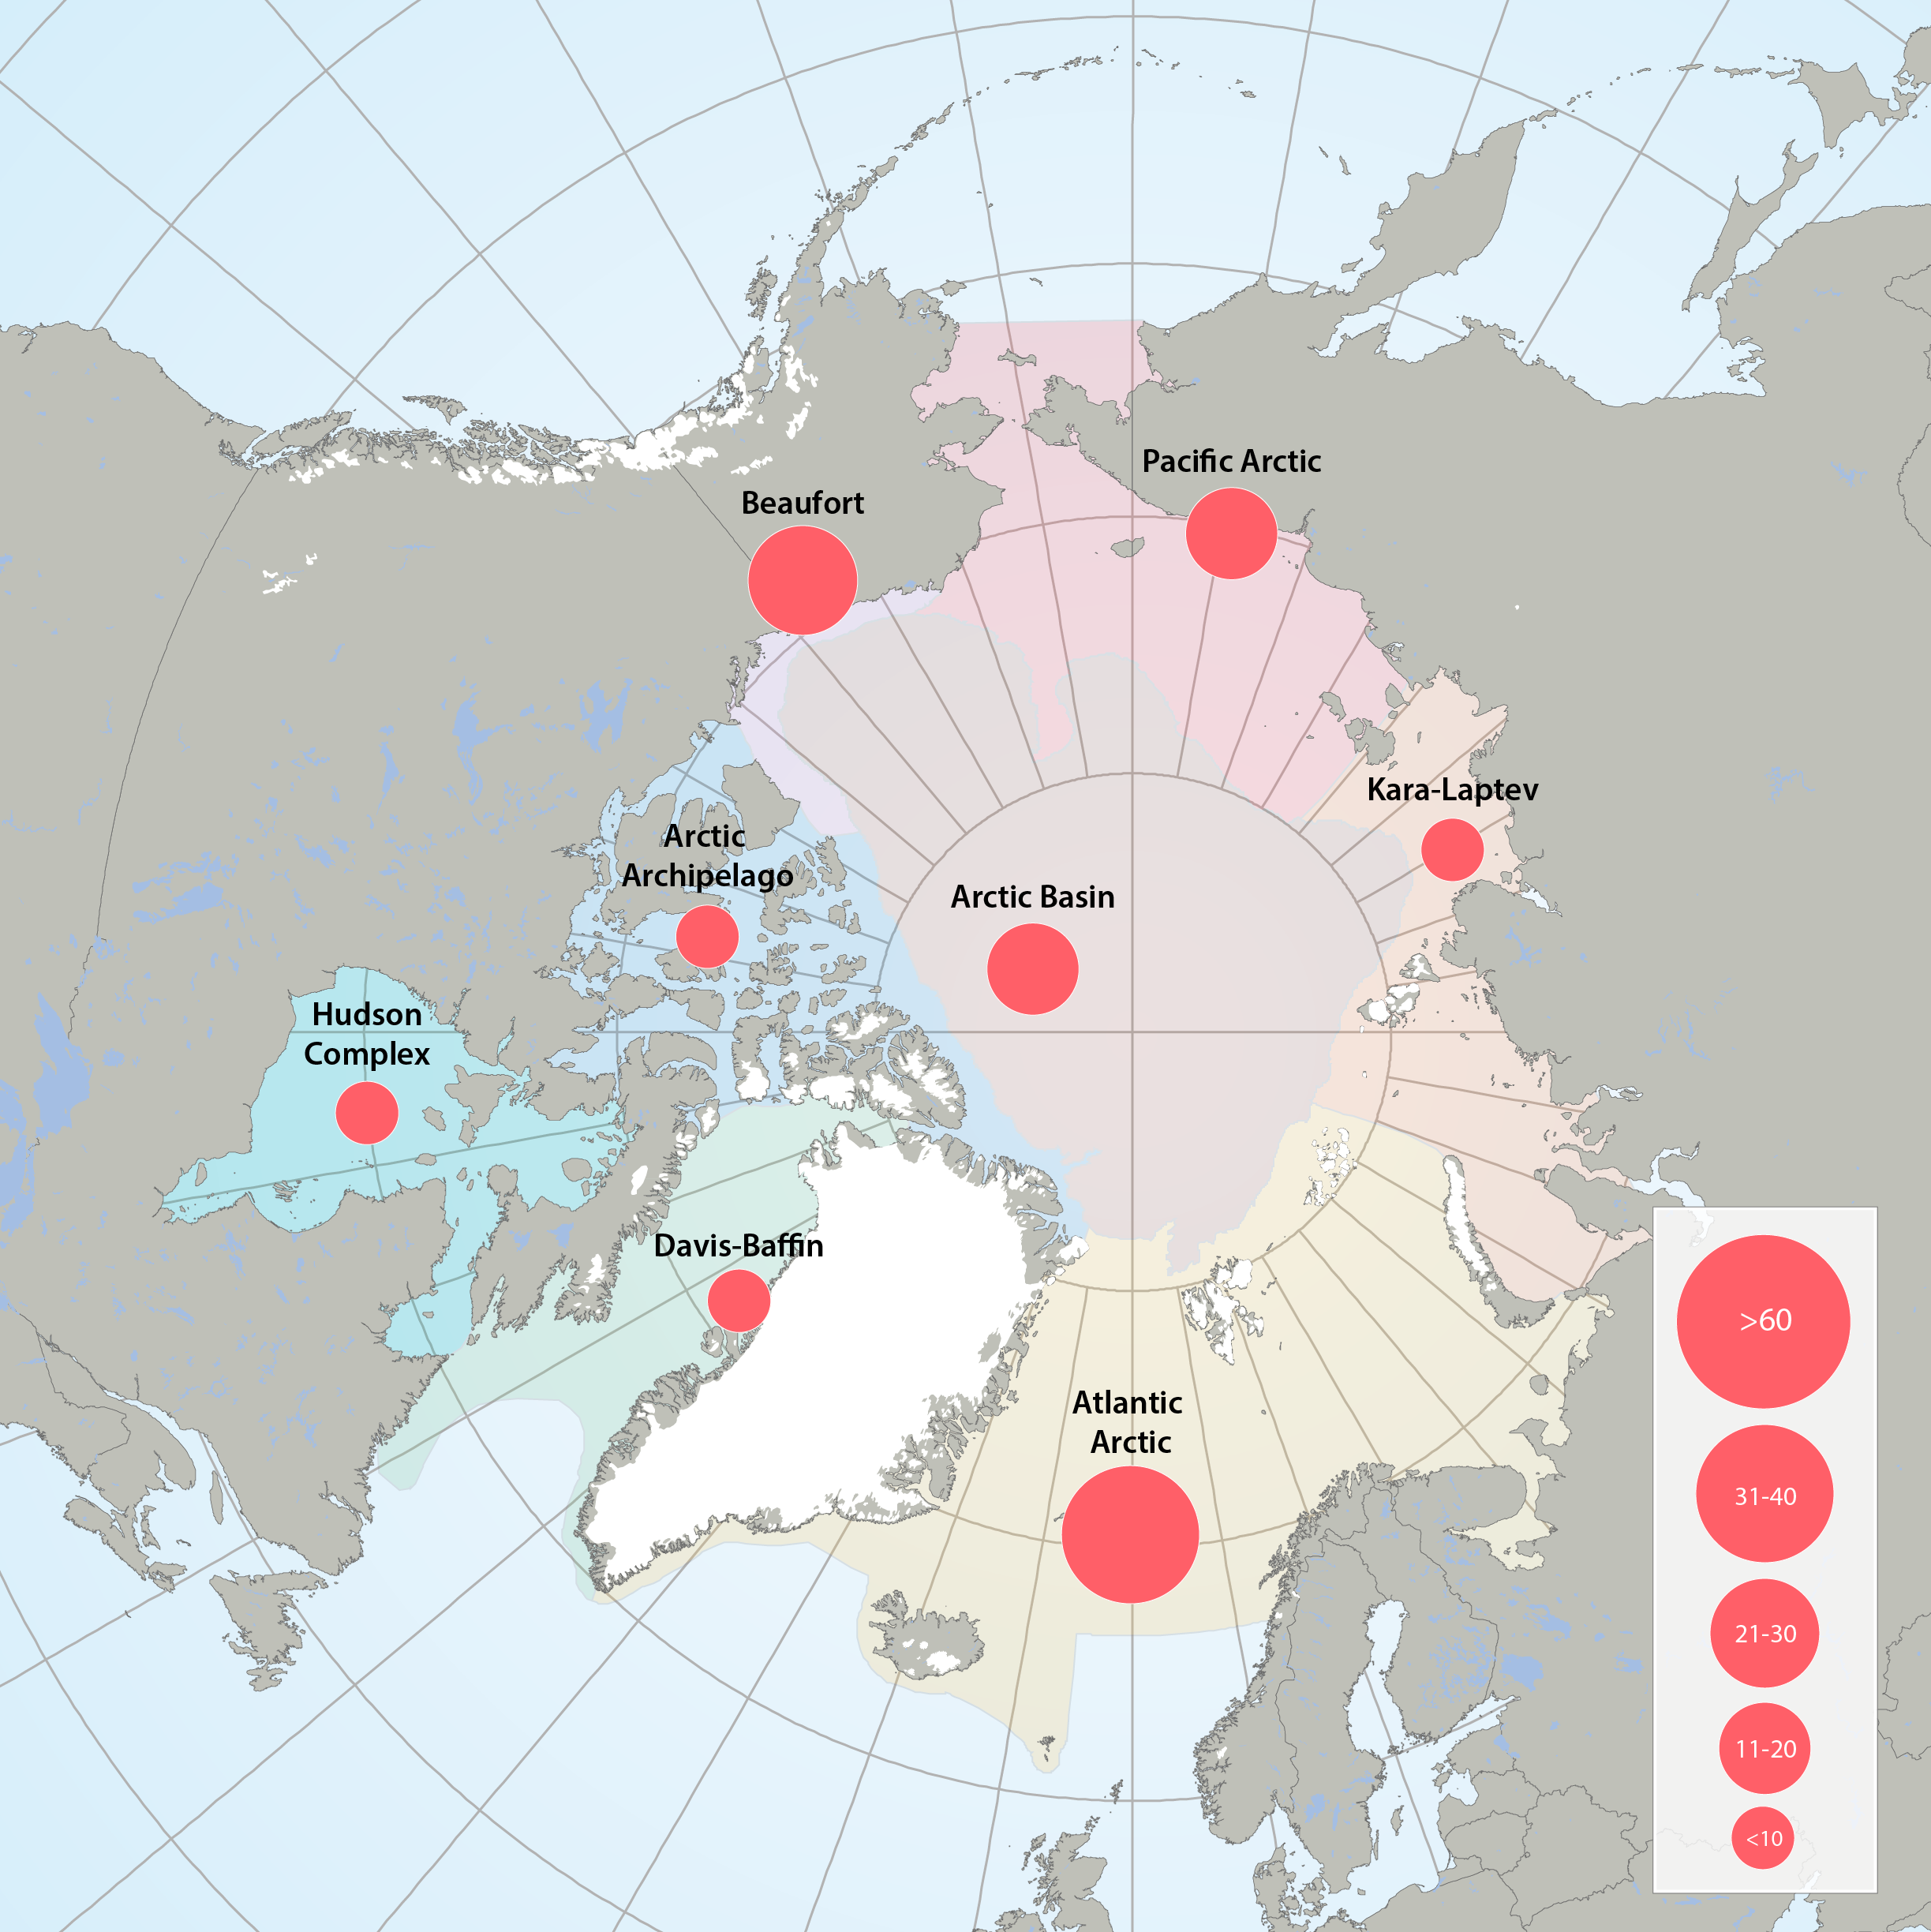
Figure 3.2.1a: Map of high throughput sequencing records from the Arctic Marine Areas. Figure 3.2.1b: Map of records of phytoplankton taxa using microscopy from the Arctic Marine Areas. STATE OF THE ARCTIC MARINE BIODIVERSITY REPORT - <a href="https://arcticbiodiversity.is/findings/plankton" target="_blank">Chapter 3</a> - Page 35 - Figure 3.2.1a and Figure 3.2.1b In terms of stations sampled, the greatest sampling effort of high-throughput sequencing in Arctic marine water columns, by far, has been in the Beaufort Sea/Amundsen Gulf region and around Svalbard. High through-put sequencing has also been used on samples from the Chukchi Sea, Canadian Arctic Archipelago, Baffin Bay, Hudson Bay, the Greenland Sea and Laptev Sea.
-
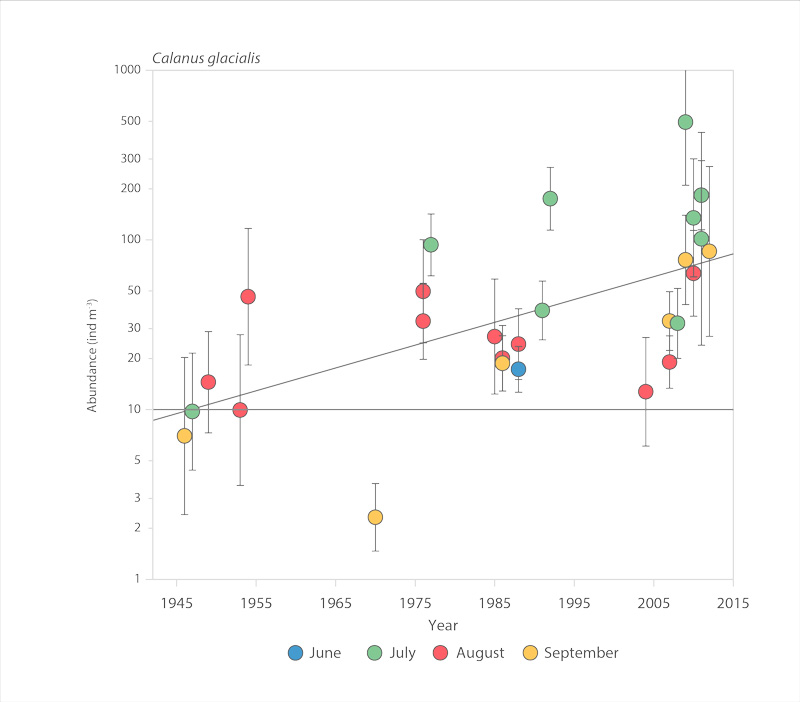
Abundance of the copepod Calanus glacialis in the Chukchi Sea, 1945-2012 (after Ershova et al. 2015b). STATE OF THE ARCTIC MARINE BIODIVERSITY REPORT - <a href="https://arcticbiodiversity.is/findings/plankton" target="_blank">Chapter 3</a> - Page 75 - Figure 3.2.6
-
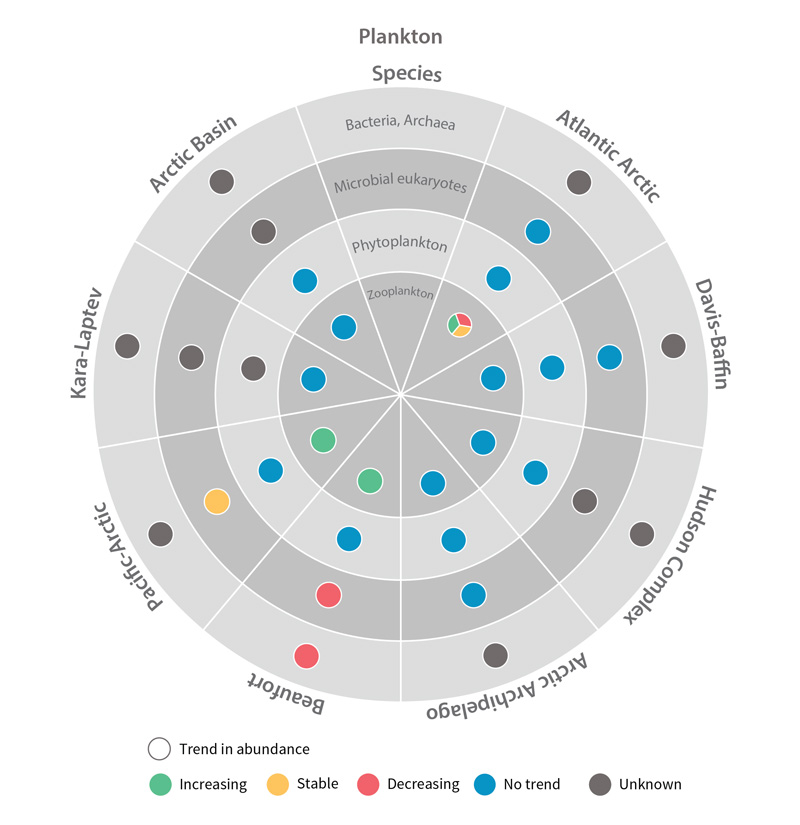
Trends in abundance of plankton Focal Ecosystem Components across each Arctic Marine Area. STATE OF THE ARCTIC MARINE BIODIVERSITY REPORT - Chapter 4 - Page 178 - Figure 4.2
-
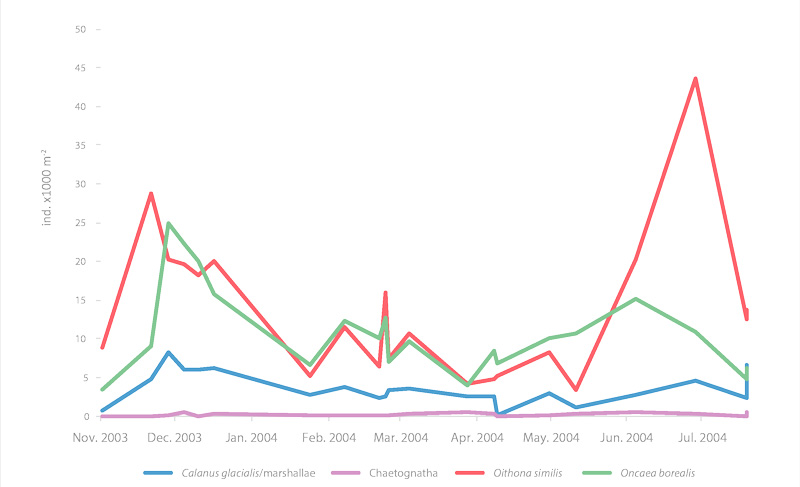
Seasonal time series of the major zooplankton in Franklin Bay, Canada STATE OF THE ARCTIC MARINE BIODIVERSITY REPORT - <a href="https://arcticbiodiversity.is/findings/plankton" target="_blank">Chapter 3</a> - Page 78 - Figure 3.2.9 Mesozooplankton abundance, integrated from 10 m above the seafloor to the surface (ind m-2), in Franklin Bay during the CASES 2003-04 overwintering expedition. Most of the sampling was done at the overwintering station and a few stations were close to this site in autumn 2003 and summer 2004.
-

Phytoplankton pigments, determined by high-performance liquid chromatography (HPLC) are measured seasonally along a 20-station transect in the Juan de Fuca / Strait of Georgia Basin. Sampling was initiated in 2004, discontinued in 2012 and restarted in 2015. In addition, occasional sampling is carried out at several locations and times in inland waters. For data inquiries please contact: Angelica Pena for data from 2004 to 2015 and Nina Nemcek for data from 2015 to present.
-

Phytoplankton pigments, determined by high-performance liquid chromatography (HPLC) have been measured on DFO La Perouse cruises since 2011. Surface samples are taken along a series of transects off the west coast of Vancouver Island twice a year usually in May/June and early September.
-

Phytoplankton pigments, determined by high-performance liquid chromatography (HPLC) are measured on DFO cruises three times a year in February, June, and August/September along Line P in the northeast subarctic Pacific. Sampling for phytoplankton pigments started in 2006 at the five main Line P stations and was expanded to sample at all twenty seven stations along the transect in June 2010.