Phytoplankton
Type of resources
Available actions
Topics
Keywords
Contact for the resource
Provided by
Formats
Representation types
Update frequencies
status
-
Plankton (zooplankton and large phytoplankton) are collected using the Continuous Plankton Recorder (CPR) in the Northwest (NW) Atlantic along tracks transited by container ships from Reykjavik (Iceland) to St. John’s, NL (the Z line), and between St. John’s and the New England Coast, along the Scotian Shelf (the E and MD lines). The CPR Survey is the longest running, most geographically extensive marine ecological survey in the world, providing comparable data on the geographical distribution, seasonal cycles and year-to-year changes in abundance of plankton over a large spatial area. The first northwest Atlantic samples were collected in the Irminger Sea in 1957, and sampling was extended farther west to the Scotian Shelf a few years later. Sampling has continued to the present with some interruptions during the late 1970s and 1980s. Sampling is nominally once per month along the E, MD, and Z lines. DFO Sample collection and analysis are led by the Continuous Plankton Recorder Survey program at the Marine Biological Association of the UK. DFO provides partial support for the northwest Atlantic survey carried out on the E, MD, and Z lines and incorporates CPR data in Atlantic Zone Monitoring Program ocean environmental status reporting.
-

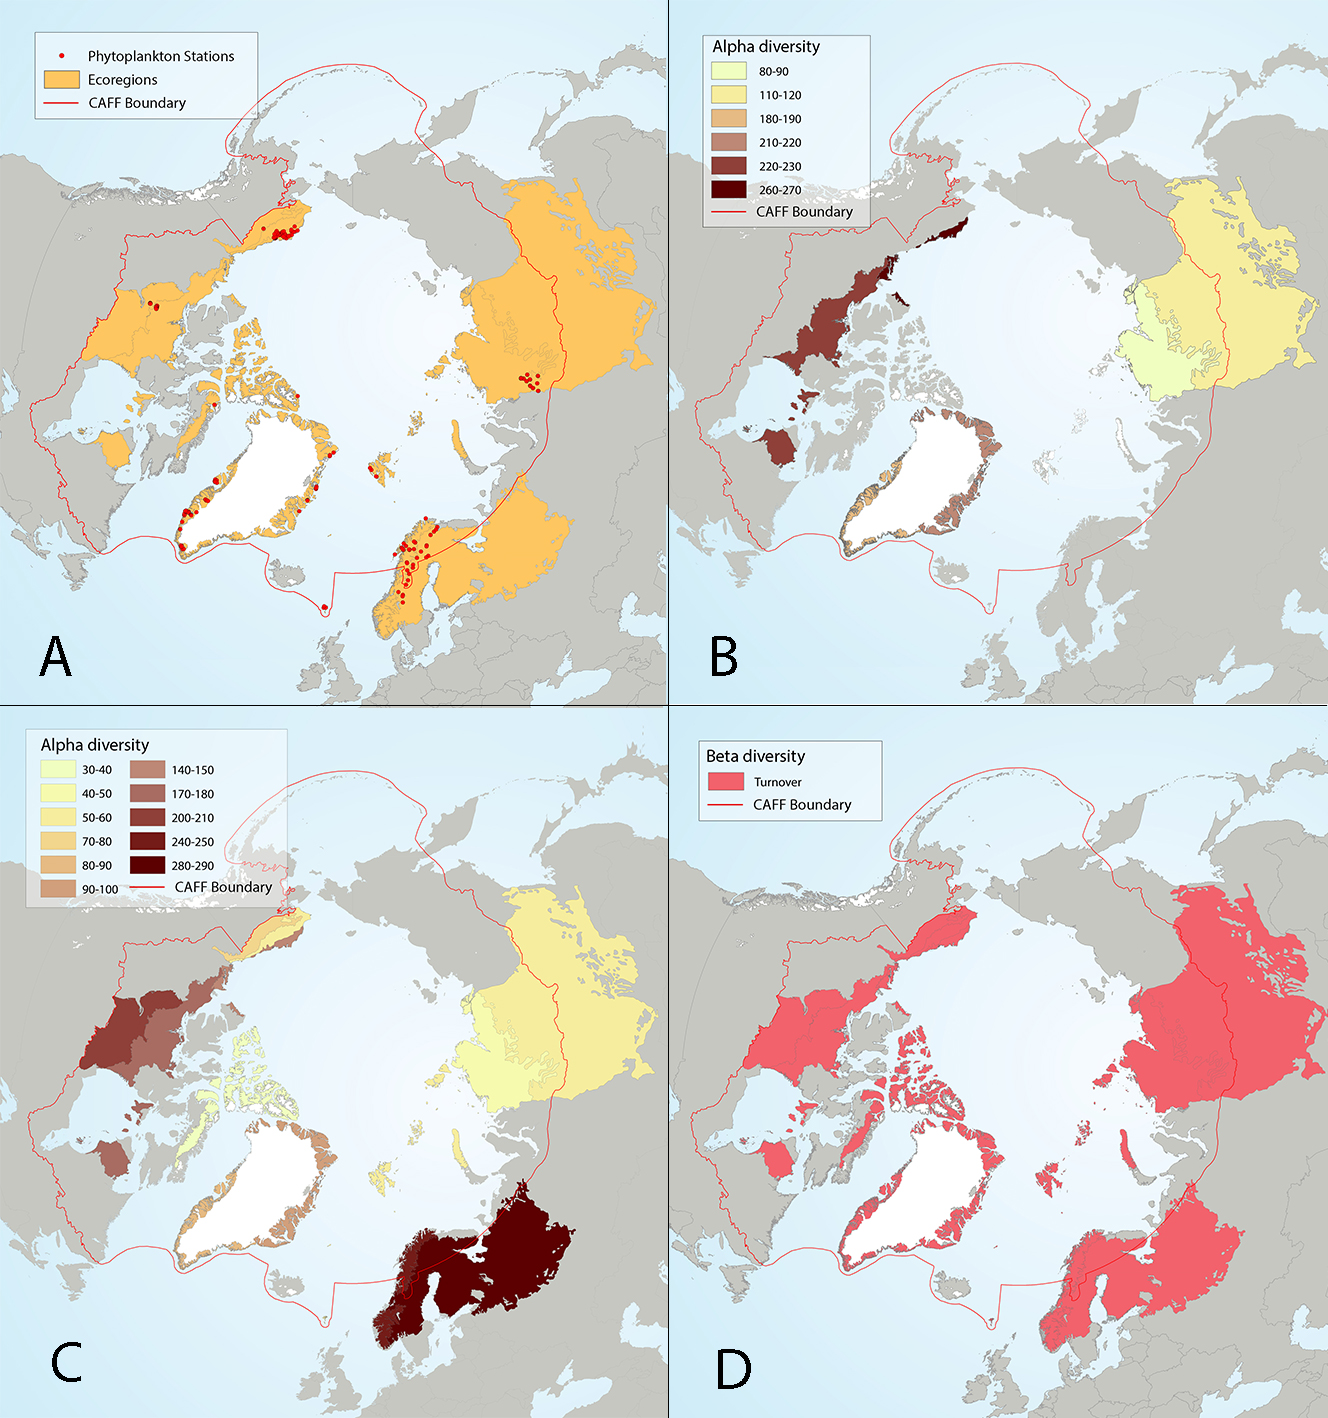
Figure 4 17 Results of circumpolar assessment of lake phytoplankton,(a) the location of phytoplankton stations, underlain by circumpolar ecoregions; (b) ecoregions with many phytoplankton stations, colored on the basis of alpha diversity rarefied to 35 stations; (c) all ecoregions with phytoplankton stations, colored on the basis of alpha diversity rarefied to 10 stations; (d) ecoregions with at least two stations in a hydrobasin, colored on the basis of the dominant component of beta diversity (species turnover, nestedness, approximately equal contribution, or no diversity) when averaged across hydrobasins in each ecoregion. State of the Arctic Freshwater Biodiversity Report - Chapter 4 - Page 56 - Figure 4-17
-

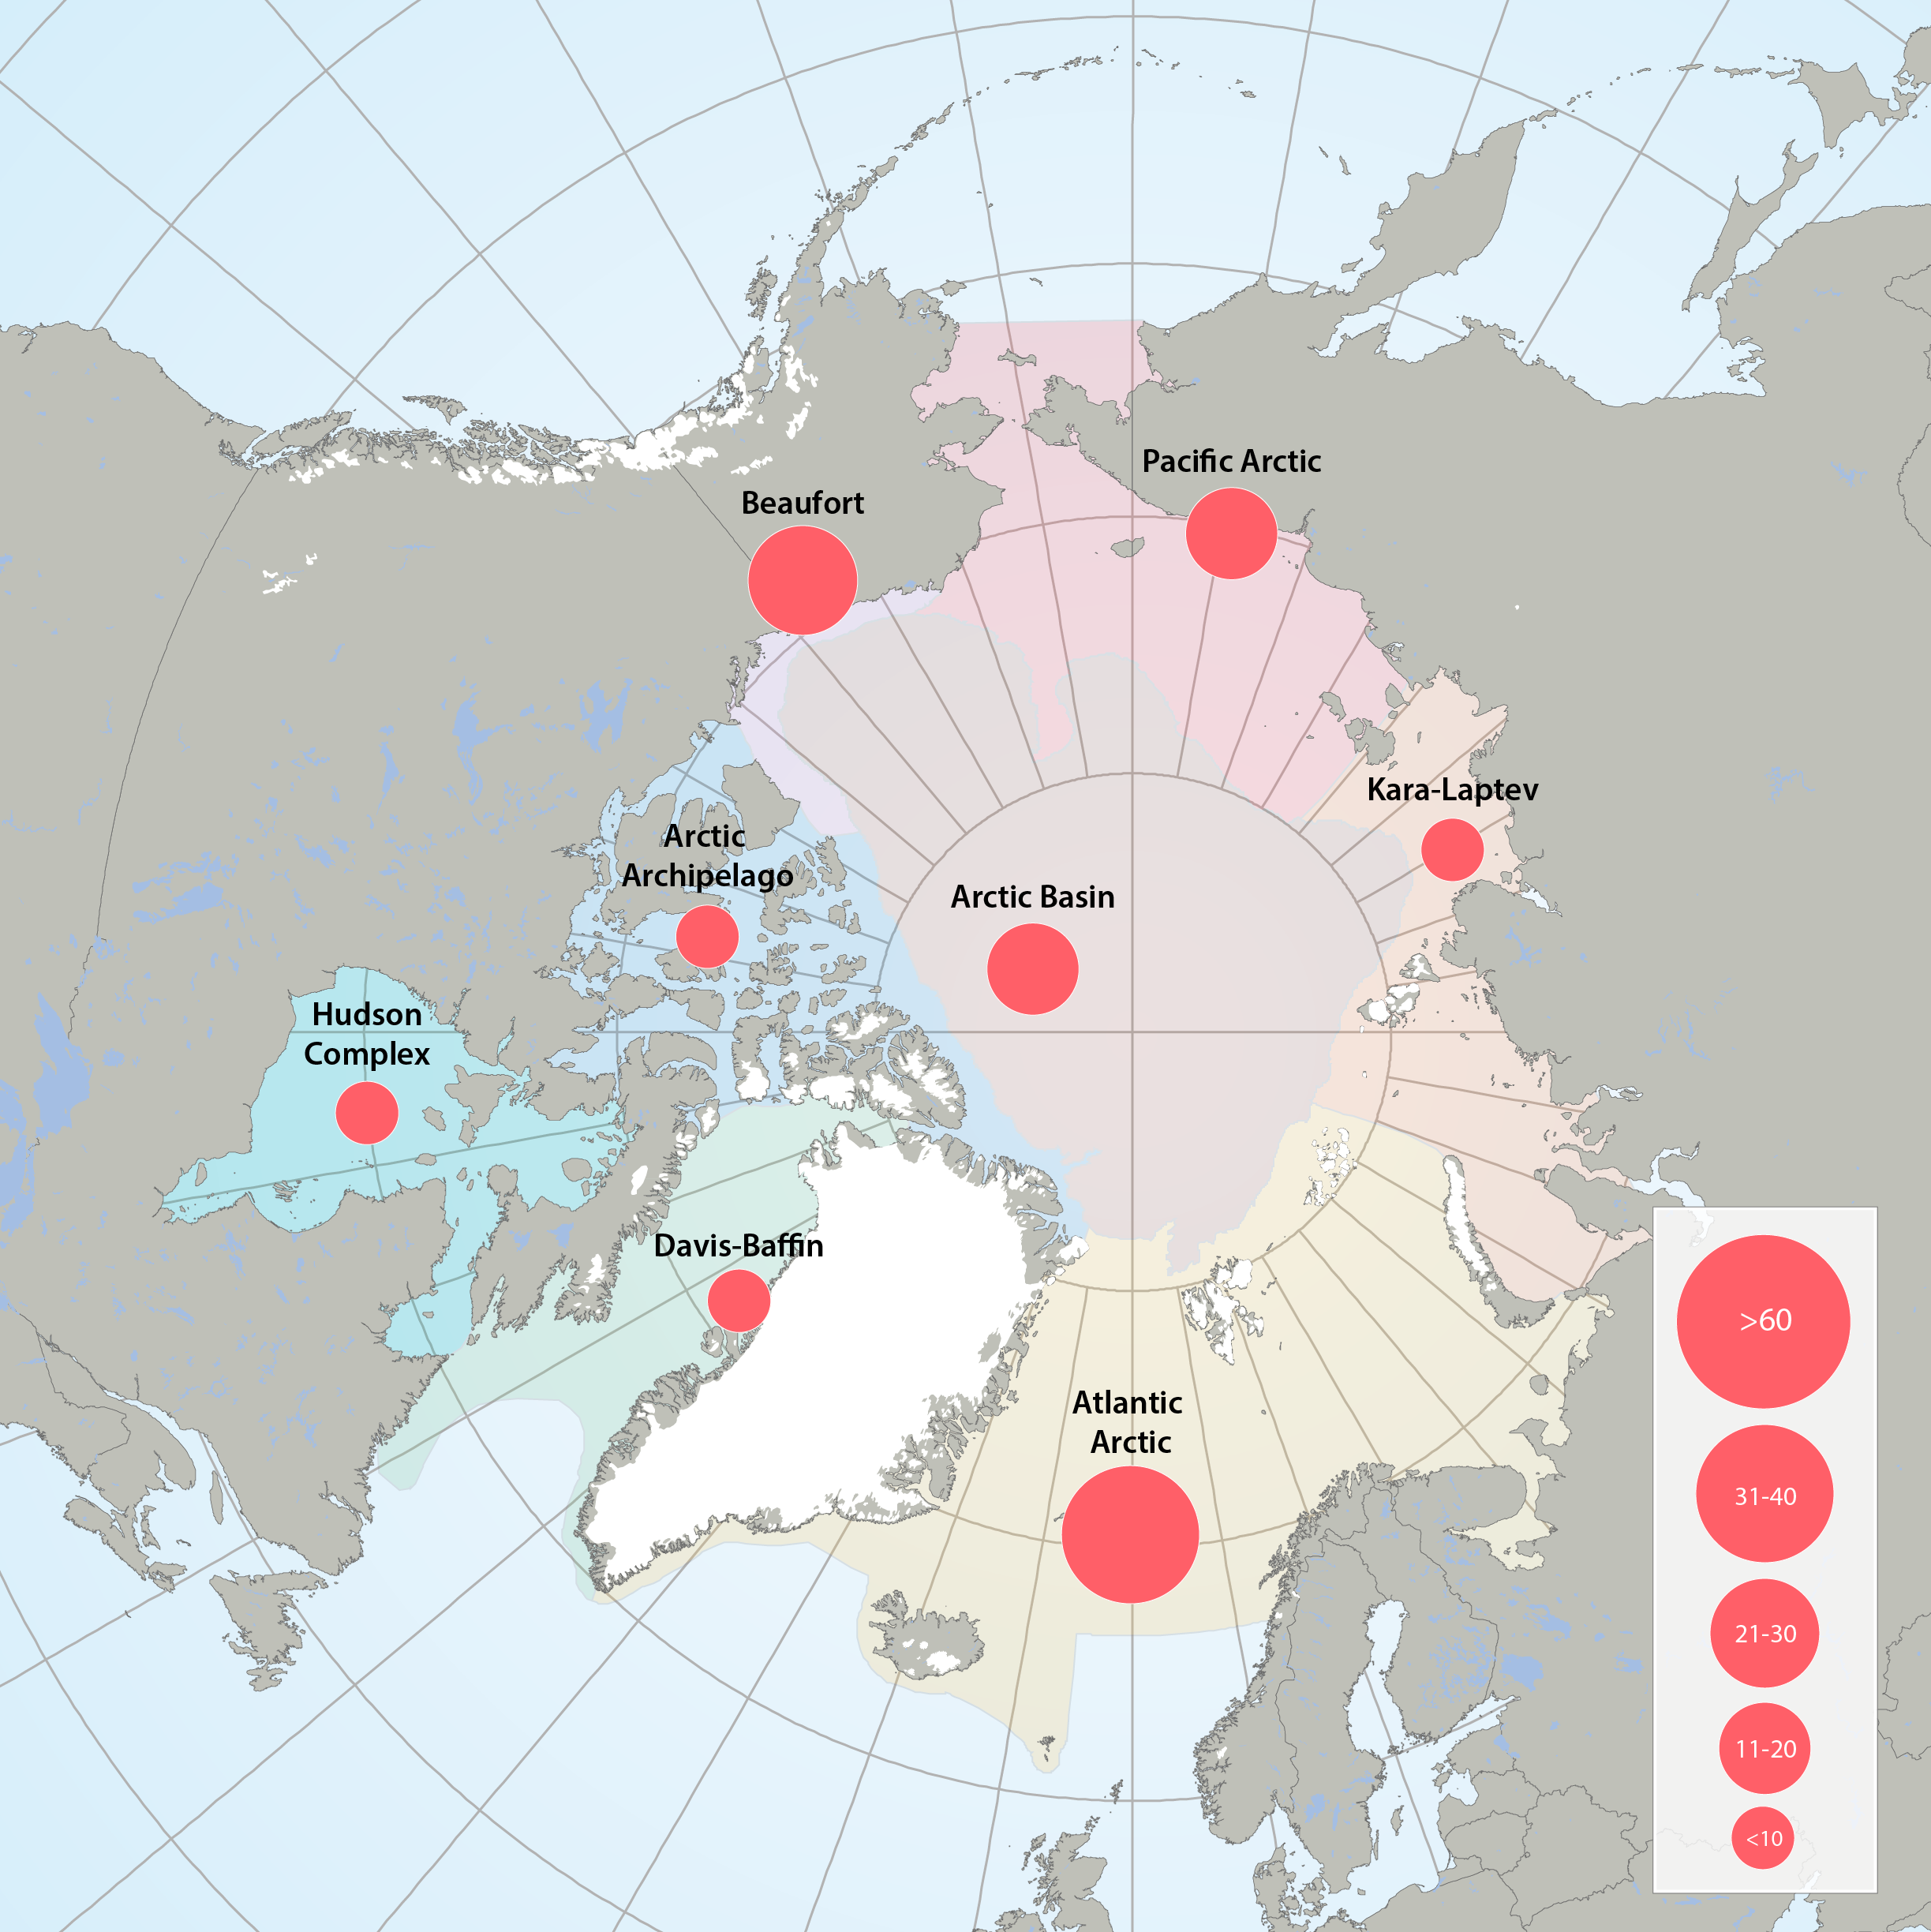
Figure 3.2.1a: Map of high throughput sequencing records from the Arctic Marine Areas. Figure 3.2.1b: Map of records of phytoplankton taxa using microscopy from the Arctic Marine Areas. STATE OF THE ARCTIC MARINE BIODIVERSITY REPORT - <a href="https://arcticbiodiversity.is/findings/plankton" target="_blank">Chapter 3</a> - Page 35 - Figure 3.2.1a and Figure 3.2.1b In terms of stations sampled, the greatest sampling effort of high-throughput sequencing in Arctic marine water columns, by far, has been in the Beaufort Sea/Amundsen Gulf region and around Svalbard. High through-put sequencing has also been used on samples from the Chukchi Sea, Canadian Arctic Archipelago, Baffin Bay, Hudson Bay, the Greenland Sea and Laptev Sea.
-

Changes in phytoplankton abundance and community composition have the potential to impact the entire food web and alter ecosystem productivity and biogeochemical cycles. Recognizing its importance, Fisheries and Oceans Canada (DFO) established a phytoplankton monitoring program on the Pacific coast of Canada based on phytoplankton pigment measurements. Phytoplankton pigments (chlorophylls and carotenoids) and ancillary data are collected annually on DFO cruises at multiple locations in waters of the northeast subarctic Pacific and the west coast of Canada. Water samples are collected at discrete depths in the upper layer and analyzed by high-performance liquid chromatography (HPLC).
-

Phytoplankton pigments, determined by high-performance liquid chromatography (HPLC) are measured seasonally along a 20-station transect in the Juan de Fuca / Strait of Georgia Basin. Sampling was initiated in 2004, discontinued in 2012 and restarted in 2015. In addition, occasional sampling is carried out at several locations and times in inland waters. For data inquiries please contact: Angelica Pena for data from 2004 to 2015 and Nina Nemcek for data from 2015 to present.
-

Phytoplankton pigments, determined by high-performance liquid chromatography (HPLC) have been measured on DFO La Perouse cruises since 2011. Surface samples are taken along a series of transects off the west coast of Vancouver Island twice a year usually in May/June and early September.
-
Bay-scale empirical demonstrations of how bivalve aquaculture alters plankton composition, and subsequently ecological functioning and higher trophic levels, are lacking. Temporal, inter- and within-bay variation in hydrodynamic, environmental, and aquaculture pressure limit efficient plankton monitoring design to detect bay-scale changes and inform aquaculture ecosystem interactions. Here, we used flow cytometry to investigate spatio-temporal variations in bacteria and phytoplankton (< 20 µm) composition in four bivalve aquaculture embayments. We observed higher abundances of bacteria and phytoplankton in shallow embayments that experienced greater freshwater and nutrient inputs. Depleted nutrient conditions may have led to the dominance of picophytoplankton cells, which showed strong within-bay variation as a function of riverine vs freshwater influence and nutrient availability. Although environmental forcings appeared to be a strong driver of spatio-temporal trends, results showed that bivalve aquaculture may reduce near-lease phytoplankton abundance and favor bacterial growth. We discuss aquaculture pathways of effects such as grazing, benthic-pelagic coupling processes, and microbial biogeochemical cycling. Conclusions provide guidance on optimal sampling considerations using flow cytometry in aquaculture sites based on embayment geomorphology and hydrodynamics. Cite this data as: Sharpe H, Lacoursière-Roussel A, Barrell J (2024). Monitoring bay-scale bivalve aquaculture ecosystem interactions using flow cytometry. Version 1.2. Fisheries and Oceans Canada. Samplingevent dataset. https://ipt.iobis.org/obiscanada/resource?r=monitoring_bay-scale_bivalve_aquaculture_ecosystem_interactions_using_flow_cytometry&v=1.2
-
Bivalve aquaculture has direct and indirect effects on plankton communities, which are highly sensitive to short-term (seasonal, interannual) and long-term climate changes, although how these dynamics alter aquaculture ecosystem interactions is poorly understood. Here, we investigate seasonal patterns in plankton abundance and community structure spanning several size fractions from 0.2 µm up to 5 mm, in a deep aquaculture embayment in northeast Newfoundland, Canada. Using flow cytometry and FlowCam imaging, we observed a clear seasonal relationship between fraction sizes driven by water column stratification (freshwater input, nutrient availability, light availability, water temperature). Plankton abundance decreased proportionally with increasing size fraction, aligning with size spectra theory. Within the bay, greater mesozooplankton abundance, and a greater relative abundance of copepods, was observed closest to the aquaculture lease. No significant spatial effect was observed for phytoplankton composition. While the months of August to October showed statistically similar plankton composition and size spectra slopes (i.e., food chain efficiency) and could be used for interannual variability comparisons of plankton composition, sampling for longer periods could capture long-term phenological shifts in plankton abundance and composition related to various processes, including climate change. Conclusions provide guidance on optimal sampling to monitor and assess aquaculture pathways of effects. Cite this data as: Sharpe H, Lacoursière-Roussel A, Gallardi D (2024). Ecological insight of seasonal plankton succession to monitor shellfish aquaculture ecosystem interactions. Version 3.2. Fisheries and Oceans Canada. Sampling event dataset. https://doi.org/10.25607/2ujdvh
-

Interannual differences in taxonomic composition of phytoplankton during summer in a) Kongsfjorden and b) Rijpfjorden (Source: MOSJ, Norwegian Polar Institute). STATE OF THE ARCTIC MARINE BIODIVERSITY REPORT - <a href="https://arcticbiodiversity.is/findings/plankton" target="_blank">Chapter 3</a> - Page 74 - Figure 3.2.5
-

Phytoplankton pigments, determined by high-performance liquid chromatography (HPLC) are measured on DFO cruises three times a year in February, June, and August/September along Line P in the northeast subarctic Pacific. Sampling for phytoplankton pigments started in 2006 at the five main Line P stations and was expanded to sample at all twenty seven stations along the transect in June 2010.
 Arctic SDI catalogue