Satellite images
Type of resources
Available actions
Topics
Keywords
Contact for the resource
Provided by
Formats
Representation types
Update frequencies
status
-

The MODIS Surface Albedo and Surface Reflectance Dataset (or simply Albedo) includes times series of 10-day composite products derived at 250-m spatial resolution over Canadian territory and neighboring areas produced at the Canada Centre for Remote Sensing (CCRS) since February 2000.The datasets contain spectral and broadband reflectance’s and albedo for MODIS bands B1-B7 designed primarily for land applications. The imagery for all spectral bands was downscaled and re-projected into the Lambert Conformal Conic (LCC) projection at 250-m spatial resolution. The area size is 5,700 km × 4,800 km. The specialized MODIS processing system was developed at CCRS to fully utilize the high quality of MODIS L2 swath imagery over the northern latitudes. As such, the CCRS Albedo product is different from the standard NASA product. The differences are related to temporal and spatial scaling, shape of kernel functions employed to fit data, as well as details of scene identification, atmospheric correction, and data fitting methodology.
-
The dataset includes two data products derived from the Visible Infrared Imaging Radiometer Suite (VIIRS) imager operated by the US National Oceanic and Atmospheric Administration (NOAA) onboard Suomi National Polar-Orbiting Partnership (SNPP) satellite: 1) Normalized Difference Vegetation Index (NDVI) 2) Snow Mask (Snow) with supplementary information about data quality and scene identification Each product, NDVI and Snow, has been derived at two spatial resolutions: 1) I-band resolution for 250-m spatial grid (VIIRS image bands I1 and I2) 2) M-band resolution for 500-m spatial grid (VIIRS moderate resolution bands M5 and M7) Datasets are produced with a daily temporal frequency, i.e. one file per day. The study area with the size of 5,700 km × 4,800 km covers Canada and neighboring regions (Trishchenko, 2019). The VIIRS time series are produced from VIIRS /SNPP imagery at CCRS from January 1, 2017.
-

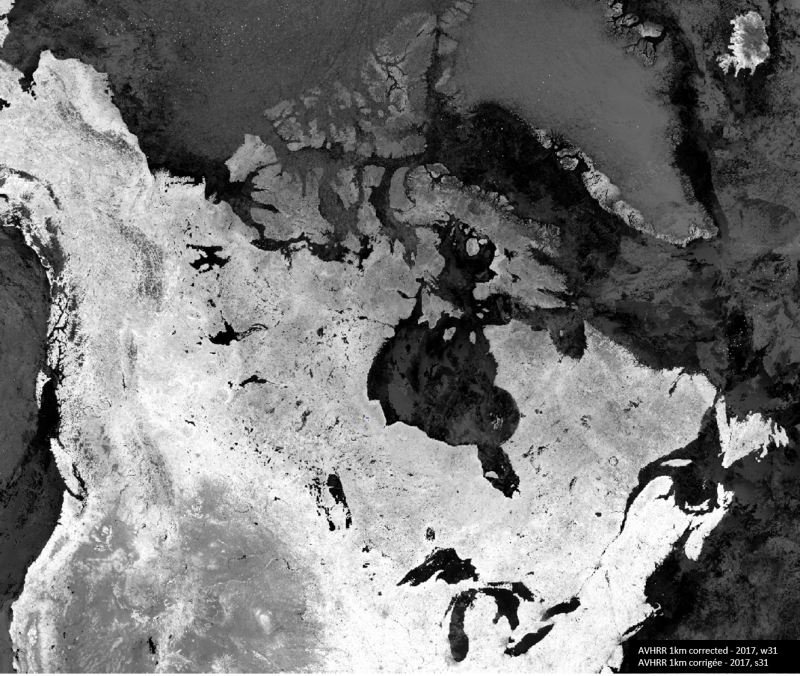
The cloud-corrected representation of the NDVI using historical AVHRR and VIIRS satellite images at 1 kilometre resolution provides reliable, objective and timely information on the state of vegetation throughout Canada and the northern United States. The methodology applied to the images has remained the same as for the program formerly known as the Crop Condition Assessment Program (CCAP). Since 1987, the National Oceanic and Atmospheric Administration (NOAA) series of satellites carrying the Advanced Very High-Resolution Radiometer (AVHRR) records images of the entire Earth's surface twice a day at 1kilometre resolution. This sensor captures two spectral bands (red and infrared) that have proven to be extremely useful for vegetation monitoring to produce the Normalized Difference Vegetation Index (NDVI). NDVI image composites on crop condition were produced by GeoManitoba until the end of the 2020 growing season. In 2021, Statistics Canada started producing the weekly composites using an application developed by Dr. Rasim Latifovic from National Resources Canada. Since 2022, due to the aging AVHRR sensor affecting the quality of the weekly composites, the team has transitioned to the NOAA-20 - Visible Infrared Imaging Radiometer Suite (VIIRS) satellite. VIIRS is a new-generation satellite with spectral characteristics comparable to those of its predecessor. To keep the NDVI values stable and continuous throughout the time series, the VIIRS composite values are normalized to obtain comparable NDVI values. Additional computations were performed by Statistics Canada for Julian weeks 15 to 41 to remove residual clouds from the NDVI composites and statistical extractions by geographic regions using three different types of agricultural masks. This dataset gives access to AVHRR images from 1987 to mid-2022 and VIIRS images from mid-2022 to present in GeoTIFF format and covers the agricultural land during the growing season of the field crops in Canada (Julian weeks 15 to 41). It also provides access to a database that contains the statistical NDVI by geographic regions (Townships, Census Consolidated Subdivisions (CCS), Census Divisions (CD) and Census Agricultural Regions (CAR)) and agricultural masks (Agriculture (AGR), Crop (CROP) and Pasture (PAS)).
-

The cloud-corrected NDVI data extracted from historical MODIS satellite images at 250 metre resolution provides reliable, objective, and timely information on the state of vegetation throughout Canada and the northern United States. The methodology applied to the images has remained the same as for the program formerly known as the Crop Condition Assessment Program (CCAP). Since the 2000 growing season, Statistics Canada has been processing and compiling MODerate-resolution Imaging Spectoradiometer (MODIS) data (250 metre resolution). The Multi-Spectral Instrument (MSI) captures two spectral bands (red and infrared) that have proven to be extremely useful to produce the Normalized Difference Vegetation Index (NDVI) utilized for vegetation monitoring. The original NDVI image composites were produced by Agriculture and Agri-Food Canada (link to original data in the resources section). Additional computations were completed by Statistics Canada to remove the effects of residual clouds and to calculate and extract the NDVI by geographic region. This dataset provides access to the MODIS images from 2000 to present in GeoTIFF format and covers the crop area during the growing season (Julian weeks 15 to 37; mid-April to mid-September). It also provides access to a database that contains the statistical NDVI by geographic regions (Townships, Census Consolidated Subdivisions (CCS), Census Divisions (CD) and Census Agricultural Regions (CAR)) and agricultural masks (Agriculture (AGR), Crop (CROP) and Pasture (PAS)).
-

These products are derived from RGB (red/green/blue) images, a satellite processing technique that uses a combination of satellite sensor bands (also called channels) and applies a red/green/blue (RGB) filter to each of them. The result is a false-color image, i.e. an image that does not correspond to what the human eye would see, but offers high contrast between different cloud types and surface features. The on-board sensor of a weather satellite obtains two basic types of information: visible light data (reflected light) reflecting off clouds and different surface types, also known as "reflectance", and infrared data (emitted radiation) which are short-wave and long-wave radiation emitted by clouds and surface features. RGBs are specially designed to combine this type of satellite data, resulting in an information-rich final product. Other products are based on the enhancement of channel data for a single wavelength, also aimed at highlighting meteorological features of the observed surface or clouds, but in a simpler way since only a single wavelength is involved. This older approach is still useful today, as its simplicity makes image interpretation easier in some cases.
-

These products are derived from RGB (red/green/blue) images, a satellite processing technique that uses a combination of satellite sensor bands (also called channels) and applies a red/green/blue (RGB) filter to each of them. The result is a false-color image, i.e. an image that does not correspond to what the human eye would see, but offers high contrast between different cloud types and surface features. The on-board sensor of a weather satellite obtains two basic types of information: visible light data (reflected light) reflecting off clouds and different surface types, also known as "reflectance", and infrared data (emitted radiation) which are long-wave radiations emitted by clouds and surface features. RGBs are specially designed to combine this type of satellite data, resulting in an information-rich final product. Four types of products are currently generated from the GOES-West and GOES-East satellites: "NightIR" and "NightMicrophysics", at 2km resolution, are generated 24 hours a day with infrared channels, so are visible both night and day, and "NaturalColour" and "DayCloudConvection", at 1km resolution, which combine visible light channels with infrared channels; their higher resolution makes the latter two products more popular, but they are not available during most of the night (between 02UTC and 07UTC for GOES-Est, and between 06UTC and 11UTC for GOES-Ouest) given the absence of reflected sunlight. Other RGB products should be added gradually in the future to meet different needs.
-

The "Starter Kits" of the Canadian Geospatial Data Infrastructure (CGDI) are curated bundles of geospatial data delivered as a service. These kits are the result of a user needs assessment commissioned by Natural Resources Canada (NRCan), with a primary focus on addressing the specific requirements of Indigenous Peoples. Within these kits, you'll discover a selection of data provided as a service from a collection of over 71,000 datasets falling under the "Nature and Environment" category sourced from CGDI's Federal and Provincial/Territorial partners. These Starter Kits have been thoughtfully crafted into four thematic or geographic areas of Canada: a) British Columbia, b) Northwest Territories, c) Climate Change across Canada, d) And Water Resources across Canada. Each of these kits represents diverse areas and data categories, offering new users a compact, comprehensive, and user-friendly gateway to explore a wide array of information provided by the CGDI.
 Arctic SDI catalogue