 Arctic SDI catalogue
Température
Type of resources
Available actions
Keywords
Contact for the resource
Provided by
Years
Formats
Representation types
Update frequencies
status
Service types
-

Contained within the 5th Edition (1978 to 1995) of the National Atlas of Canada has a large that shows the extent of permafrost and abundance of ground ice; mapping units are based on physiographic regions. Point data on map give permafrost temperature and thickness for specific sites. The second, smaller, map shows the mean annual ground temperatures. Graphs show four shallow temperature profiles (to 25 metres depth), and four deep temperature profiles (to several hundred metres depth). Heginbottom, J. A., Dubreuil, M. -A. & Harker, P. (1995). Canada, permafrost. In The National Atlas of Canada (5 ed.). Natural Resources Canada, Geomatics Canada, MCR Series, 4177, Natural Resources Canada. https://doi.org/10.4095/294672
-
The impact of climatic variability on the environment is of great importance to the agricultural sector in Canada. Monitoring the impacts on water supplies, soil degradation and agricultural production is essential to the preparedness of the region in dealing with possible drought and other agroclimate risks. Derived normal climate data represent 30-year averages (1961-1990, 1971-2000, 1981-2010, 1991-2020) of climate conditions observed at a particular location. The derived normal climate data represents 30-year averages or “normals” for precipitation, temperature, growing degree days, crop heat units, frost, and dry spells. These normal trends are key to understanding agroclimate risks in Canada. These normal can be used as a baseline to compare against current conditions, and are particularly useful for monitoring drought risk.
-

Monthly 30-year Average Minimum Temperature represents the average monthly minimum temperature calculated at a given location averaged across a 30 year period (1961-1991, 1971-2000, 1981-2010, 1991-2020). These values are calculated across Canada in 10x10 km cells.
-

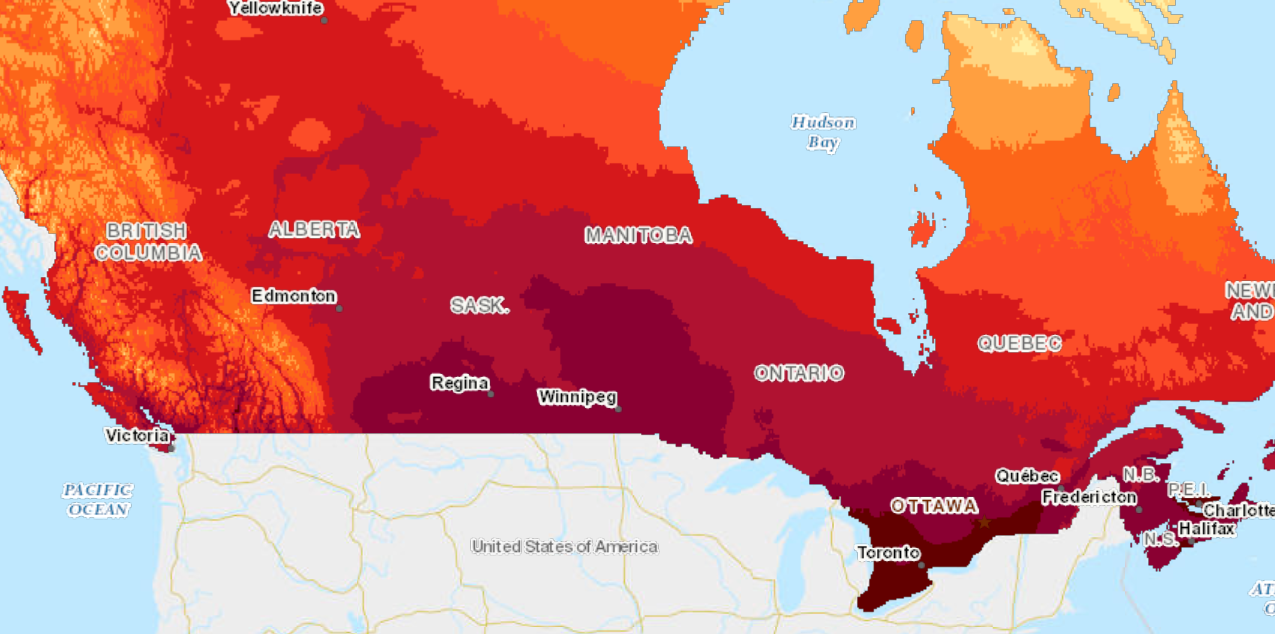
Monthly 30-year Average Maximum Temperature represents the average monthly maximum temperature calculated for a given location averaged across a 30 year period (1961-1991, 1971-2000, 1981-2010, 1991-2020). These values are calculated across Canada in 10x10 km cells.
-
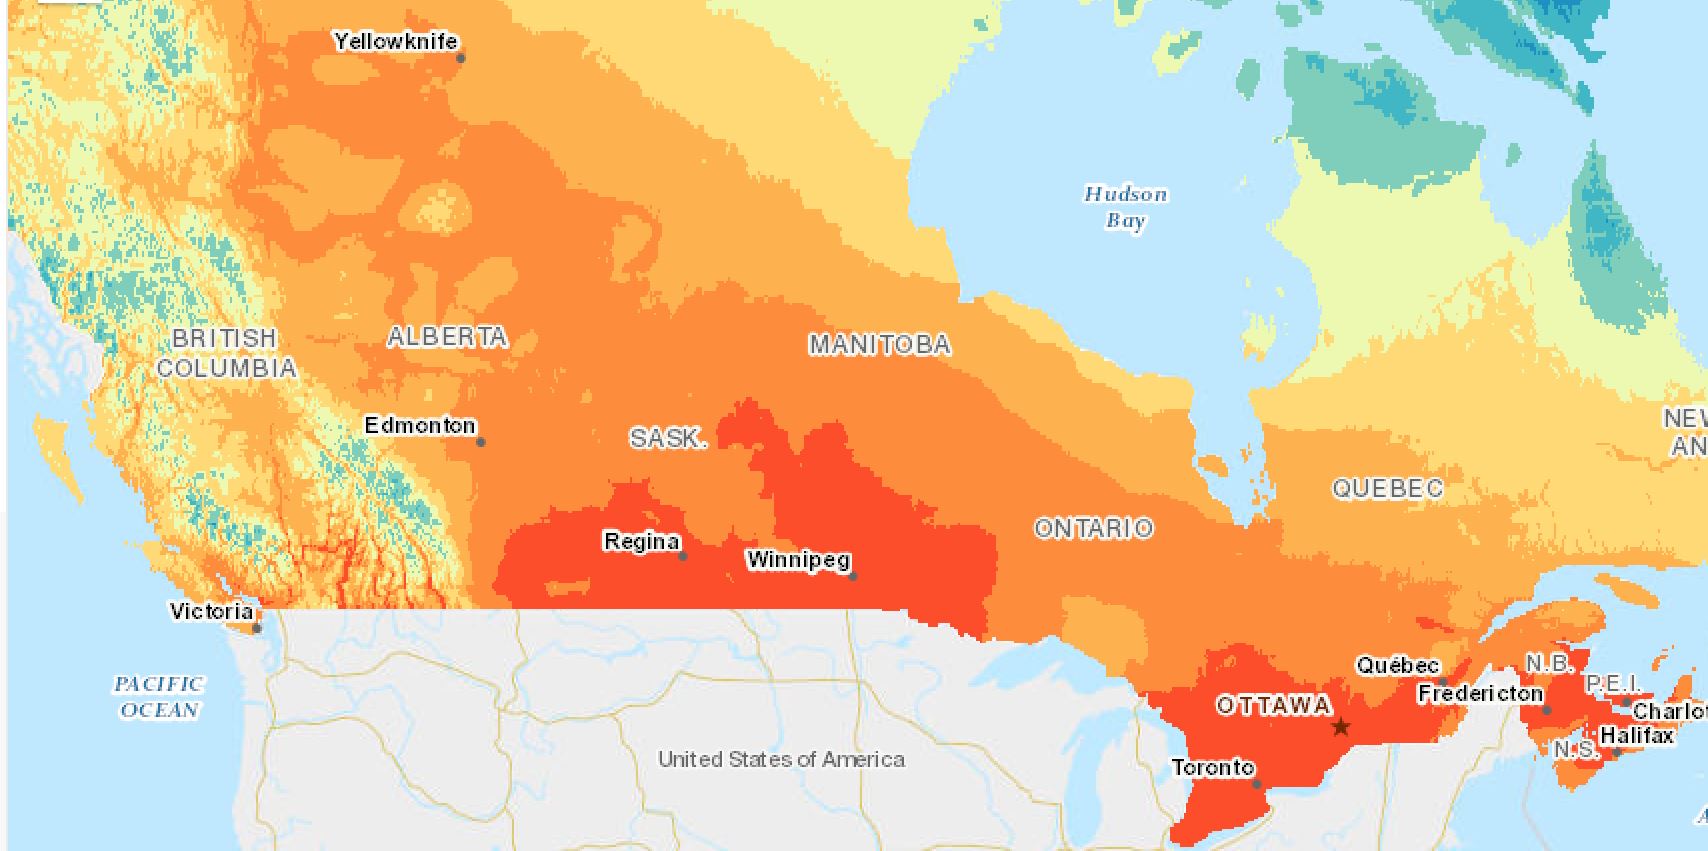
Monthly 30-year Average Mean Temperature represents the average monthly mean temperature calculated at a given location averaged across a 30 year period (1961-1991, 1971-2000, 1981-2010, 1991-2020). These values are calculated across Canada in 10x10 km cells.
-
Crop/Corn Heat Units (CHU) is a temperature-based index often used by farmers and agricultural researchers to estimate whether the climate is warm enough to grow corn. Daily crop heat units are calculated from minimum and maximum temperatures with separate calculations for day and night. The daytime relationship sets the minimum at 10 C for growth up to a maximum of 30 C, beyond which growth slows. These values are calculated across Canada in 10x10 km cells.
-

The Eastern Shore Islands was announced as an "Area of Interest" (AOI) in 2018 by the DFO Maritimes region to potentially be considered for a Marine Protected Area under the federal Oceans Act. As part of its mandate for monitoring established and potential conservation areas, DFO Science regularly deploys instruments including conductivity/temperature/depth (CTD) loggers, and other instruments for measuring dissolved oxygen, nutrients, and other chemical ocean properties. This data collection includes temperature and other oceanographic records for the ESI AOI from June 2024 onward. The data are derived from temperature loggers (Hobo Tidbit loggers or similar) and Sea-Bird MicroCATs, but may in future years include current profiles or additional oceanographic data. These data will be used to monitor temperatures in this coastal region to detect any biological shifts associated with temperature and climate fluctuations, and be used to groundtruth oceanographic models. Cite this data as: Jeffery, N., Stanley, R., Pettitt- Wade, H. (2025): Data of: Baseline oceanographic records for the Eastern Shore Islands Area of Interest. Published: September 2025. Coastal Ecosystems Science Division, Fisheries and Oceans Canada, Dartmouth, N.S. https://open.canada.ca/data/en/dataset/f0020cec-5671-4908-8fdd-11fc097de99d
-

First Fall Frost (-2 °C) is defined as the average day of the second half of the year with the first occurrence of the minimum temperature of a climate day which is at or below -2 °C. These values are calculated across Canada in 10x10 km cells.
-
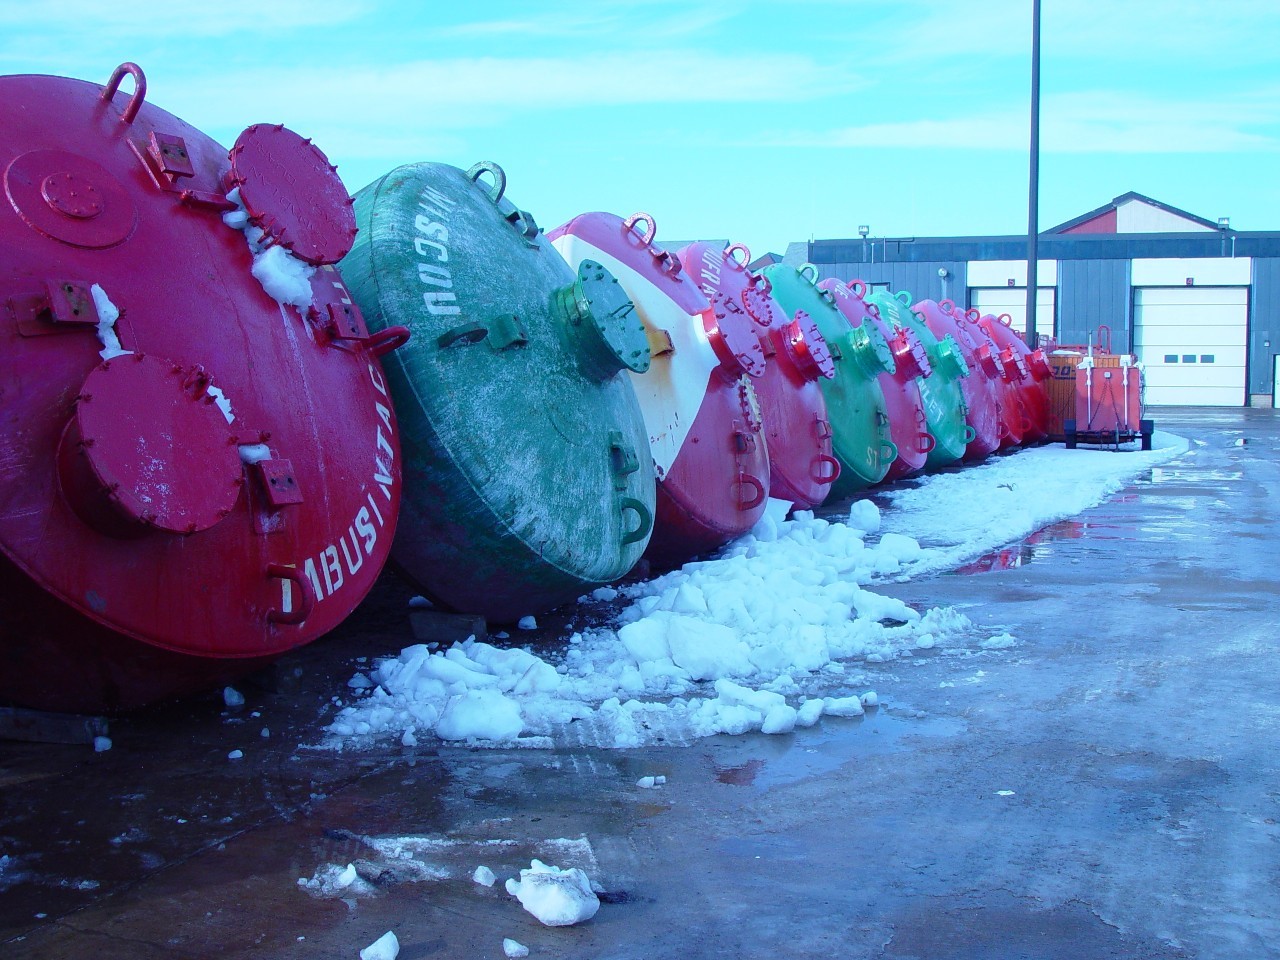
PURPOSE: The objective of the program is to gather environmental coastal data to better understand fluctuations in water temperature and its effect on coastal marine species. DESCRIPTION: Bottom and surface water temperatures are monitored in coastal waters of the southern Gulf of St. Lawrence using electronic recording devices attached to navigational buoys or moorings and set to record every two hours. PARAMETERS COLLECTED: Temperature (environmental); point (spatial). NOTES ON QUALITY CONTROL: Data are checked for irregularities. SAMPLING METHODS: Temperature recording devices are installed by fishermen, DFO staff and, since 2000, by the Canadian Coast Guard staff. USE LIMITATION: To ensure scientific integrity and appropriate use of the data, we would encourage you to contact the data custodian.
-
Percent of average precipitation represents the total amount of precipitation for a particular location over a specific time period, divided by the long-term average precipitation (1991-2020) for the same period and location, expressed as a percentage. Percent of average precipitation is to provide a clear and standardized way to compare how much precipitation has fallen during a specific time period relative to the long-term average for the same location and time period. Time periods calculated for monthly precipitation percentiles are 1, 2, 3, 6, 9, 12, 18, 24 months. Each ISO week is numbered from 1 to 52 (sometimes 53) within a year. An ISO week starts on Monday and ends on Sunday. Long-term average is 1991-2020. The National Agroclimate Series of Derived Indicators (NASDI) products provide a collection of comprehensive and regularly updated datasets on key agroclimatic variables, including accumulated precipitation, standardized precipitation index, and difference from normal temperature, among others. These datasets incorporate both real-time and historical climate information, offering enhanced insight into conditions and trends across Canada’s diverse agricultural regions.