 Arctic SDI catalogue
landslide
Type of resources
Available actions
Topics
Keywords
Contact for the resource
Provided by
Years
Formats
Representation types
Update frequencies
status
Resolution
-

The European Ground Motion Service (EGMS), part of the Copernicus Land Monitoring Service, provides consistent, regular, standardised, harmonised, and reliable information on natural and anthropogenic ground motion phenomena across Copernicus Participating States and national borders, with millimetre-level accuracy. This metadata describes the first product level of EGMS: Basic. EGMS Basic delivers InSAR displacement data in the satellite Line-of-Sight (LOS), accompanied by annotated geolocation and quality indicators for each measurement point. It is derived from full-resolution interferometric analysis of Sentinel-1 radar imagery and includes LOS velocity maps for both ascending and descending orbits. Each measurement is referenced to a local point within the processing unit, meaning ground motion values are only meaningful within that unit and cannot be directly compared across adjacent units. EGMS Basic is visualised as a vector map of measurement points, colour-coded by average LOS velocity, and distributed in comma-separated values (CSV) format. Each point includes a displacement time series, representing ground motion values for each Sentinel-1 acquisition over the monitoring period. EGMS Basic is delivered to users on an annual basis, following a five-year moving window update strategy. This means that after the Baseline/first update (2016-2021), the following data periods are available: 2018-2022, 2019-2023 and 2020-2024.
-
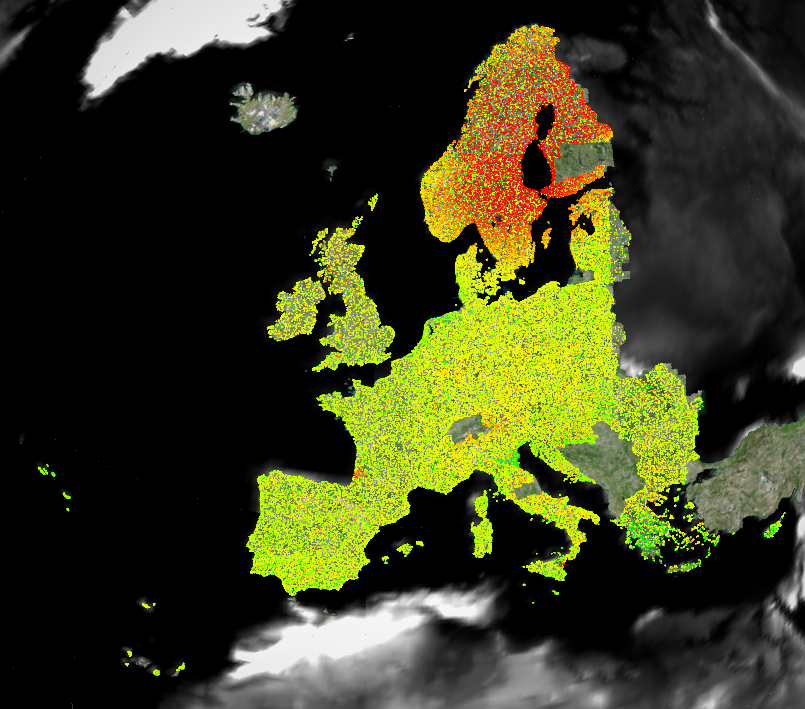
The European Ground Motion Service (EGMS), part of the Copernicus Land Monitoring Service, provides consistent, regular, standardised, harmonised, and reliable information on natural and anthropogenic ground motion phenomena across Copernicus Participating States and national borders, with millimetre-level accuracy. This metadata describes EGMS Ortho, the third product level in the EGMS portfolio. EGMS Ortho is derived from EGMS Calibrated through a resampling procedure onto a 100 m grid, using data from both ascending and descending satellite orbits. This process generates two distinct layers: one representing purely vertical displacements and one representing purely east-west displacements (the subject of this metadata). EGMS Ortho simplifies interpretation for non-expert users by removing the need to account for satellite viewing geometry, offering a more intuitive representation of ground motion. EGMS Ortho is visualised as a vector map of measurement points colour-coded by average velocity (vertical or east-west components) and distributed to users in comma-separated values format. Each point is associated with a time series of displacement, i.e. a plot with values of displacement per acquisition of the satellite. EGMS Ortho is delivered to users on an annual basis, following a five-year moving window update strategy. This means that after the Baseline/first update (2016-2021), the following data periods are available: 2018-2022, 2019-2023 and 2020-2024.
-

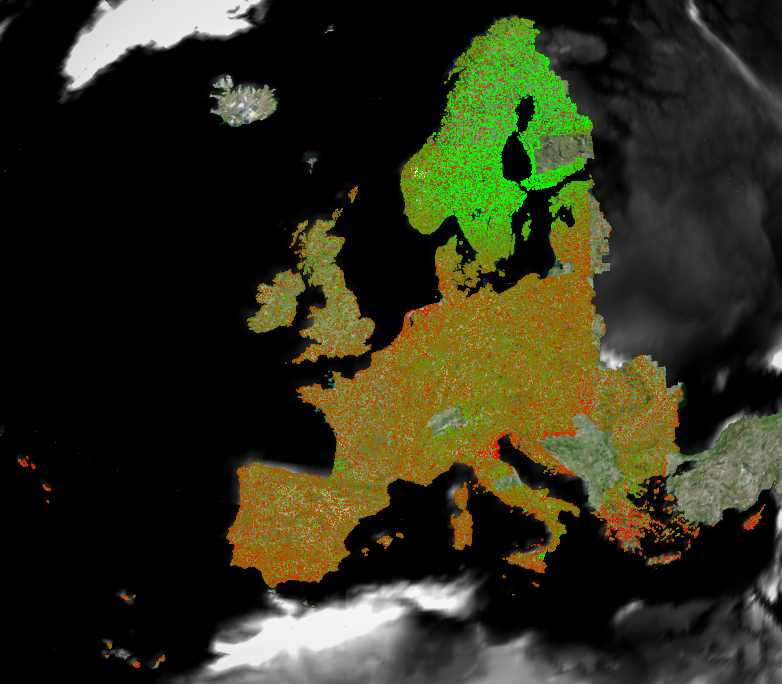
The European Ground Motion Service (EGMS), part of the Copernicus Land Monitoring Service, provides consistent, regular, standardised, harmonised, and reliable information on natural and anthropogenic ground motion phenomena across Copernicus Participating States and national borders, with millimetre-level accuracy. This metadata describes EGMS Ortho, the third product level in the EGMS portfolio. EGMS Ortho is derived from EGMS Calibrated through a resampling procedure onto a 100 m grid, using data from both ascending and descending satellite orbits. This process generates two distinct layers: one representing purely vertical displacements (the subject of this metadata) and one representing purely east-west displacements. EGMS Ortho simplifies interpretation for non-expert users by removing the need to account for satellite viewing geometry, offering a more intuitive representation of ground motion. EGMS Ortho is visualised as a vector map of measurement points colour-coded by average velocity (vertical or east-west components) and distributed to users in comma-separated values format. Each point is associated with a time series of displacement, i.e. a plot with values of displacement per acquisition of the satellite. EGMS Ortho is delivered to users on an annual basis, following a five-year moving window update strategy. This means that after the Baseline/first update (2016-2021), the following data periods are available: 2018-2022, 2019-2023 and 2020-2024.
-

The European Ground Motion Service (EGMS) is a component of the Copernicus Land Monitoring Service. EGMS provides consistent, regular, standardised, harmonised and reliable information regarding natural and anthropogenic ground motion phenomena over the Copernicus Participating States and across national borders, with millimetre accuracy. This set of metadata describes the third product level of EGMS: Ortho. to derive two further layers; one of purely vertical displacements, the other of purely east-west displacements (the one described by this metadata). Both layers are resampled to a 100 m grid. The Ortho product eases the interpretation process of non-experts since the viewing geometry has not to be considered anymore. EGMS Ortho is visualised as a vector map of measurement points colour-coded by average velocity (vertical or east-west components) and distributed to users in comma-separated values format. Each point is associated with a time series of displacement, i.e. a plot with values of displacement per acquisition of the satellite. The product covers the Copernicus Participating States and United Kingdom.
-
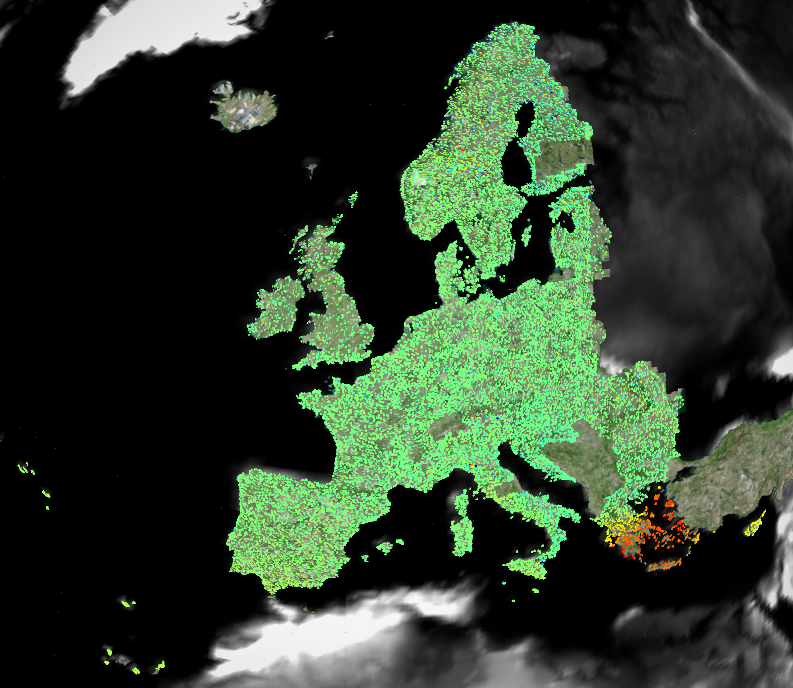
The European Ground Motion Service (EGMS) is a component of the Copernicus Land Monitoring Service. EGMS provides consistent, regular, standardised, harmonised and reliable information regarding natural and anthropogenic ground motion phenomena over the Copernicus Participating States and across national borders, with millimetre accuracy. This set of metadata describes the first product level of EGMS: Basic. The EGMS Basic - provides InSAR displacement data provided in the satellite Line-of-Sight (LOS), with annotated geo-localisation and quality measures per measurement point. This product is generated from the interferometric analysis of Sentinel-1 radar images at full resolution. It contains line of sight velocity maps in ascending and descending orbits with annotated geolocalisation and quality parameters per measurement point. The Basic product is referred to a local reference point; therefore, ground motion measurements are meaningful only within a small subset of the full product. It is not possible to compare deformation from adjacent areas belonging to different processing units of the same level. EGMS Basic is visualised as a vector map of measurement points colour-coded by average line-of-sight velocity and distributed to users in comma-separated values format. Each point is associated with a time series of displacement, i.e. a plot with values of displacement per acquisition of the satellite. The product is generated for both ascending and descending orbits. The processing of the dataset has taken place in the period from March 2024 to October 2024.
-
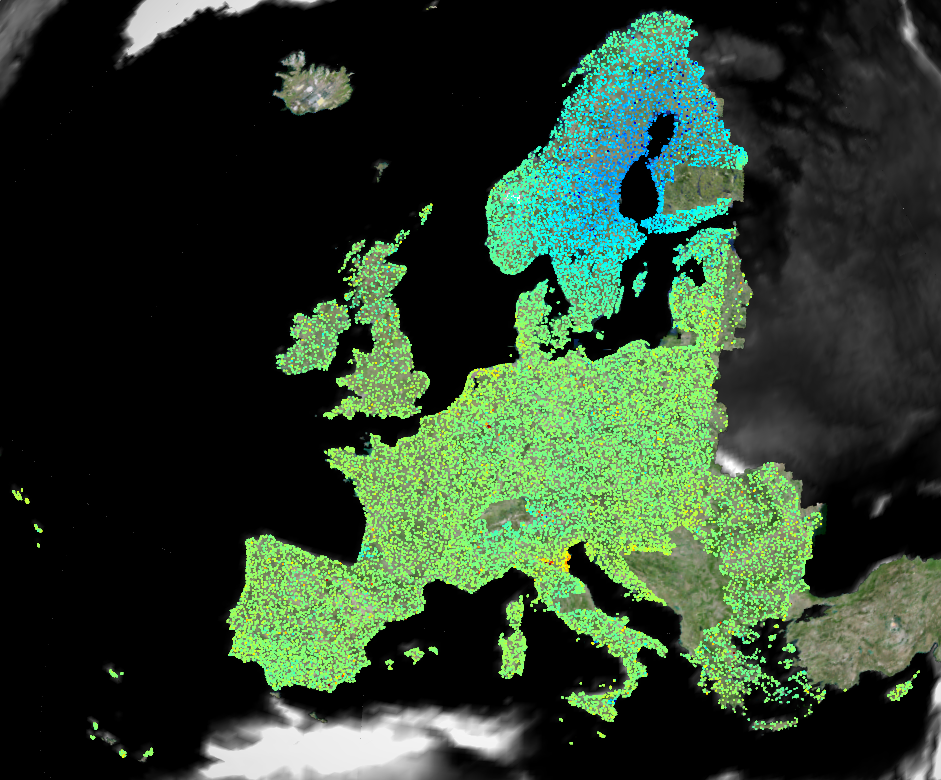
The European Ground Motion Service (EGMS) is a component of the Copernicus Land Monitoring Service. EGMS provides consistent, regular, standardised, harmonised and reliable information regarding natural and anthropogenic ground motion phenomena over the Copernicus Participating States and across national borders, with millimetre accuracy. This set of metadata describes the second product level of EGMS: Calibrated. This product is considered the main EGMS product as it serves the needs of most users. but the measurement points are referenced to a model derived from global navigation satellite system data. Thus, the measurements are not relative anymore and are considered as absolute. The calibrated product makes it possible to compare ground motion measurements from adjacent areas belonging to different products of the same level. EGMS Calibrated is visualised as a vector map of measurement points, colour-coded by average velocity, and distributed to users in comma-separated values format. Each point is associated with a time series of displacement, i.e. a plot with values of displacement per acquisition of the satellite. The product is generated for both ascending and descending orbits.
-
The European Ground Motion Service (EGMS) is a component of the Copernicus Land Monitoring Service. EGMS provides consistent, regular, standardised, harmonised and reliable information regarding natural and anthropogenic ground motion phenomena over the Copernicus Participating States and across national borders, with millimetre accuracy. This set of metadata describes the third product level of EGMS: Ortho. to derive two further layers; one of purely vertical displacements (the one described by this metadata), the other of purely east-west displacements. Both layers are resampled to a 100 m grid. The Ortho product eases the interpretation process of non-experts since the viewing geometry has not to be considered anymore. EGMS Ortho is visualised as a vector map of measurement points colour-coded by average velocity (vertical or east-west components) and distributed to users in comma-separated values format. Each point is associated with a time series of displacement, i.e. a plot with values of displacement per acquisition of the satellite.
-

The European Ground Motion Service (EGMS) is a component of the Copernicus Land Monitoring Service. EGMS provides consistent, regular, standardised, harmonised and reliable information regarding natural and anthropogenic ground motion phenomena over the Copernicus Participating States and across national borders, with millimetre accuracy. This set of metadata describes the third product level of EGMS: Ortho. to derive two further layers; one of purely vertical displacements, the other of purely east-west displacements (the one described by this metadata). Both layers are resampled to a 100 m grid. The Ortho product eases the interpretation process of non-experts since the viewing geometry has not to be considered anymore. EGMS Ortho is visualised as a vector map of measurement points colour-coded by average velocity (vertical or east-west components) and distributed to users in comma-separated values format. Each point is associated with a time series of displacement, i.e. a plot with values of displacement per acquisition of the satellite. The product covers the Copernicus Participating States and United Kingdom.
-

The European Ground Motion Service (EGMS), part of the Copernicus Land Monitoring Service, provides consistent, regular, standardised, harmonised, and reliable information on natural and anthropogenic ground motion phenomena across Copernicus Participating States and national borders, with millimetre-level accuracy. This metadata describes EGMS Calibrated, which represents the second level of the EGMS portfolio and is considered the primary product due to its broad applicability. Unlike EGMS Basic, Calibrated provides absolute measurements, referenced to a model derived from Global Navigation Satellite System (GNSS) data. This calibration enables direct comparison of ground motion measurements across adjacent areas and between different products of the same level. EGMS Calibrated is delivered as a vector map of measurement points, each colour-coded by average velocity. Data is distributed in comma-separated values (CSV) format. Each point includes a displacement time series, representing ground motion values per satellite acquisition. The product is available for both ascending and descending satellite orbits. EGMS Calibrated is delivered to users on an annual basis, following a five-year moving window update strategy. This means that after the Baseline/first update (2016-2021), the following data periods are available: 2018-2022, 2019-2023 and 2020-2024.
-

Terrestrial Ecosystem Information Project Boundaries contains boundaries (study areas) and attributes describing each project (project level metadata), plus links to the locations of other data associated with the project (e.g., reports, polygon datasets, plotfiles, legends). TEI inventories describe the physical and biological attributes of ecosystems. TEI currently includes Terrestrial Ecosystem Mapping (TEM), Predictive Ecosystem Mapping (PEM), Sensitive Ecosystems Inventory (SEI), Terrain Mapping (TER), Soil Mapping (SOIL), Species Distribution Mapping (SDM) and Wildlife Habitat Ratings (WHR) projects. Current version: v11 (published on 2024-10-03) Previous versions: v10 (published on 2023-11-14), v9 (published on 2023-03-01), v8 (published on 2016-09-01)