 Arctic SDI catalogue
soil
Type of resources
Available actions
Topics
Keywords
Contact for the resource
Provided by
Years
Formats
Representation types
Update frequencies
status
Service types
Resolution
-
The Agro-Pedological Atlas is a set of layers which show the characteristics, the fertility, the quality of the water regime, the vulnerability to degradation and the potential of the agricultural soils and land in the Monteregian region of the province of Quebec. Une version en français est disponible à http://nlwis-snite1.agr.gc.ca/cgi-bin/ogc/apaq-aapq_wms_f?service=wms&request=getcapabilities
-
The Agro-Pedological Atlas is a set of interactive maps which show the characteristics, the fertility, the quality of the water regime, the vulnerability to degradation and the potential of the agricultural soils and land in the Monteregian region of the province of Quebec.
-

The Acidic Precipitation in Ontario Study (A.P.I.O.S.) was established in 1979 by the Ontario Ministry of the Environment to protect the environment from the detrimental effects of acidic deposition and determine the effects of acidic deposition on terrestrial ecosystems. The effect of acid inputs on the environment depends on the quantity and acidity of atmospheric inputs, and the buffering capacity of the terrestrial and aquatic ecosystems. The effect of acidic precipitation on soil is potentially significant because the soil is the reservoir of plant nutrients and the source of much of the water for aquatic systems. Changes in the soil's chemistry may therefore be reflected in both the terrestrial and aquatic environments. Information on the effects of acidic precipitation on soils is available from effects near point sources of pollution, from experimentation with simulated rain solutions, from natural changes observed in soil over time, and from models and soil forming theories. Anticipated effects of soil acidification include: reduced pH, leaching of basic cations (such as magnesium and calcium) and other exchangeable plant nutrients, reduction in base saturation and cation-exchange capacity, mobilization of soil-bound metals such as aluminum, and changes in biological activity such as decreased nitrification and soil respiration. The principal objective of the baseline program is to establish a uniform data base for soils across the province. This data base * provides current data to identify future trends, * enables the development of laboratory experiments which define soil sensitivity criteria to acidic precipitation, and * provides information required for sensitivity mapping of soils throughout Ontario.
-

Polygons of Forest Soils Units, including information on drainage, slope, and aspect.
-

This dataset contains Manitoba Agriculture soil survey data at various scales ranging from highly detailed to broader reconnaissance level information. Soil is essential to human survival. We rely on it for the production of food, fibre, timber and energy crops. Together with climate, the soil determines which crops can be grown, where, and how much they will yield. In addition to supporting our agricultural needs, we rely on the soil to regulate the flow of rainwater and to act as a filter for drinking water. With such a tremendously important role, it is imperative that we manage our soils for their long-term productivity, sustainability and health. The first step in sustainable soil management is ensuring that the soil will support the land use activity. For example, only the better agricultural soils in Manitoba will support grain and vegetable production, while more marginal agricultural soils will support forage and pasture-based production. For this reason, agricultural development should only occur in areas where the soil resource will support the agricultural activity. The only way to do this is to understand the soil resource that is available. Soil survey information is the key to understanding the soil resource. Soil survey is an inventory of the properties of the soil (such as texture, internal drainage, parent material, depth to groundwater, topography, degree of erosion, stoniness, pH, and salinity) and their spatial distribution over a landscape. Soils are grouped into similar types and their boundaries are delineated on a map. Each soil type has a unique set of physical, chemical and mineralogical characteristics and has similar reactions to use and management. The information assembled in a soil survey can be used to predict or estimate the potentials and limitations of the soils’ behaviour under different uses. As such, soil surveys can be used to plan the development of new lands or to evaluate the conversion of land to new uses. Soil surveys also provide insight into the kind and intensity of land management that will be needed. The survey scale of soils data for Manitoba ranges from 1:5,000 to 1:126,720, as identified in the 'SCALE' column. This file contains soils data that has been collected at a survey intensity level of the first order. This includes data collected at a scale of 1:5,000. The survey objective at this scale is to collect high precision field scale data and it is mostly used in research plots and other highly intensive areas. It is also applicable to agricultural production and planning such as precision farming, agriculture capability, engineering, recreation, potato/irrigation suitability, and productivity indices. Profile descriptions and samples are collected for all soils. At least one soil inspection exists per delineation and the minimum size delineation is 0.25 acres. The soil taxonomy is generally Phases of Soil Series. The mapping scale is 1:5,000 or 12.7 in/ mile. This file also contains soils data that has been collected in Manitoba at a survey intensity level of the second order. This includes data collected at a scale of 1:20,000. The survey objective at this scale is to collect field scale data and it is mostly used in agricultural production and planning such as precision farming, agriculture capability, engineering, recreation, potato/irrigation suitability, and productivity indices. Soil pits are generally about 200 metres apart and are dug along transects which are about 500 metres apart. This translates to about 32 inspections sites per section(640 acres). The soils in each delineation are identified by field observations and remotely sensed data. Boundaries are verified at closely spaced intervals. Profile descriptions are collected for all major named soils and 10 inspection sites/section and 2 to 3 horizons per site require lab analyses. At least one soil inspection exists in over 90% of delineations and the minimum size delineation is generally about 4 acres at 1:20,000. The soil taxonomy is generally Phases of Soil Series. The mapping scale is 1:20,000 or 3.2 inch/ mile. This file also contains data that has been collected at the third order. This includes scales of 1:40,000 and 1:50,000.The survey objective at this scale is to collect field scale or regional data. If the topography is relatively uniform, appropriate interpretations include agriculture capability, engineering, recreation, potato/irrigation suitability, and productivity indices. Soil pits are generally dug adjacent to section perimeters. This translates to about 16 inspection sites per section(640 acres). Soil boundaries are plotted by observation and remote sensed data. Profile descriptions exist for all major named soils and 2 inspection sites/section and 2 to 3 horizons per site require lab analyses. At least one soil inspection exists in 60-80% of delineations and the minimum size delineation is generally in the 10 to 20acre range. The soil taxonomy is generally Series or Phases of Soil Series. The mapping scale is 1:40,000 or 2 inch/ mile; 1:50,000 or 1.5 inch/mile.This file also contains soils data that has been collected at a survey intensity level of the fourth order. This includes scales of 1:63,360, 1:100,000, 1:125,000, and 1:126,720.The survey objective is to collect provincial data and to provide general soil information about land management and land use. The number of soil pits dug averaged to about 6 inspections per section (640 acres). Soil boundaries are plotted by interpretation of remotely sensed data and few inspections exist. Profile descriptions are collected for all major named soils. At least one soil inspection exists in 30-60% of delineations and the minimum size delineation is 40 acres (1:63,360), 100 acres (1:100,000), 156 acres (126,700) and 623 acres (250,000). The soil taxonomy is generally phases of Subgroup or Association.As of 2022, soil survey field work and reports are still currently being collected in certain areas where detailed information does not exist. This file will be updated as more information becomes available. Typically, this is conducted on an rural municipality basis.In some areas of Manitoba, more detailed and historical information exists than what is contained in this file. However, at this time, some of this information is only available in a hard copy format. This file will be updated as more of this information is transferred into a GIS format.This file has an organizational framework similar to the original SoilAID digital files and a portion of this geographic extent was originally available on the Manitoba Land Initiative (MLI) website.Domains and coded values have also been integrated into the geodatabase files. This allows the user to view attribute information in either an abbreviated or a more descriptive manner. Choosing to display the description of the coded values allows the user to view the expanded information associated with the attribute value (reducing the need to constantly refer to the descriptions within the metadata). To change these settings in ArcCatalog, go to Customize --> ArcCatalog Options --> Tables tab --> check or uncheck 'Display coded value domain and subtype descriptions'.To change these settings in ArcMap, go to Customize --> ArcMapOptions --> Tables tab --> check or uncheck 'Display coded value domain and subtype descriptions'. This setting can also be changed by opening the attribute table, then Table Options (top left) --> Appearance --> check or uncheck 'Display coded value domain and subtype descriptions'. The file also contains field aliases, which can also be turned on or off under Table Options.This same capability is available in ArcGIS Pro.For more info:https://www.gov.mb.ca/agriculture/soil/soil-survey/importance-of-soil-survey-mb.html#
-

These Soil Mapping Data Packages include 1. a Soil Map dataset which includes the equivalents to [Soil Project Boundaries](https://catalogue.data.gov.bc.ca/dataset/soil-mapping-soil-project-boundaries), [Soil Survey Spatial View](https://catalogue.data.gov.bc.ca/dataset/soil-survey-spatial-view) mapping polygons with attributes from the [Soil Name and Layer Files](https://catalogue.data.gov.bc.ca/dataset/soil-name-and-layer-files), plus + A Soil Site dataset which includes soil pit site information and detailed soil pit descriptions and any associated lab analyses, and + The Soil Data Dictionary which documents the fields and allowable codes within the data. The Soil Map geodatabase contains the 'best available' data ranging from 1:20,000 scale to 1:250,000 scale with overlapping data removed. The choice of the datasets that remain is based on connectivity to the soil attributes (soil name and layer files), map scale and survey date. (Note: the BC Soil Landscapes of Canada (BCSLC) 1:1,000,000 data has not been included in the Soil_Map or SIFT, but is available from: [CANSIS](http://sis.agr.gc.ca/cansis/nsdb/slc/index.html). (A complete soils data package with overlapping soil survey mapping and BCSLC is available on [request](mailto:TEI_Mail@gov.bc.ca). Note that the soil survey data with attributes can also be viewed interactively in the [Soil Information Finder Tool](The Soil Map dataset is also available for interactive map viewing or as KMZs from the [Soil Information Finder Tool website](https://www2.gov.bc.ca/gov/content/environment/air-land-water/land/soil-information-finder).
-
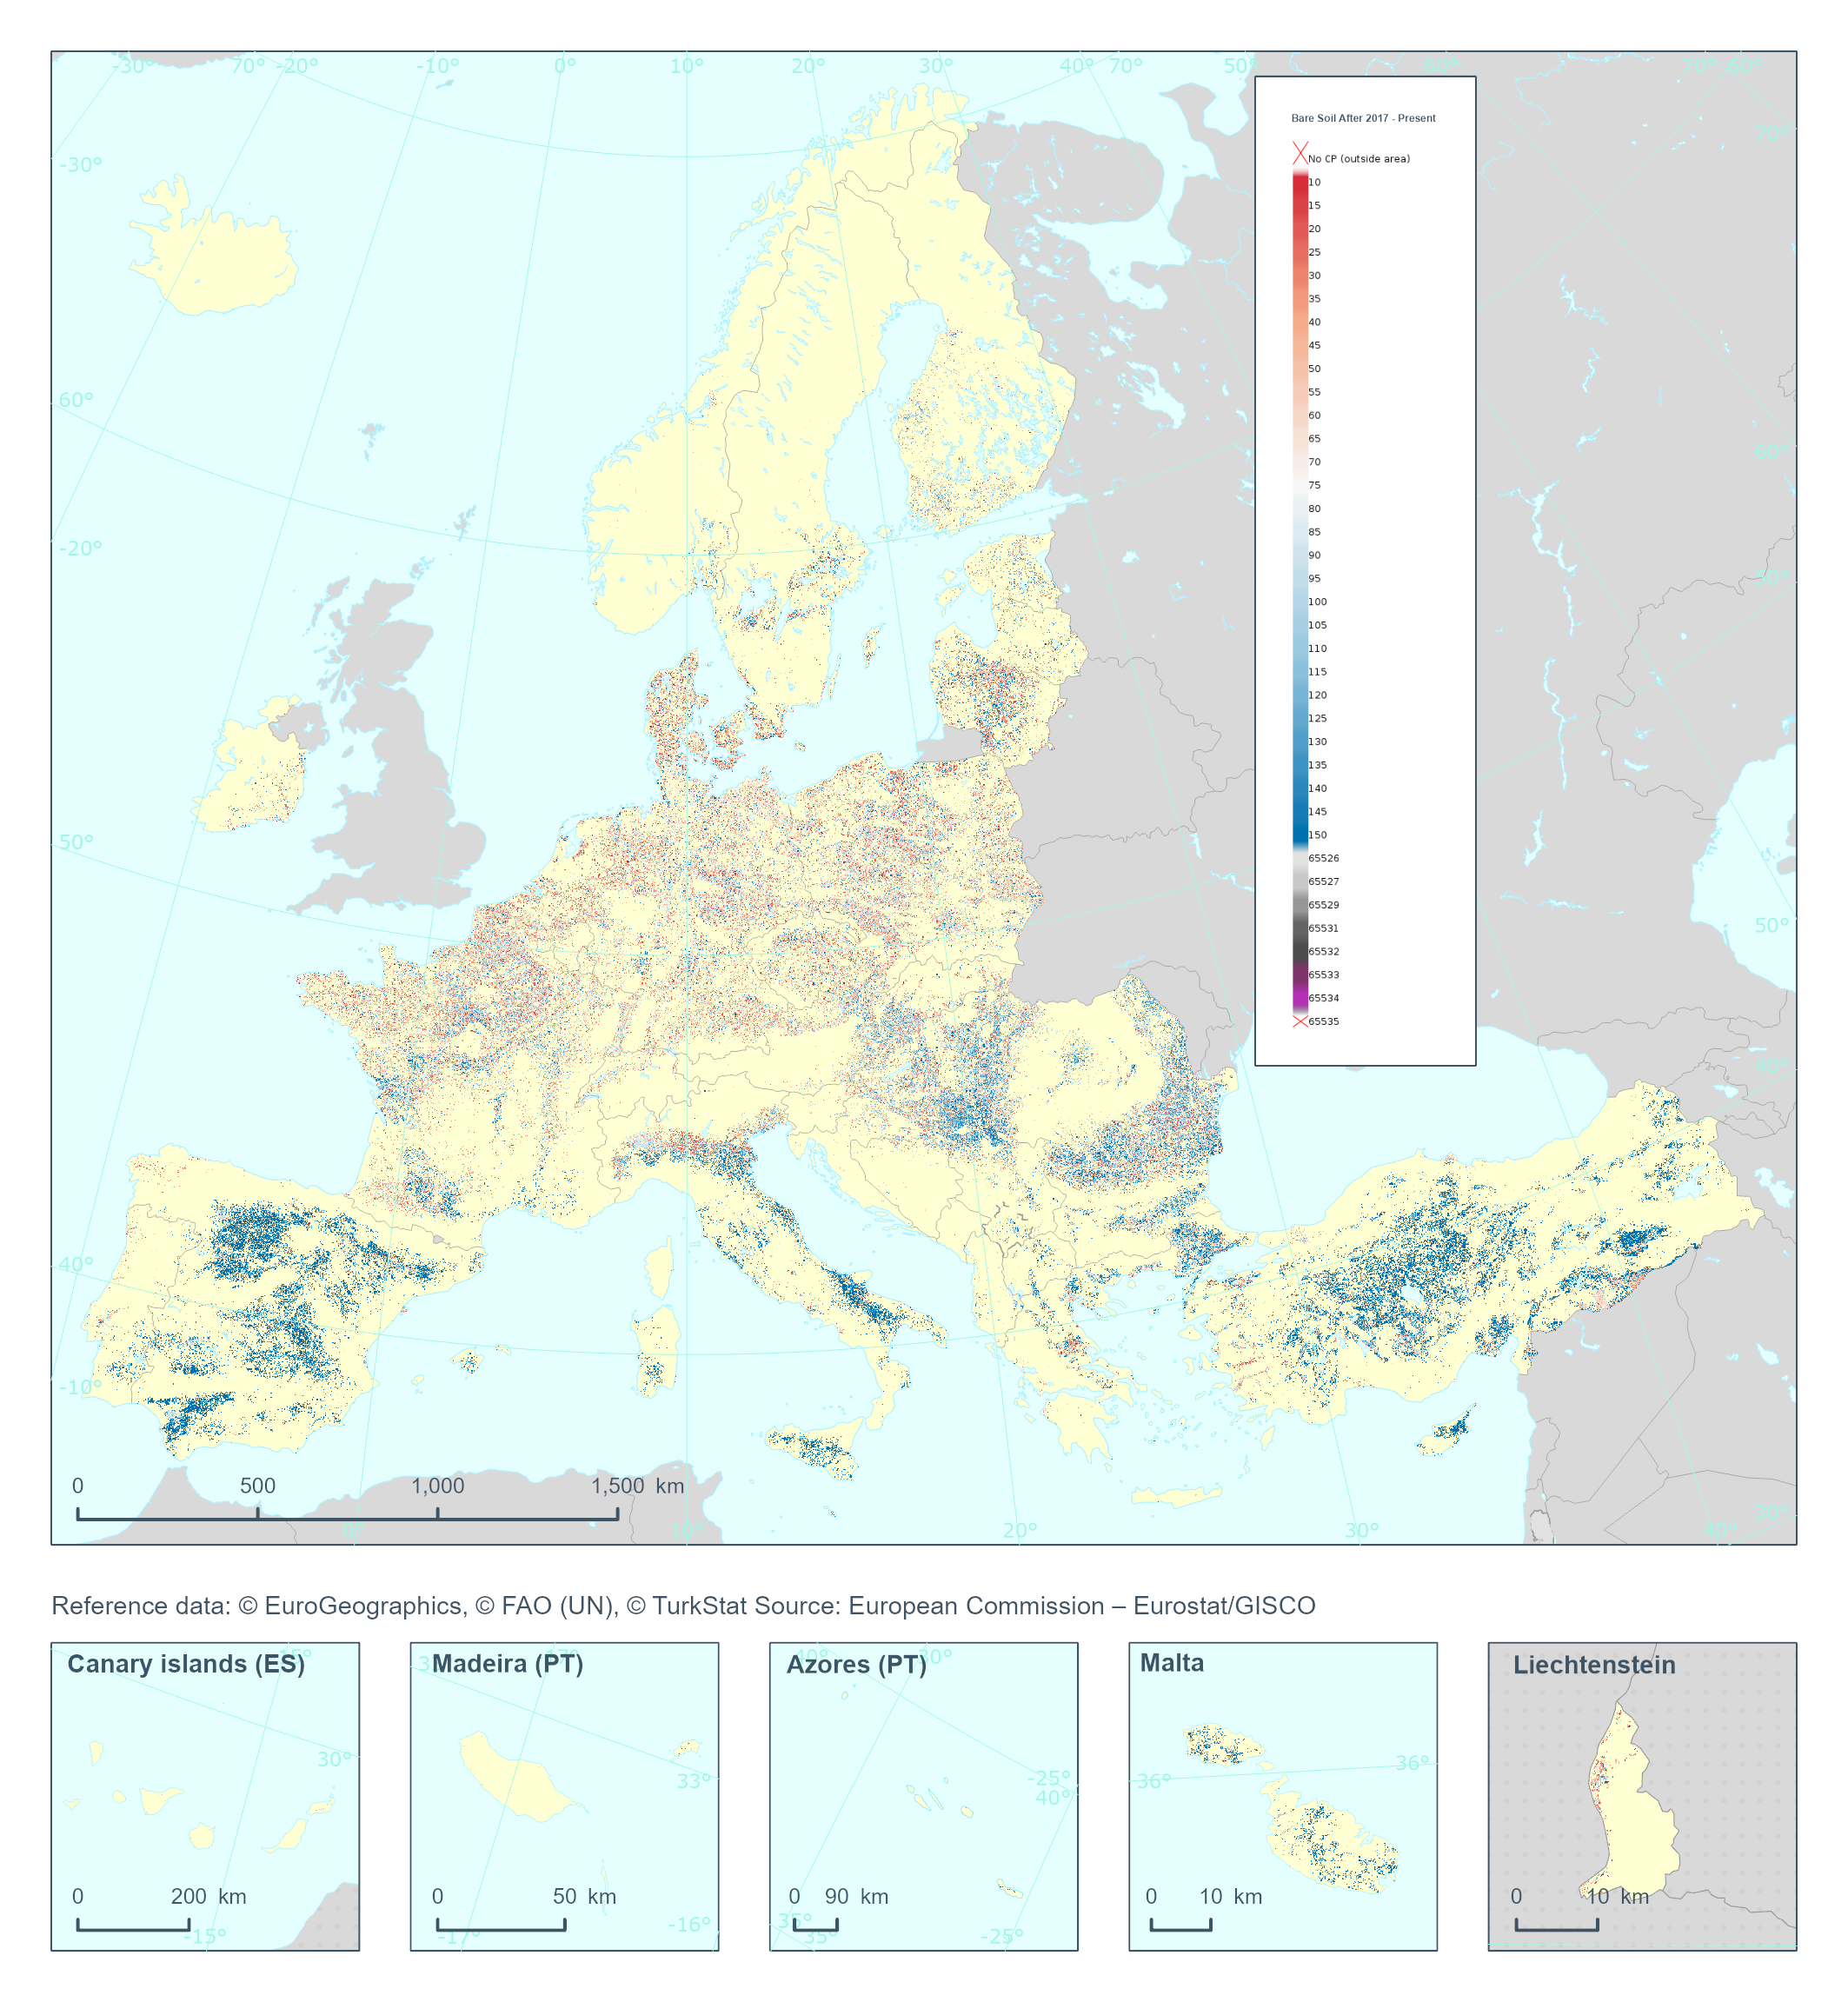
The High Resolution Layer Cropping Patterns - Bare Soil After (CPBSA) raster product provides bare soil period (in days) after the harvest of the main annual crop. Note that the bare soil period cannot transcend the calendar year for which the product is generated. This dataset is provided annually starting in 2017 with 10 meter rasters (fully conformant with the EEA reference grid) in 100 x 100 km tiles covering the EEA38 countries. High Resolution Layer Croplands product is part of the European Union’s Copernicus Land Monitoring Service. Confidence layer available for the dataset. This dataset includes data from the French Overseas Territories (DOMs)
-
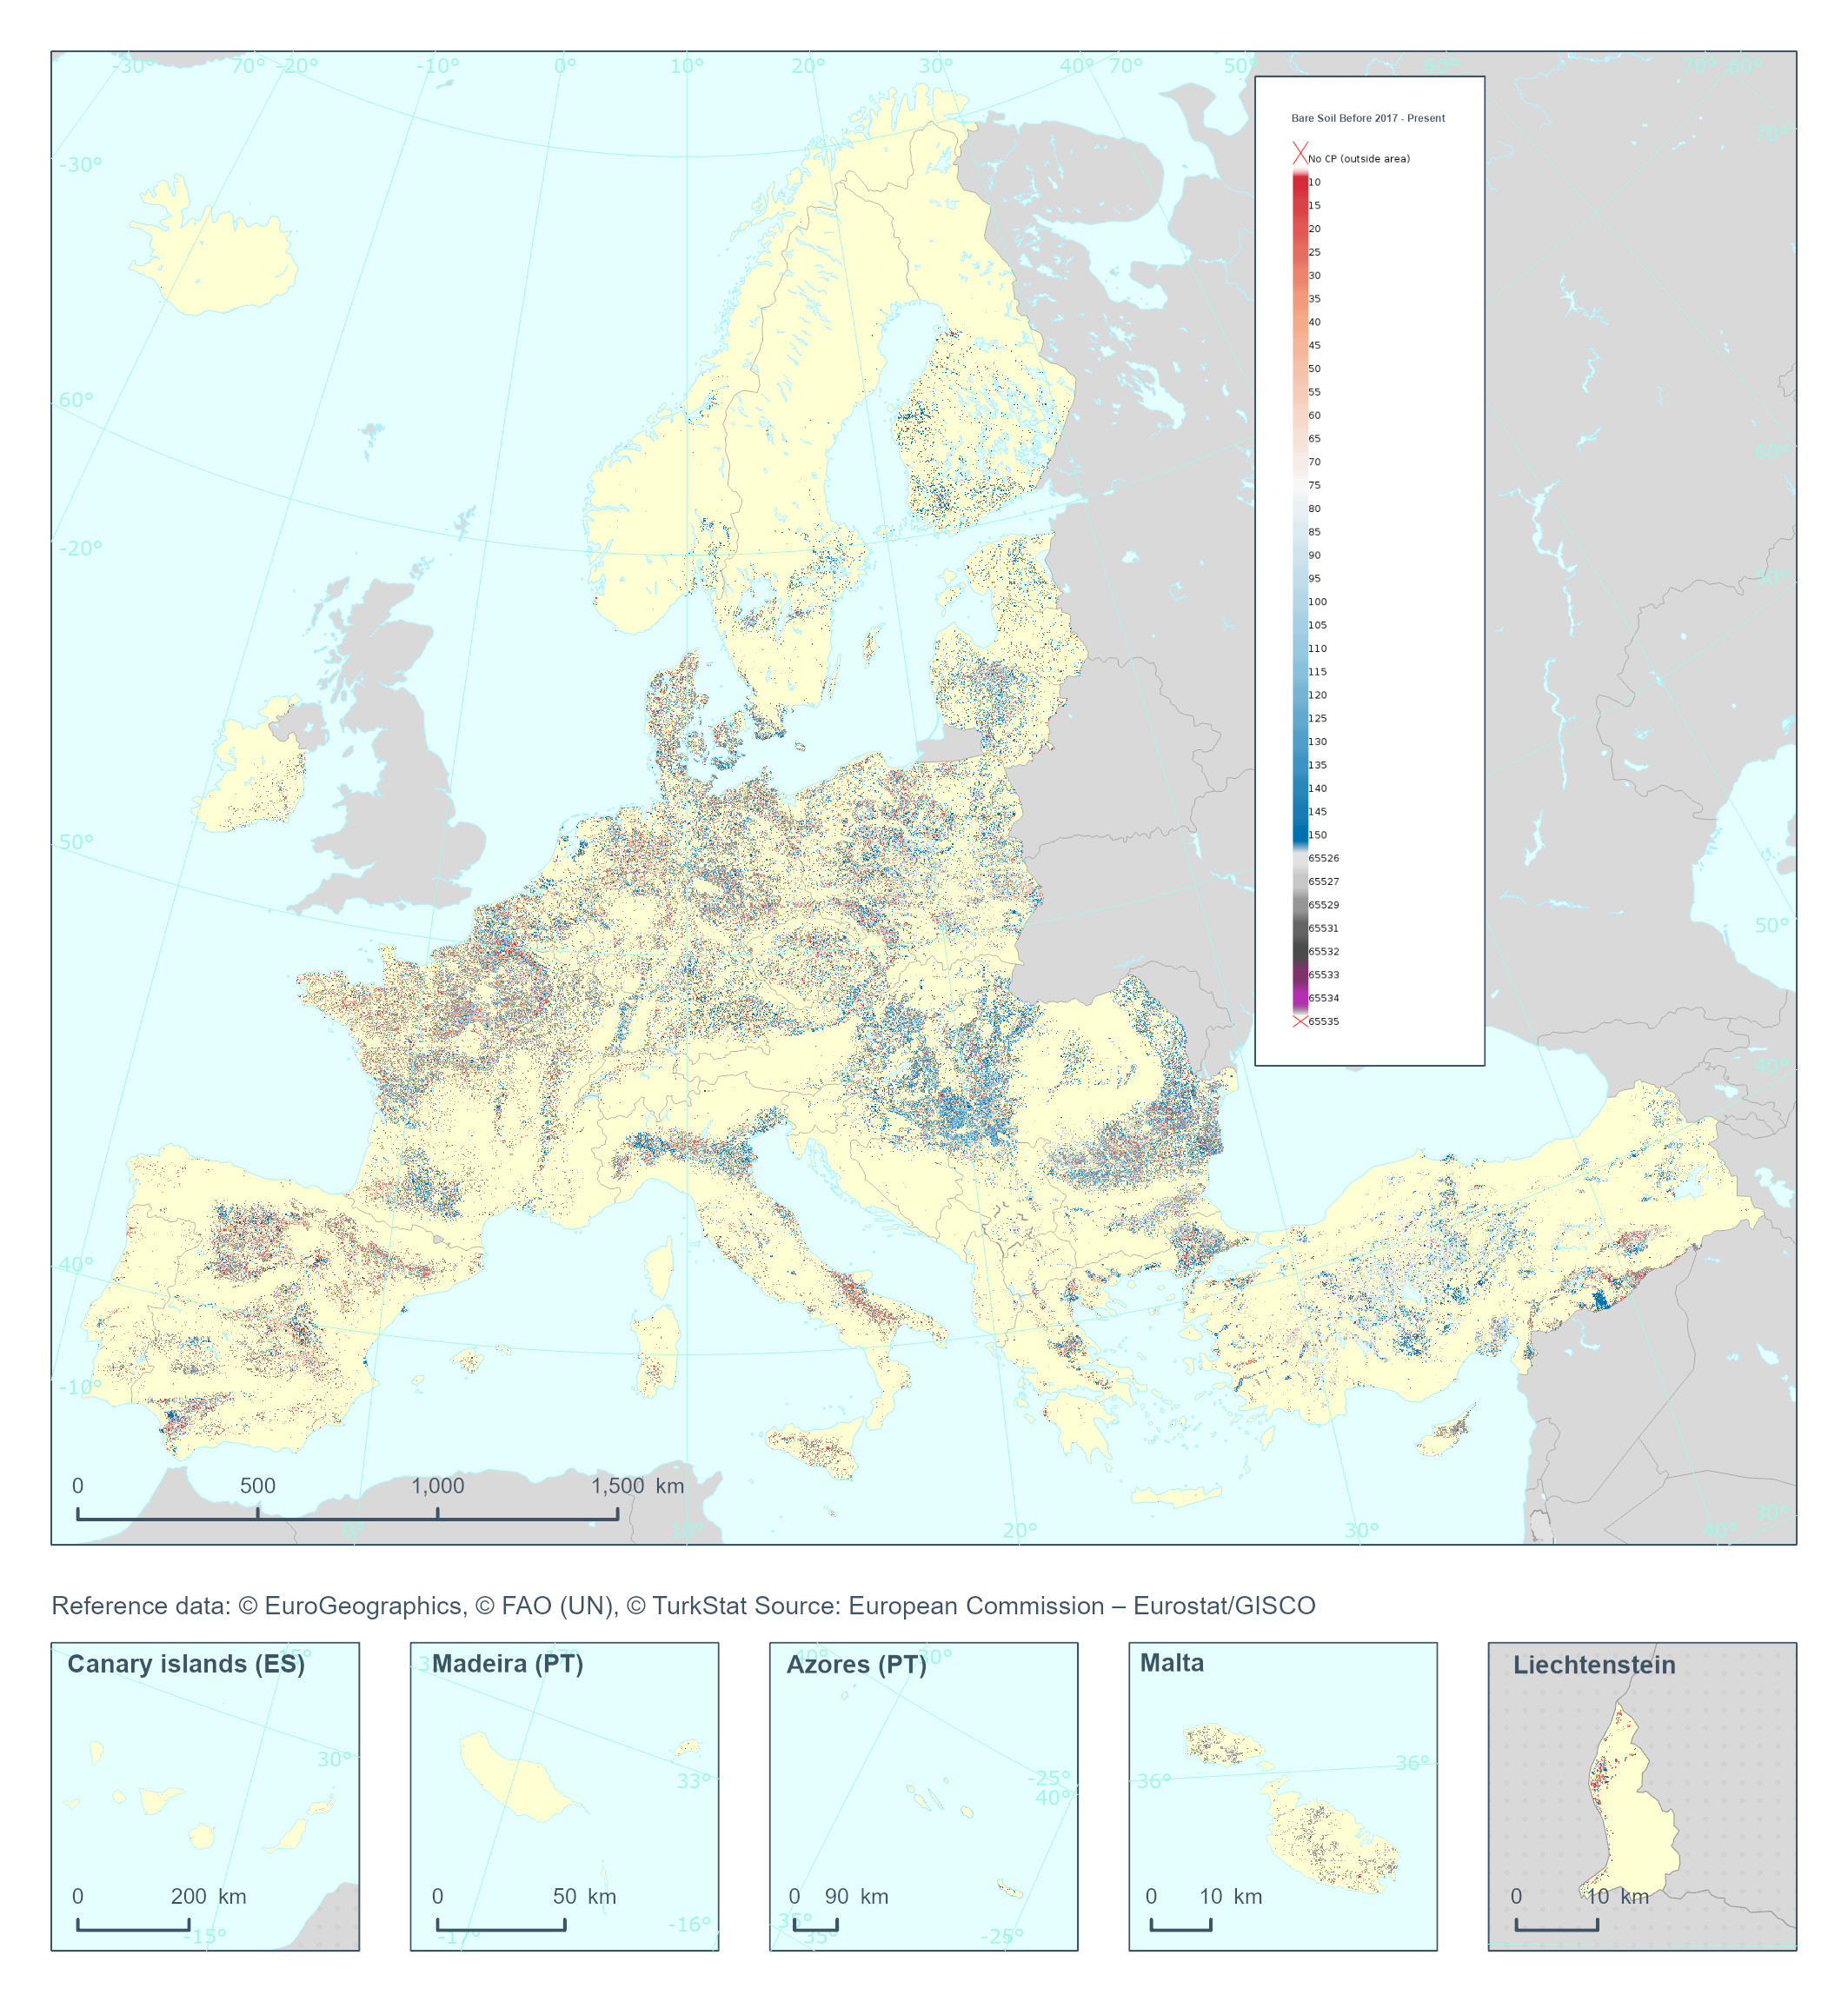
The High Resolution Layer Cropping Patterns - Bare Soil Before (CPBSB) raster product provides the bare soil period (in days) before the emergence of the main annual crop. Note that the bare soil period cannot transcend the calendar year for which the product is generated. This dataset is provided annually starting in 2017 with 10 meter rasters (fully conformant with the EEA reference grid) in 100 x 100 km tiles covering the EEA38 countries. High Resolution Layer Croplands product is part of the European Union’s Copernicus Land Monitoring Service. Confidence layer available for the dataset. This dataset includes data from the French Overseas Territories (DOMs)
-
A compendium of reports that provide information about aquatic and terrestrial animals and plants, soils, surface water, groundwater and their accompanying data files and maps
-
Explore Manitoba Agriculture’s soil survey data and related agricultural interpretations along with a comprehensive collection of public agricultural datasets from various organizations, all curated to support effective planning and decision-making. Explore Manitoba Agriculture’s soil survey data and related agricultural interpretations along with a comprehensive collection of public agricultural datasets from various organizations, all curated to support effective planning and decision making. While Manitoba Agriculture is dedicated to maintaining the overall functionality of AgriMaps and upholding the accuracy of the soil survey data it contains, the information in this resource carries no guarantee of any kind, express or implied. Periodic updates may include adjustments or enhancements to the original published versions. Please visit our website for the latest information and frequently asked questions. For enquiries, please email agriculture@gov.mb.ca.