 Arctic SDI catalogue
WMTS
Type of resources
Available actions
Topics
Keywords
Contact for the resource
Provided by
Formats
Representation types
Update frequencies
status
Scale
-

This data set presents the basemap developed as part of the Montreal by Foot (MàP) project in a web tiled map service (_Web Tile Map Service_ WTMS). It is made available in order to allow citizens and partners of the City to create web mapping tools by offering a unique graphic charter, designed specifically to promote pedestrian travel. The Montréal à Pied project aims to improve orientation and pedestrian paths throughout Montreal. The selection and classification of places of interest prioritize pedestrian and local travel. This project includes a cartographic component intended to renew the graphic signature of the representation of the City of Montreal, on digital media and on urban furniture receiving maps of the City. The basemap is intended in particular to support the representation of data [Places of interest] (places of interest) also developed under the MàP project and available as open data.**This third party metadata element was translated using an automated translation tool (Amazon Translate).**
-
The dataset is based on OpenStreetMap (OSM) data downloaded from the official OpenStreetMap distribution platform. The data have subsequently been processed and published as a customised web service. OpenStreetMap is an open, crowdsourced geospatial dataset that is continuously maintained and updated by a global community of contributors. The dataset contains vector-based geographic features, including transport networks, buildings, land use, hydrography, natural features, and points of interest. The data are used as a background map and reference dataset for map visualisation and spatial analysis at local, regional, and national scales. Data content and quality vary geographically and depend on contributor activity.
-
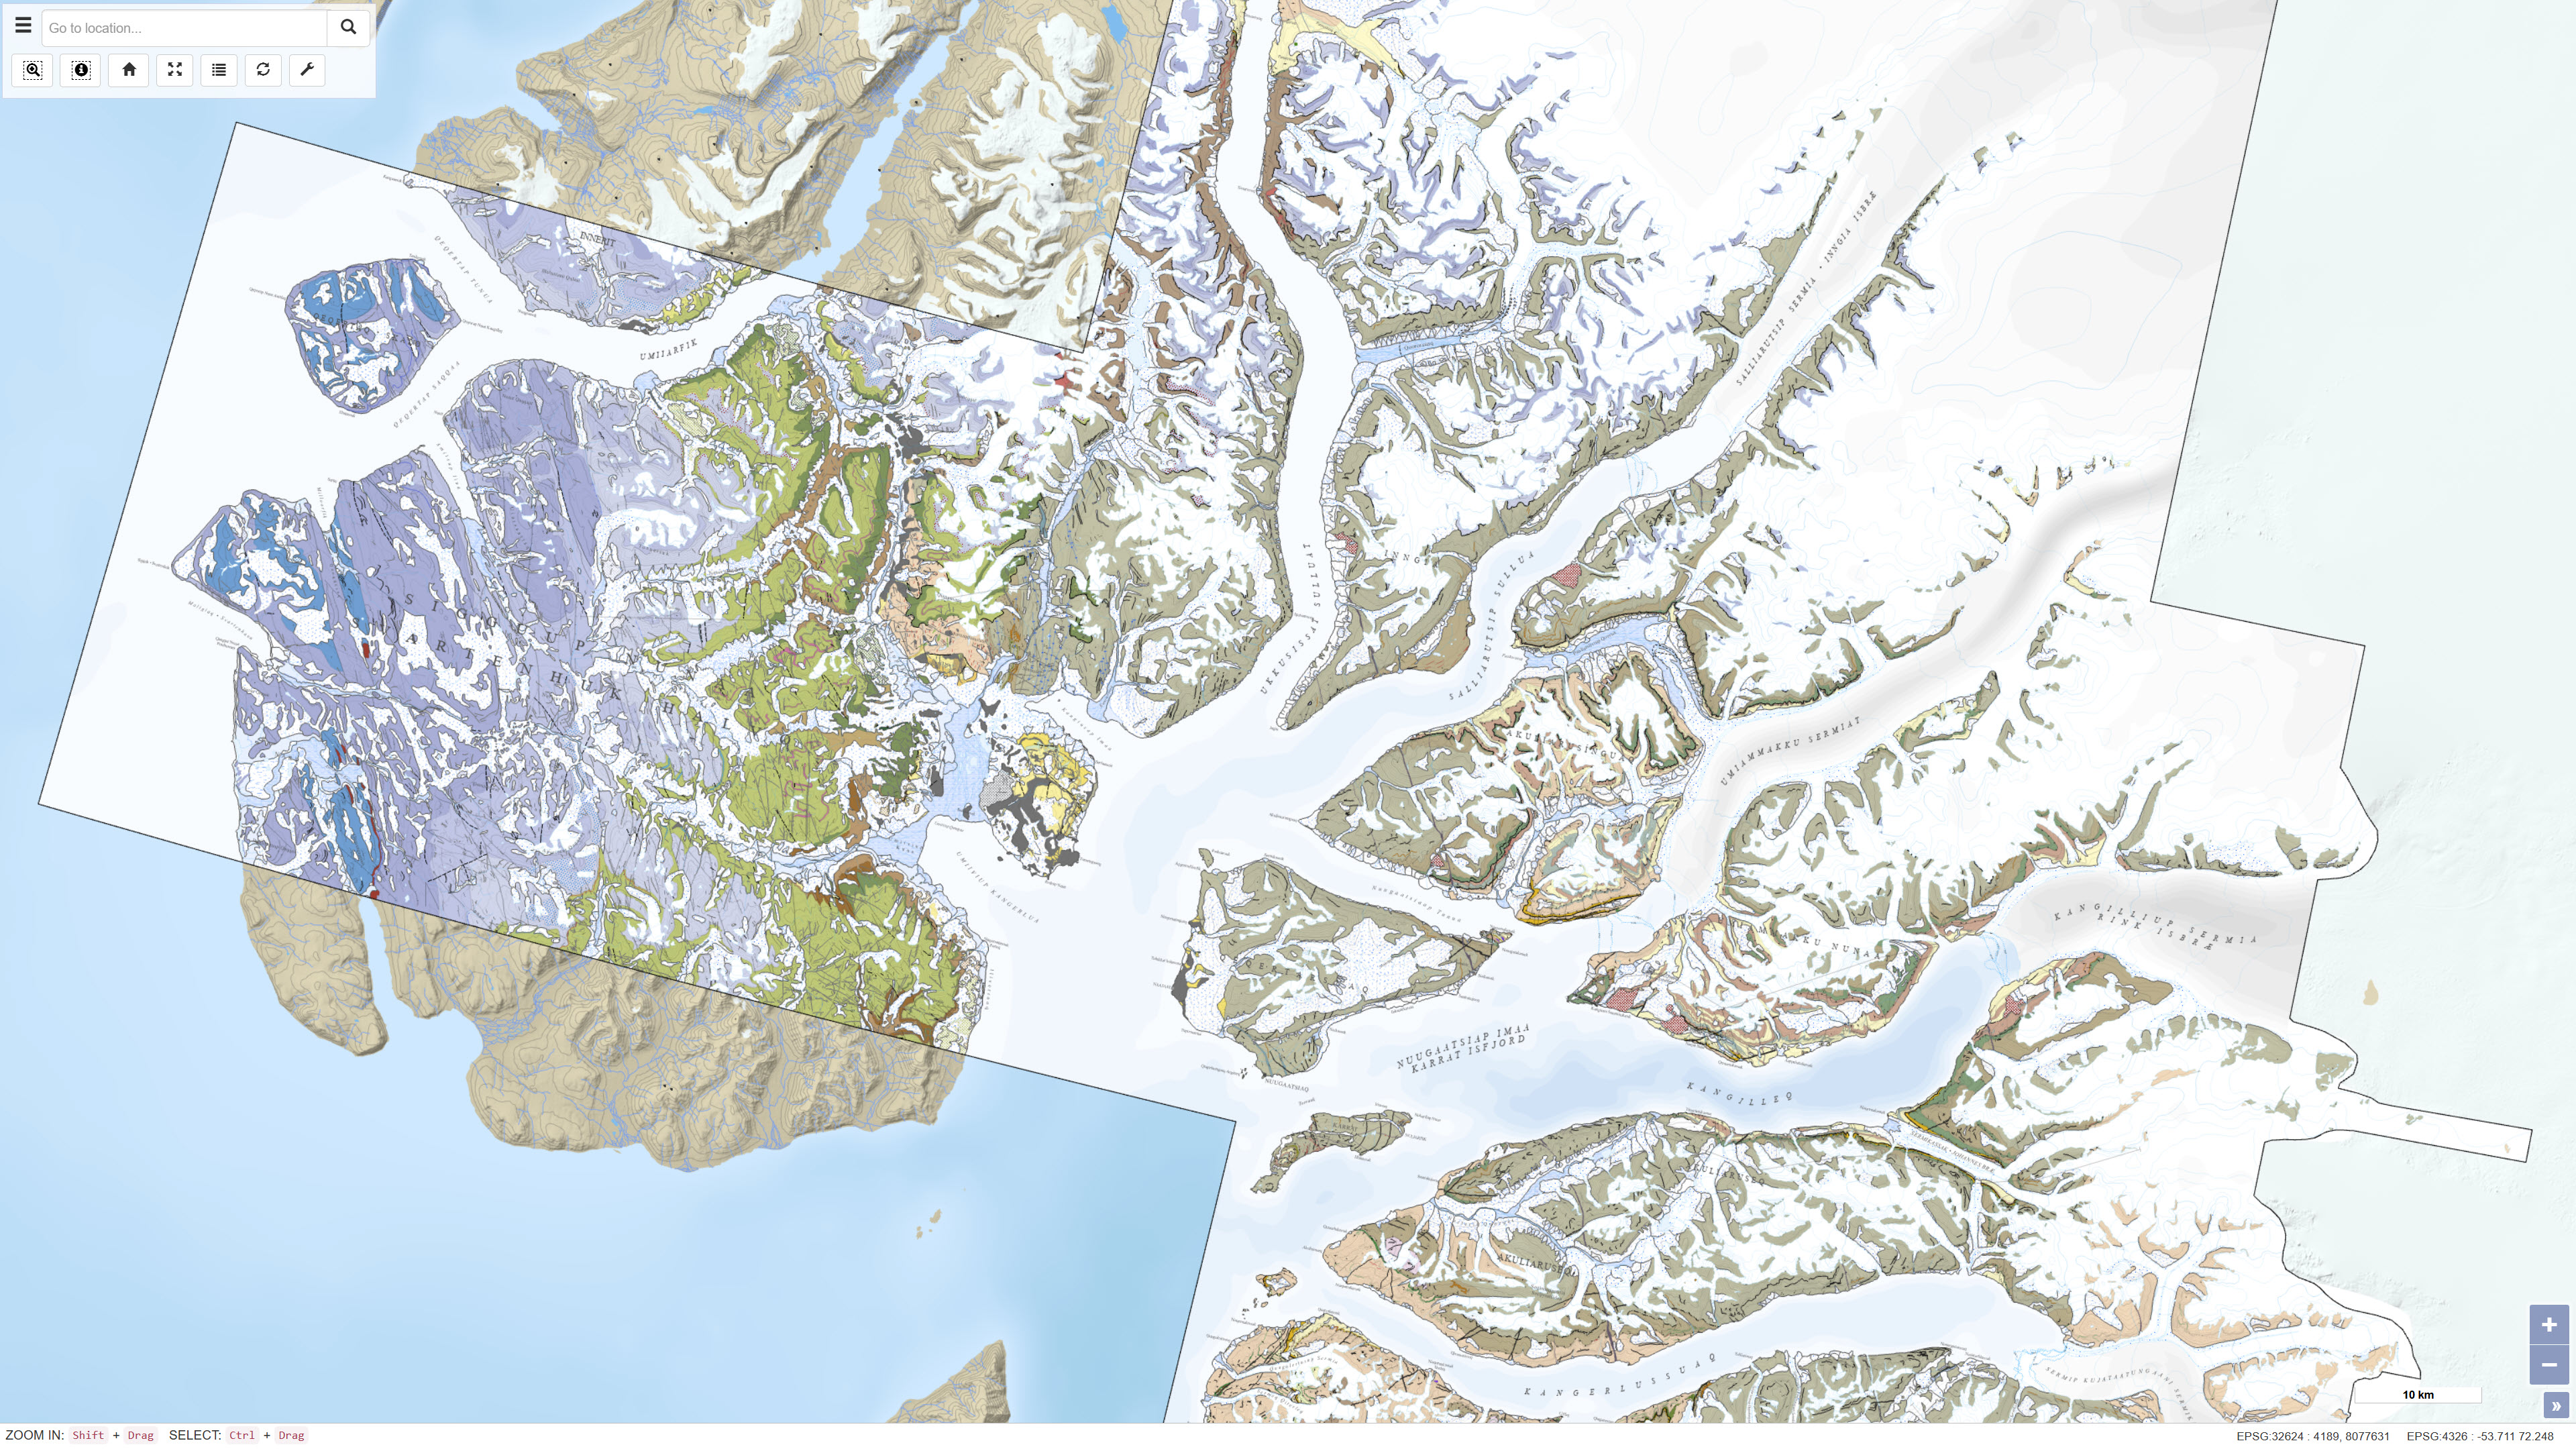
This dataset contains a seamless digital geological map of the Karrat area in central West Greenland based on four geological map sheets at a scale of 1:100 000: Maarmorilik 71 V.2 South, Nuugaatsiaq 71 V.2 North, Pannertooq 72 V.2 South and Svartenhuk 71 V.1 North. Geological mapping was carried out in the fjord regions north of Uummannaq as part of a collaborative project between the Geological Survey of Denmark and Greenland (GEUS) and the Ministry of Mineral Resources and Justice of Greenland. The dataset is based on 3D photogeology using more than 35,000 oblique photographs collected during three field seasons combined with traditional field observations and subsequent geochemical and geochronological analyses. The dataset provides an updated geological understanding of the meta-sedimentary and meta-volcanic rocks of the Karrat Group, the structural evolution of the Rinkian Orogen and the structure of the West Greenland Basalt Group. The dataset supports geological research, regional geological mapping and mineral exploration.
-
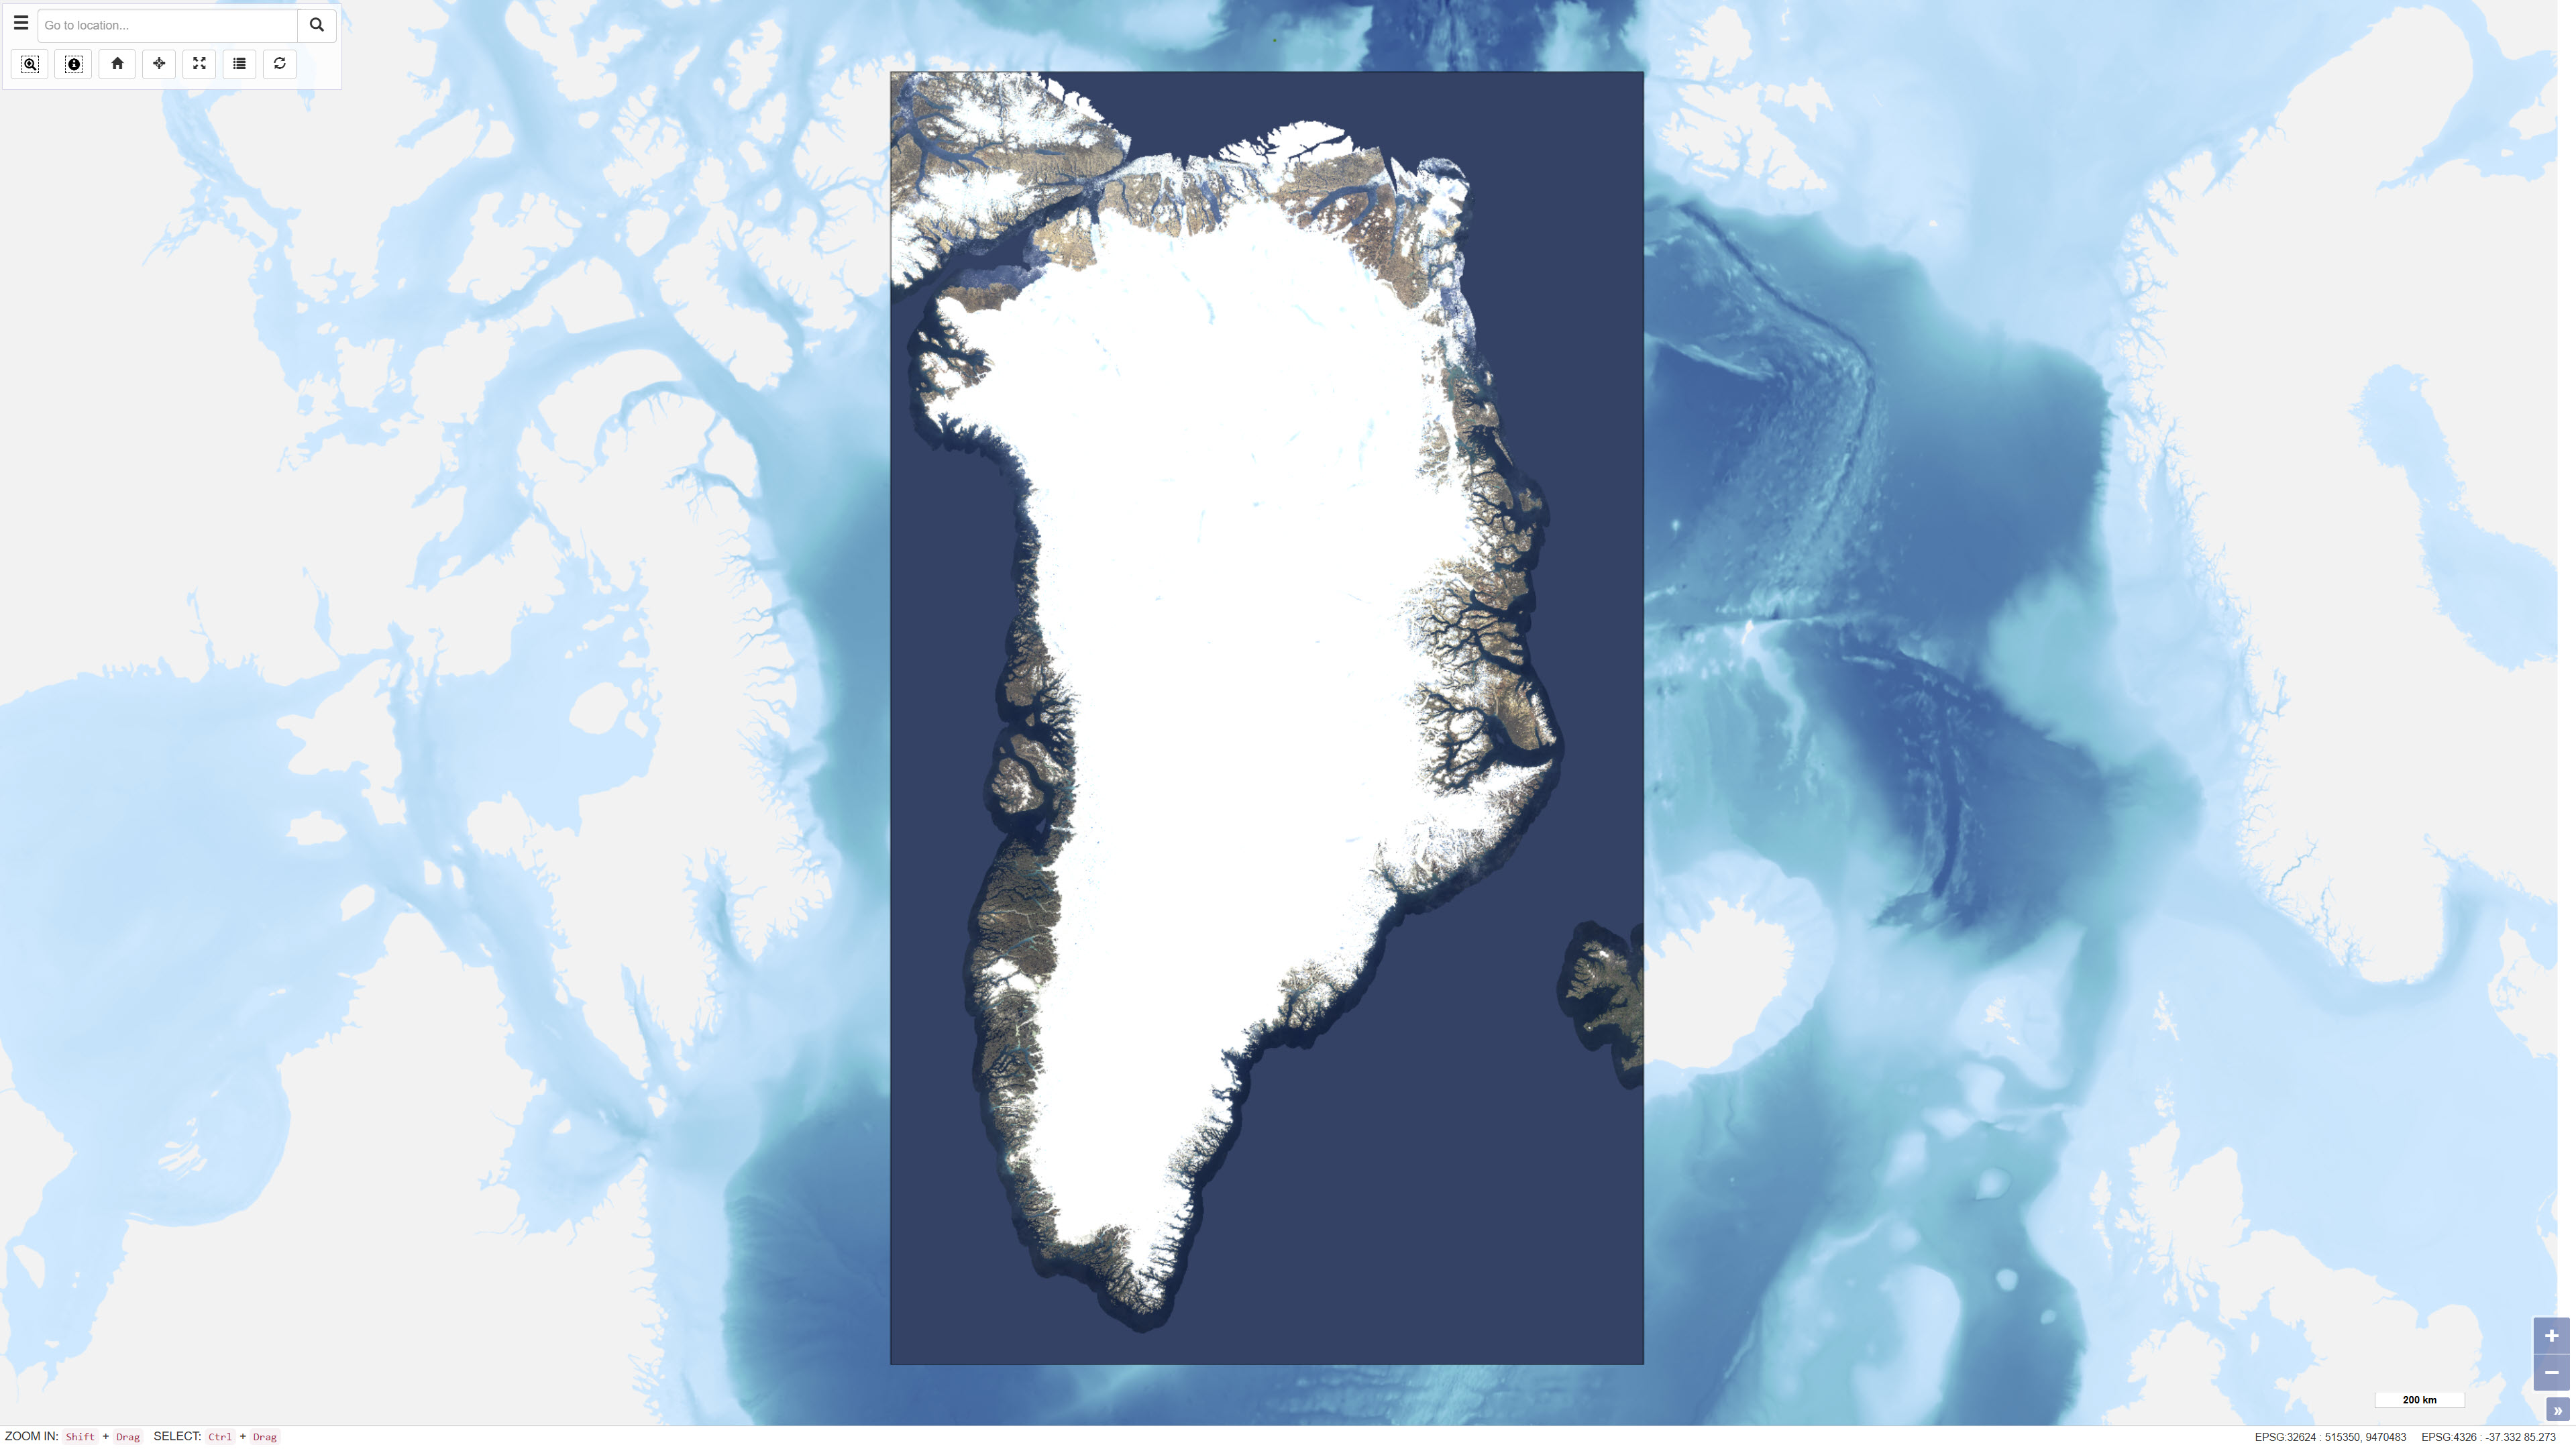
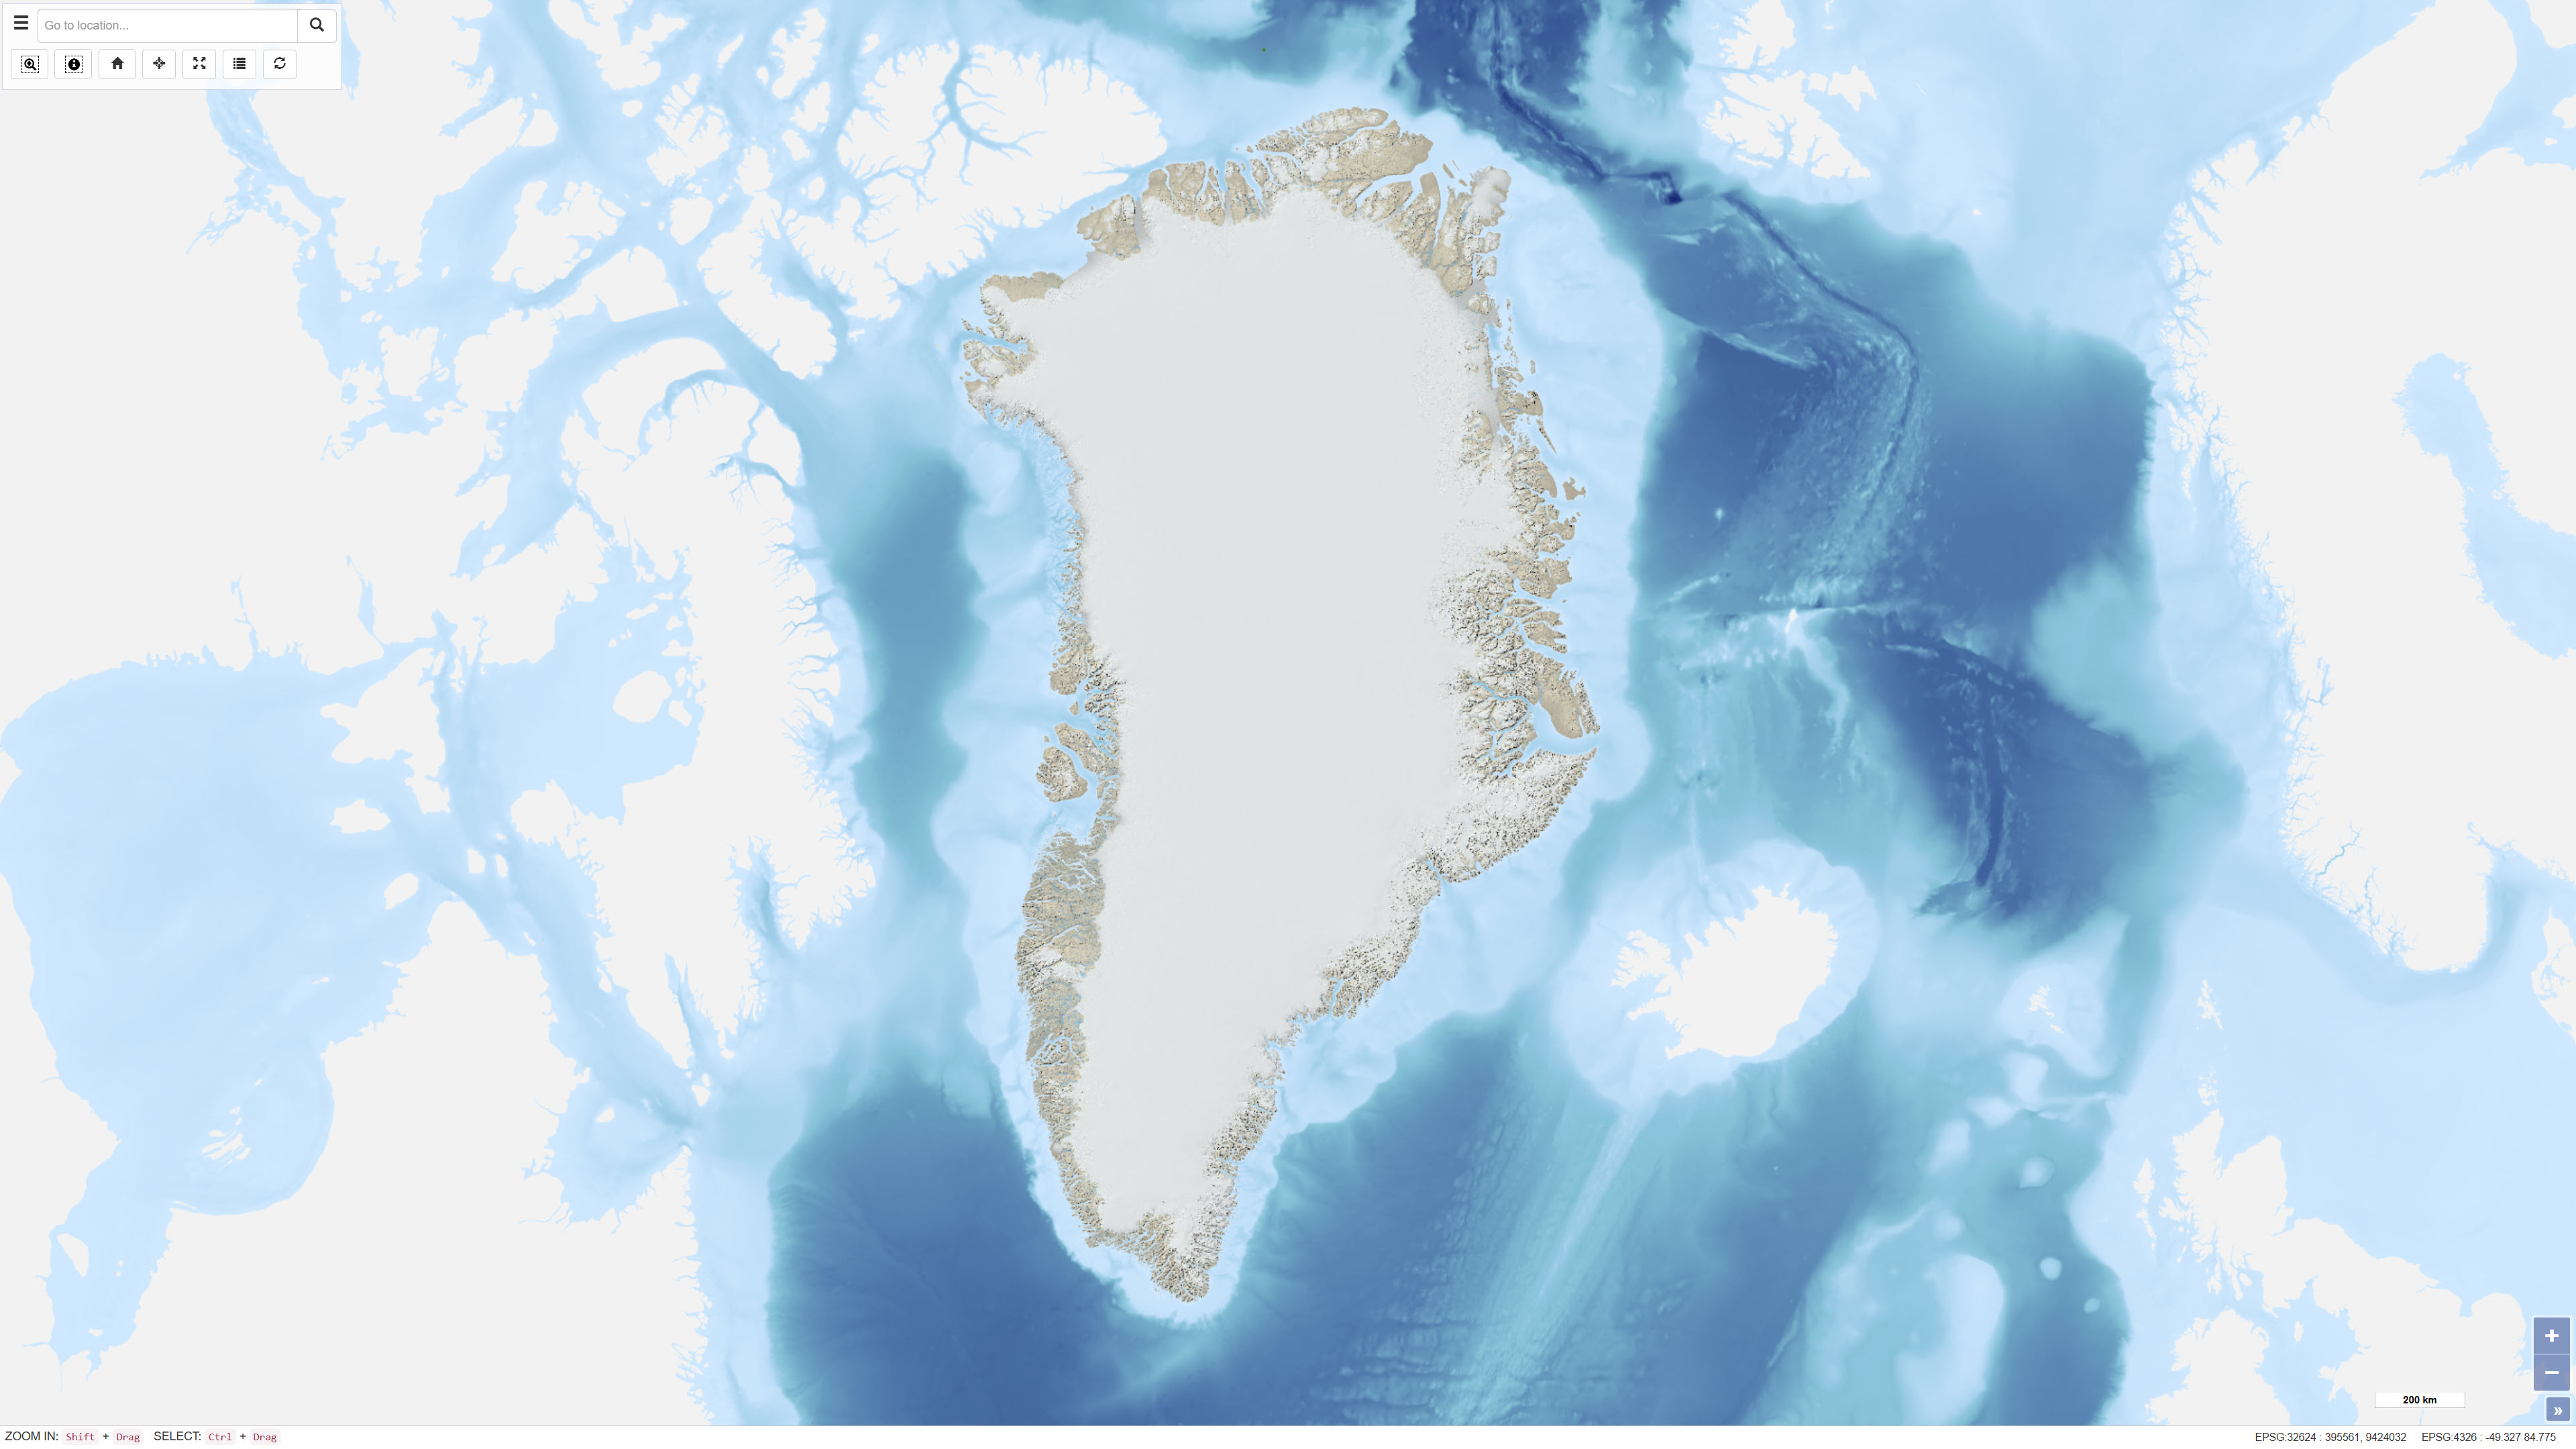
EOxCloudless is a global satellite imagery dataset consisting of near-cloudless mosaics derived from Copernicus Sentinel-2 multispectral satellite data. The dataset is produced by EOX IT Services GmbH and is designed to provide consistent, high-resolution surface imagery for mapping, analysis, and visualization purposes. The mosaics are generated by combining a large number of Sentinel-2 Level-1C observations acquired over defined time periods. Advanced pixel selection algorithms and thematic masks (including clouds, cloud shadows, and water) are applied to reduce cloud contamination. For each pixel location, the most representative observation is selected based on statistical criteria and temporal analysis, resulting in near-cloudless composite images. The dataset provides global land coverage and is typically delivered at a spatial resolution of 10 metres for the utilised spectral bands (blue, green, red, and near-infrared). EOxCloudless is suitable for use as a basemap as well as for environmental monitoring, land analysis, spatial planning, and other geoscientific applications.
-

The main geological environments in Greenland and their mineral resources have been described and divided into four main geological environments: infracrustal regions, supracrustal regions, magmatic provinces and sedimentary basin regions. Within the various geological environments, characteristic mineral deposits are outlined. Within the infracrustal environment, relatively few mineral occurrences are recorded in Greenland, but three types are described: gold in gneiss, nickel and copper in mafic intrusions, and olivine in ultramafic rocks. For more detailed information, reference is made to the report Greenland geological environments and mineral resources.
-
%20-%20datas%C3%A6t.jpg)
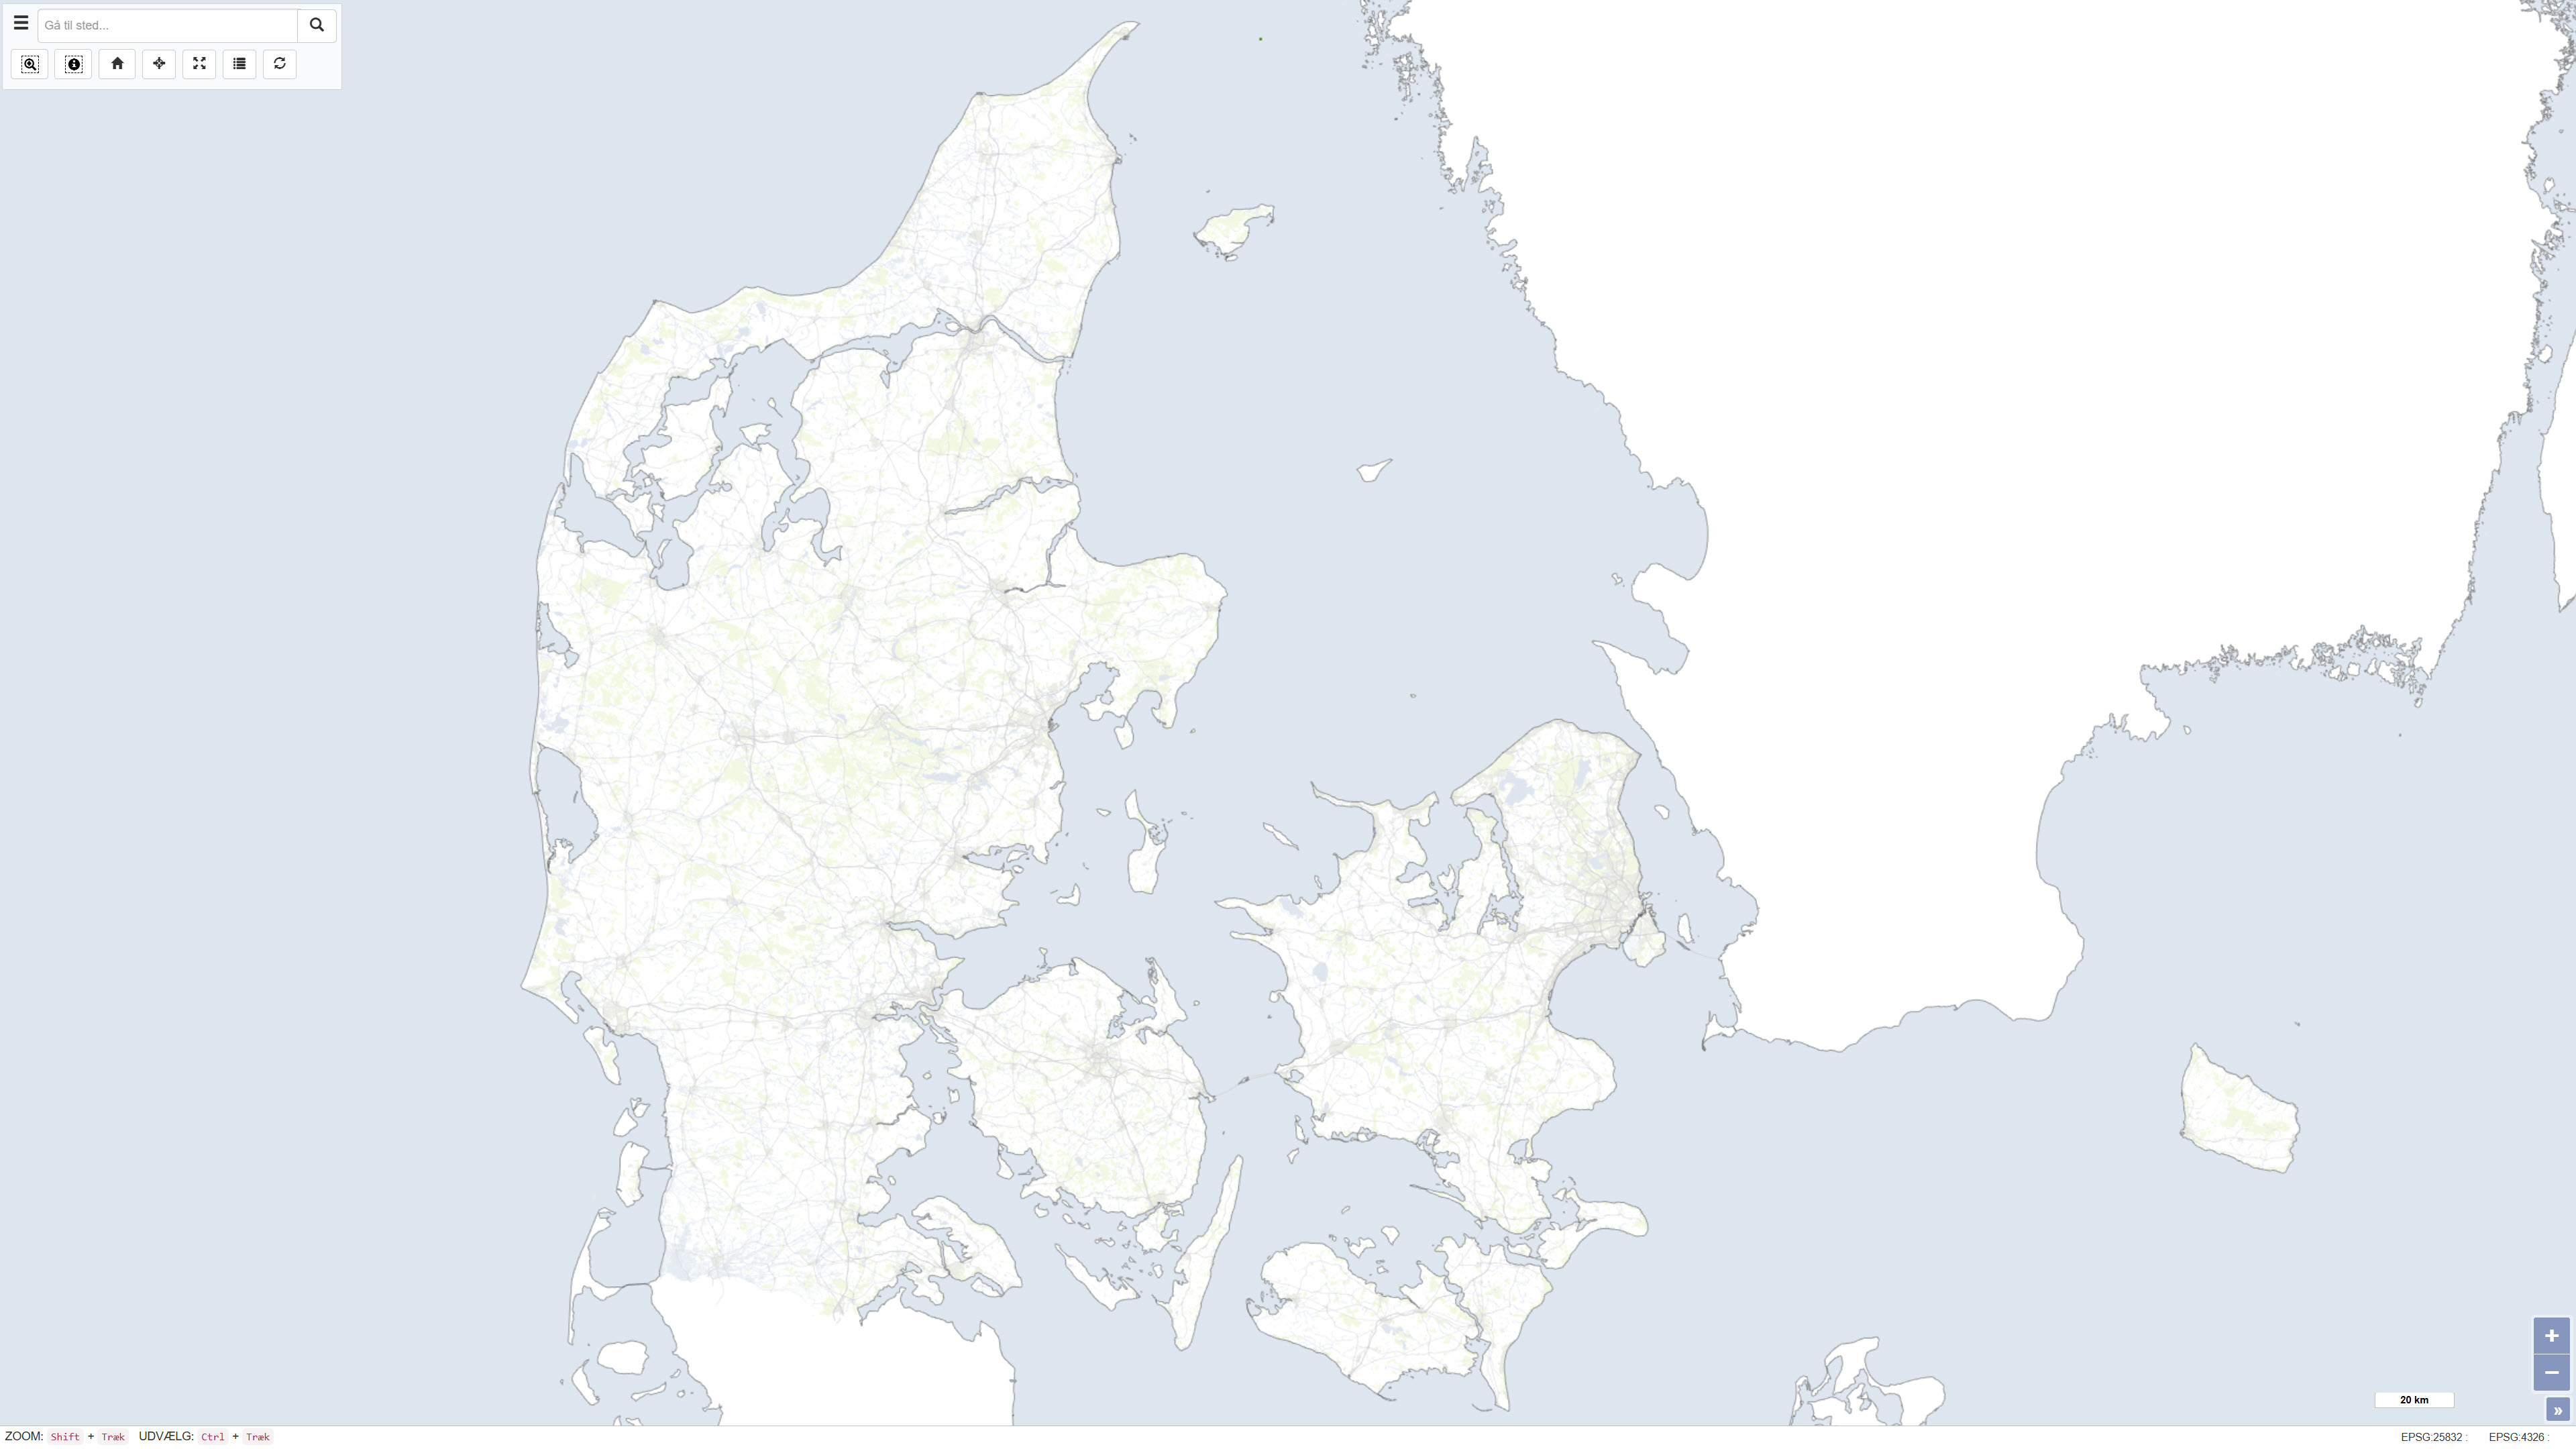
The dataset represents a hillshade derived from the Danish Digital Terrain Model 2007 (DHM/Terrain 2007). The hillshade is produced as a cartographic overlay layer designed to enhance terrain forms and topographic structures in the Danish landscape. The dataset is suitable for visual analysis and map presentation and can be used as a background layer together with other thematic datasets. The hillshade is based on the DHM/Terrain model, which represents terrain elevation relative to mean sea level (DVR90), with buildings, vegetation and other surface objects removed. The original terrain model is based on nationwide airborne LiDAR surveys collected during 2005–2007 and subsequently processed and quality assured.
-
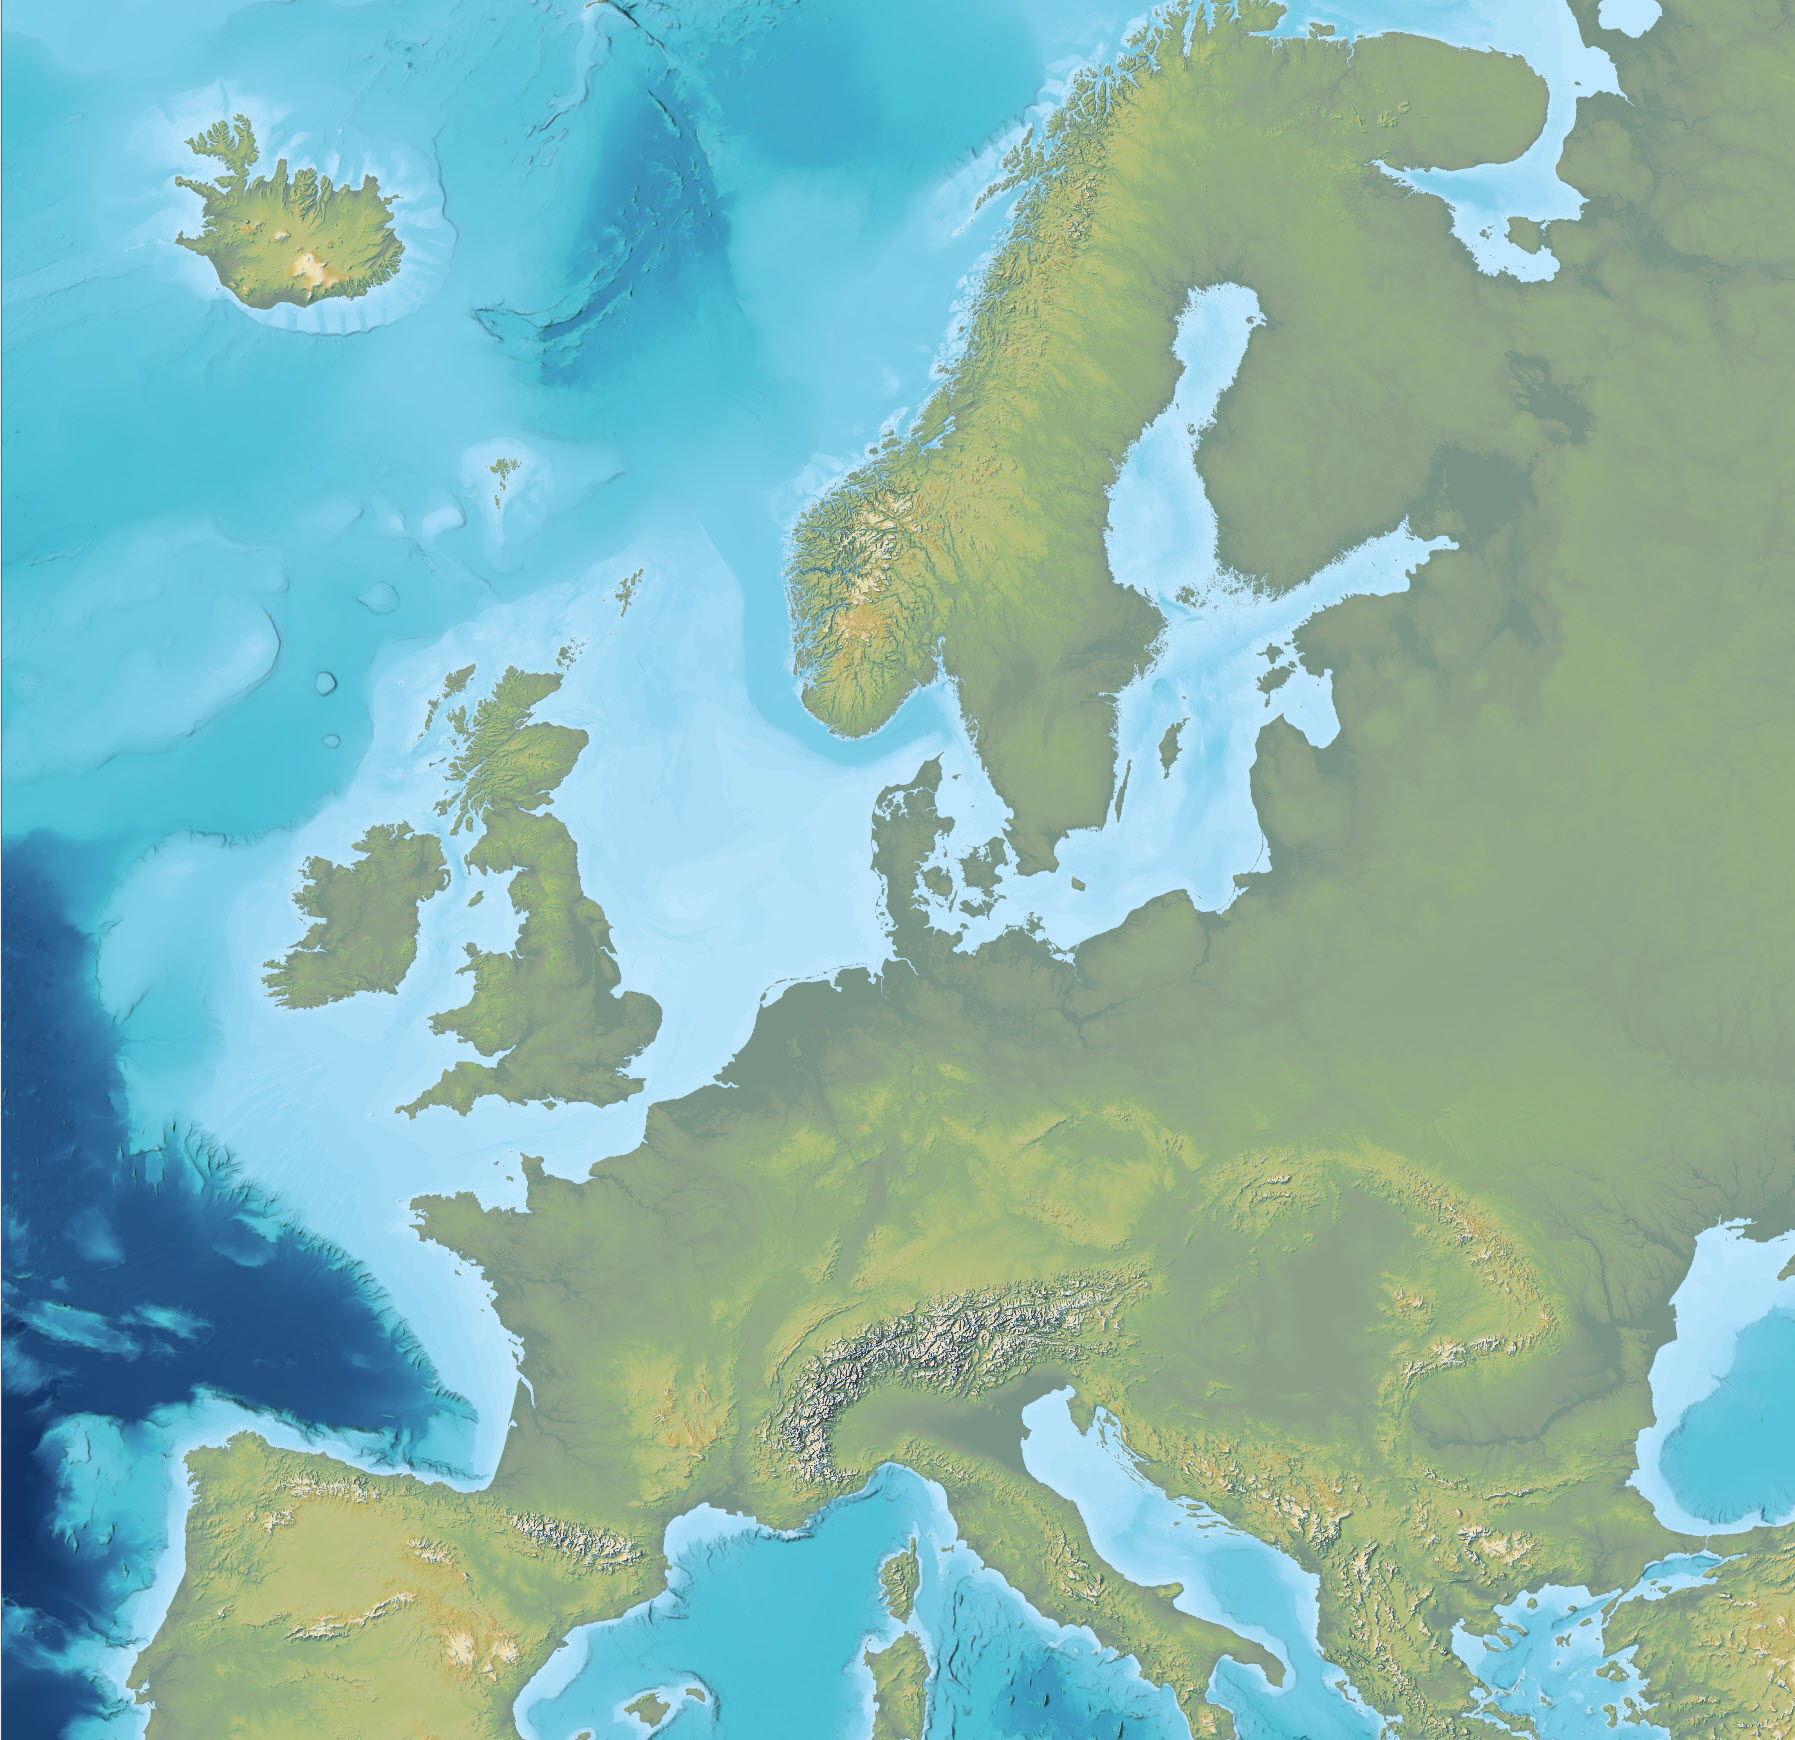
The dataset is an Imhof-inspired cartographic base map combining topography and bathymetry, covering European countries and adjacent marine areas. The map has been constructed by merging several existing digital elevation models, with topography primarily based on EU-DEM v1.1 and the Shuttle Radar Topography Mission (SRTM), and bathymetry derived from the General Bathymetric Chart of the Oceans (GEBCO). The dataset provides a continuous surface integrating land and marine areas and has been developed with a focus on visual quality and regional applications.
-
This dataset comprises a multidirectional hillshade raster derived from the Greenland Mapping Project (GIMP) Digital Elevation Model. The hillshade was produced to serve as a semi-transparent overlay for cartographic applications, enhancing terrain depth and surface detail while preserving the original colour characteristics of underlying map layers. The multidirectional illumination method reveals terrain variation from multiple light directions, providing improved representation of landforms compared to traditional single-direction hillshading. The dataset is intended for visualisation purposes in web maps and other cartographic products.
-
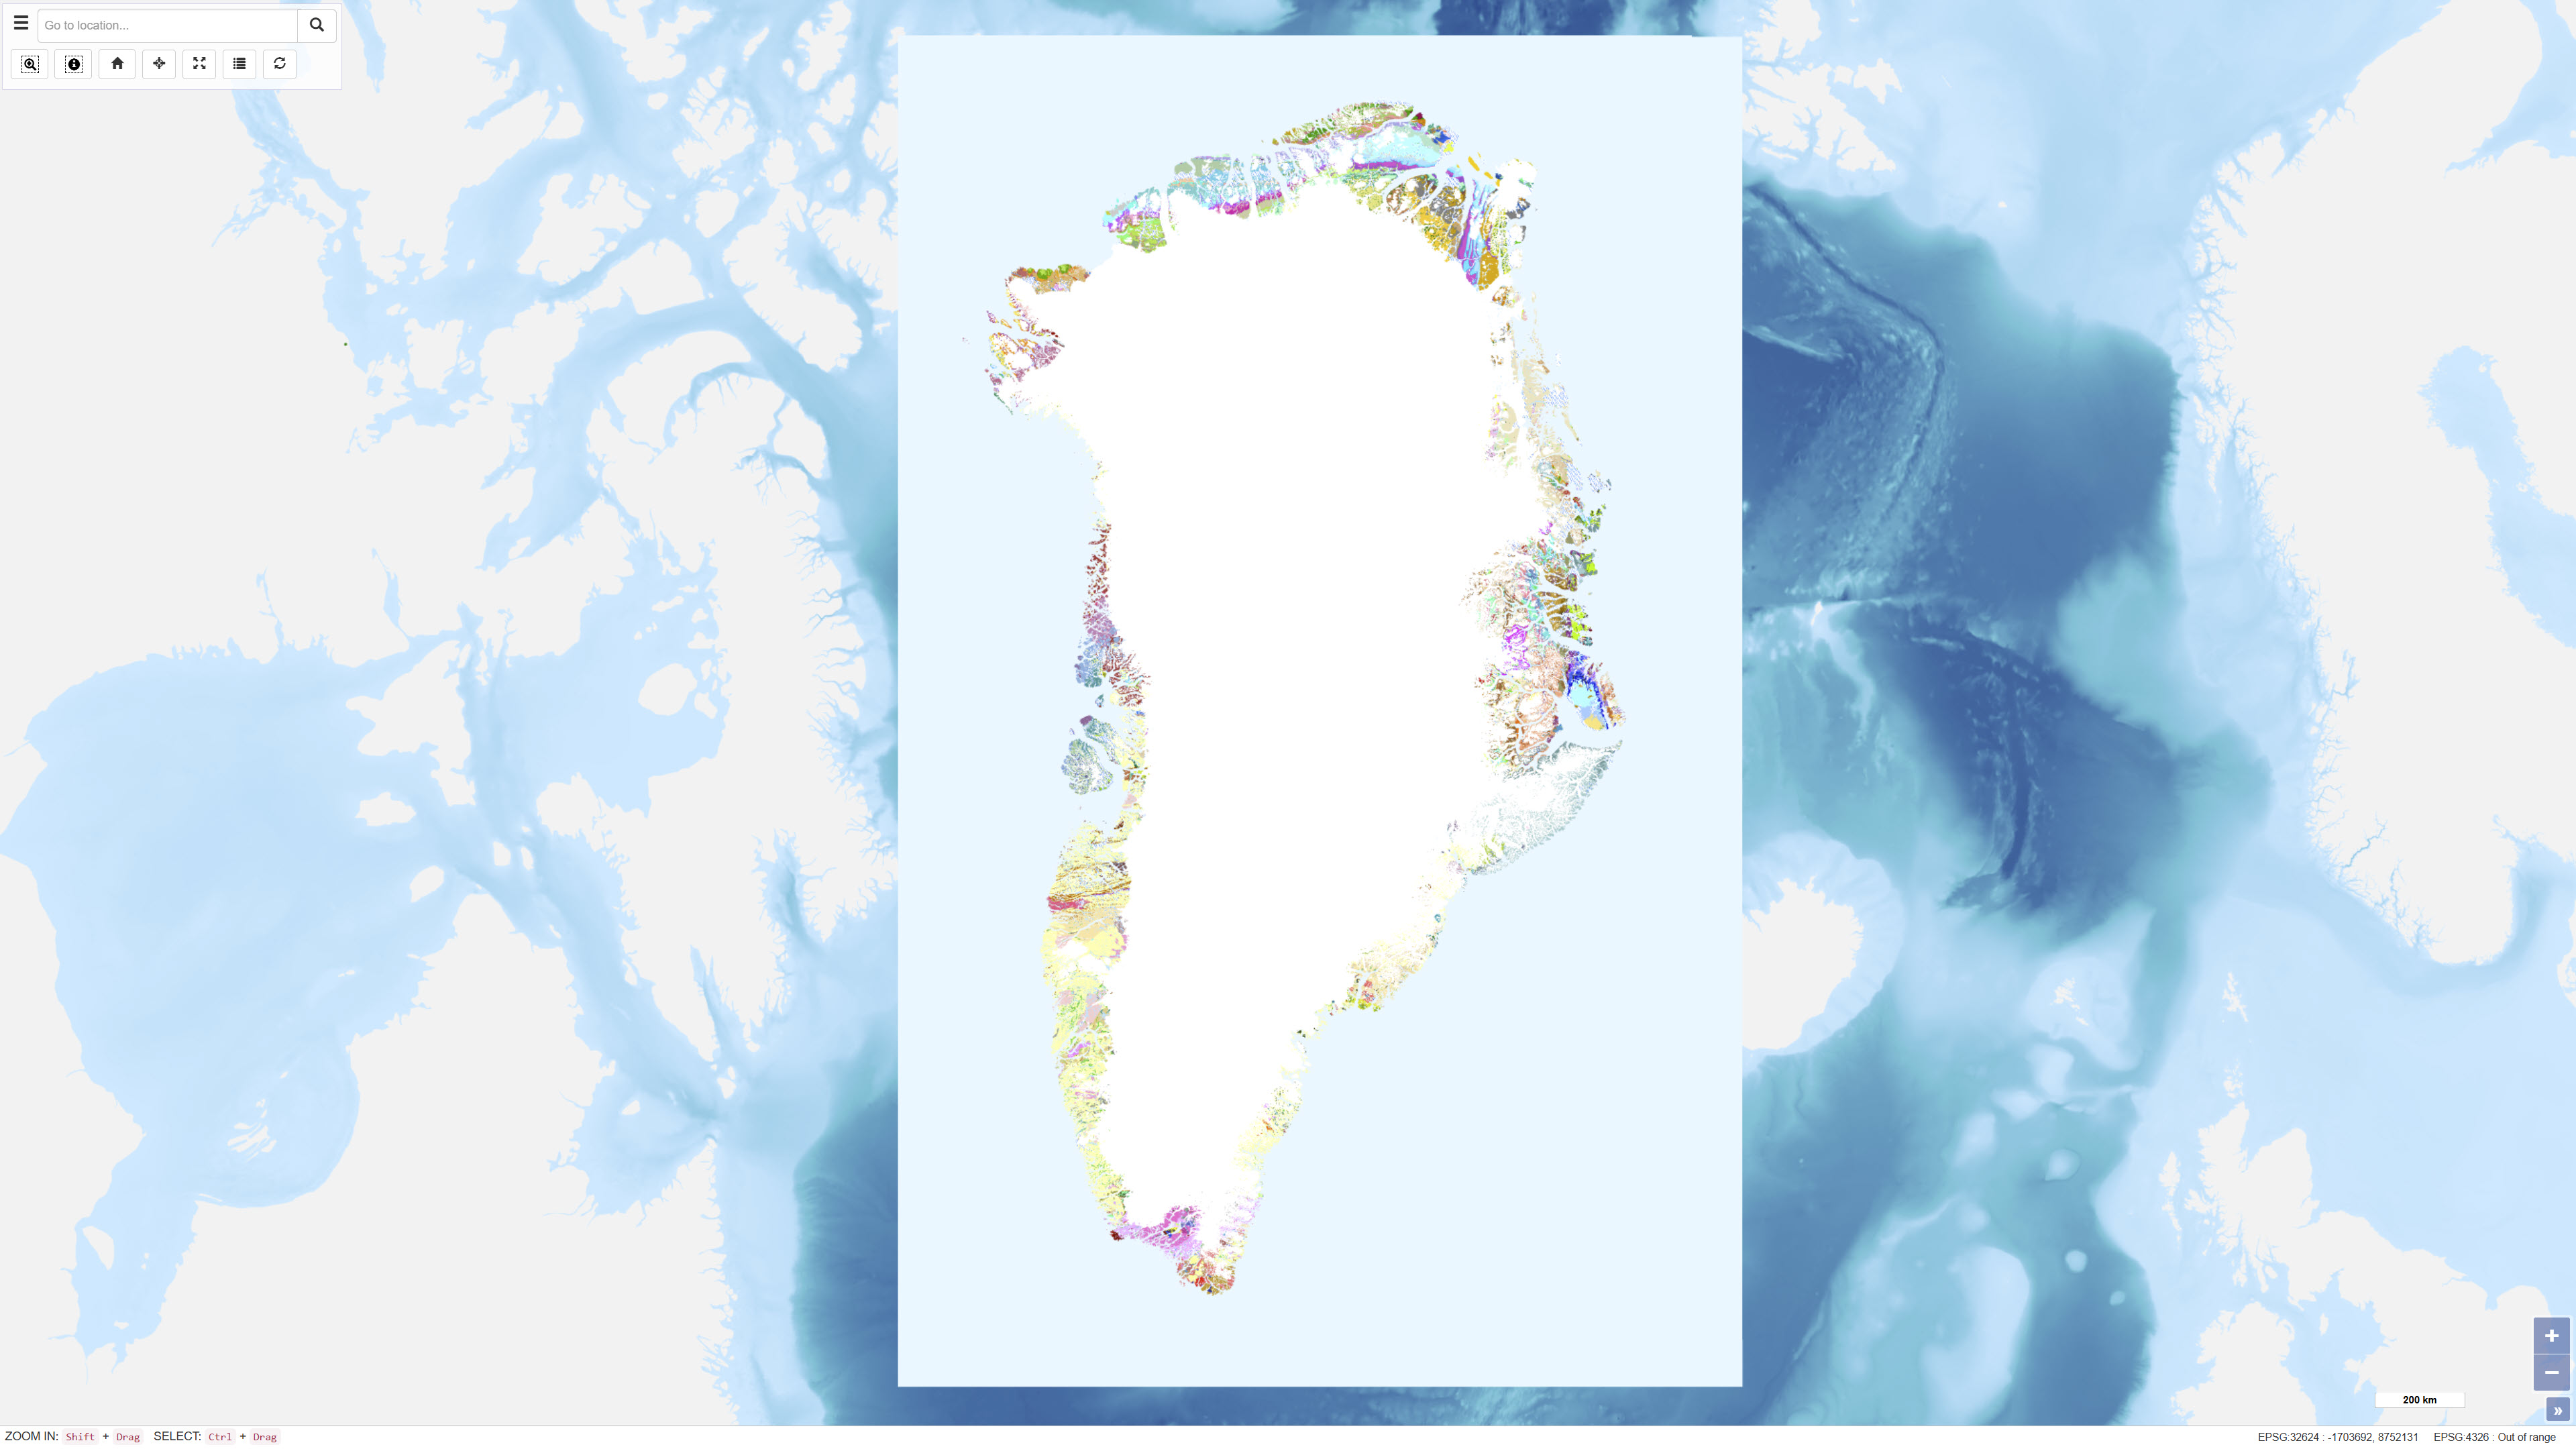
The Geological Map of Greenland at scale 1:2.500.000 provides a comprehensive regional synthesis of the geological evolution of Greenland from the earliest Archaean to the Quaternary. The map presents an integrated overview of Greenland’s geological framework, including Precambrian crystalline basement provinces, major orogenic belts, Phanerozoic sedimentary basins and widespread volcanic provinces. Greenland is characterised by large exposures of continental crust dominated by Archaean and early Proterozoic shield rocks that stabilised as part of the Laurentian shield. Younger geological elements are mainly developed along the margins of the shield, where sedimentation, deformation and magmatic activity reflect successive tectonic regimes through time. The map illustrates the distribution and relationships of these geological units and highlights the structural and stratigraphic architecture of Greenland and adjacent offshore areas. The map integrates onshore and offshore geological information and serves as a regional reference for geological interpretation, research, education and resource-related studies in Greenland.
-
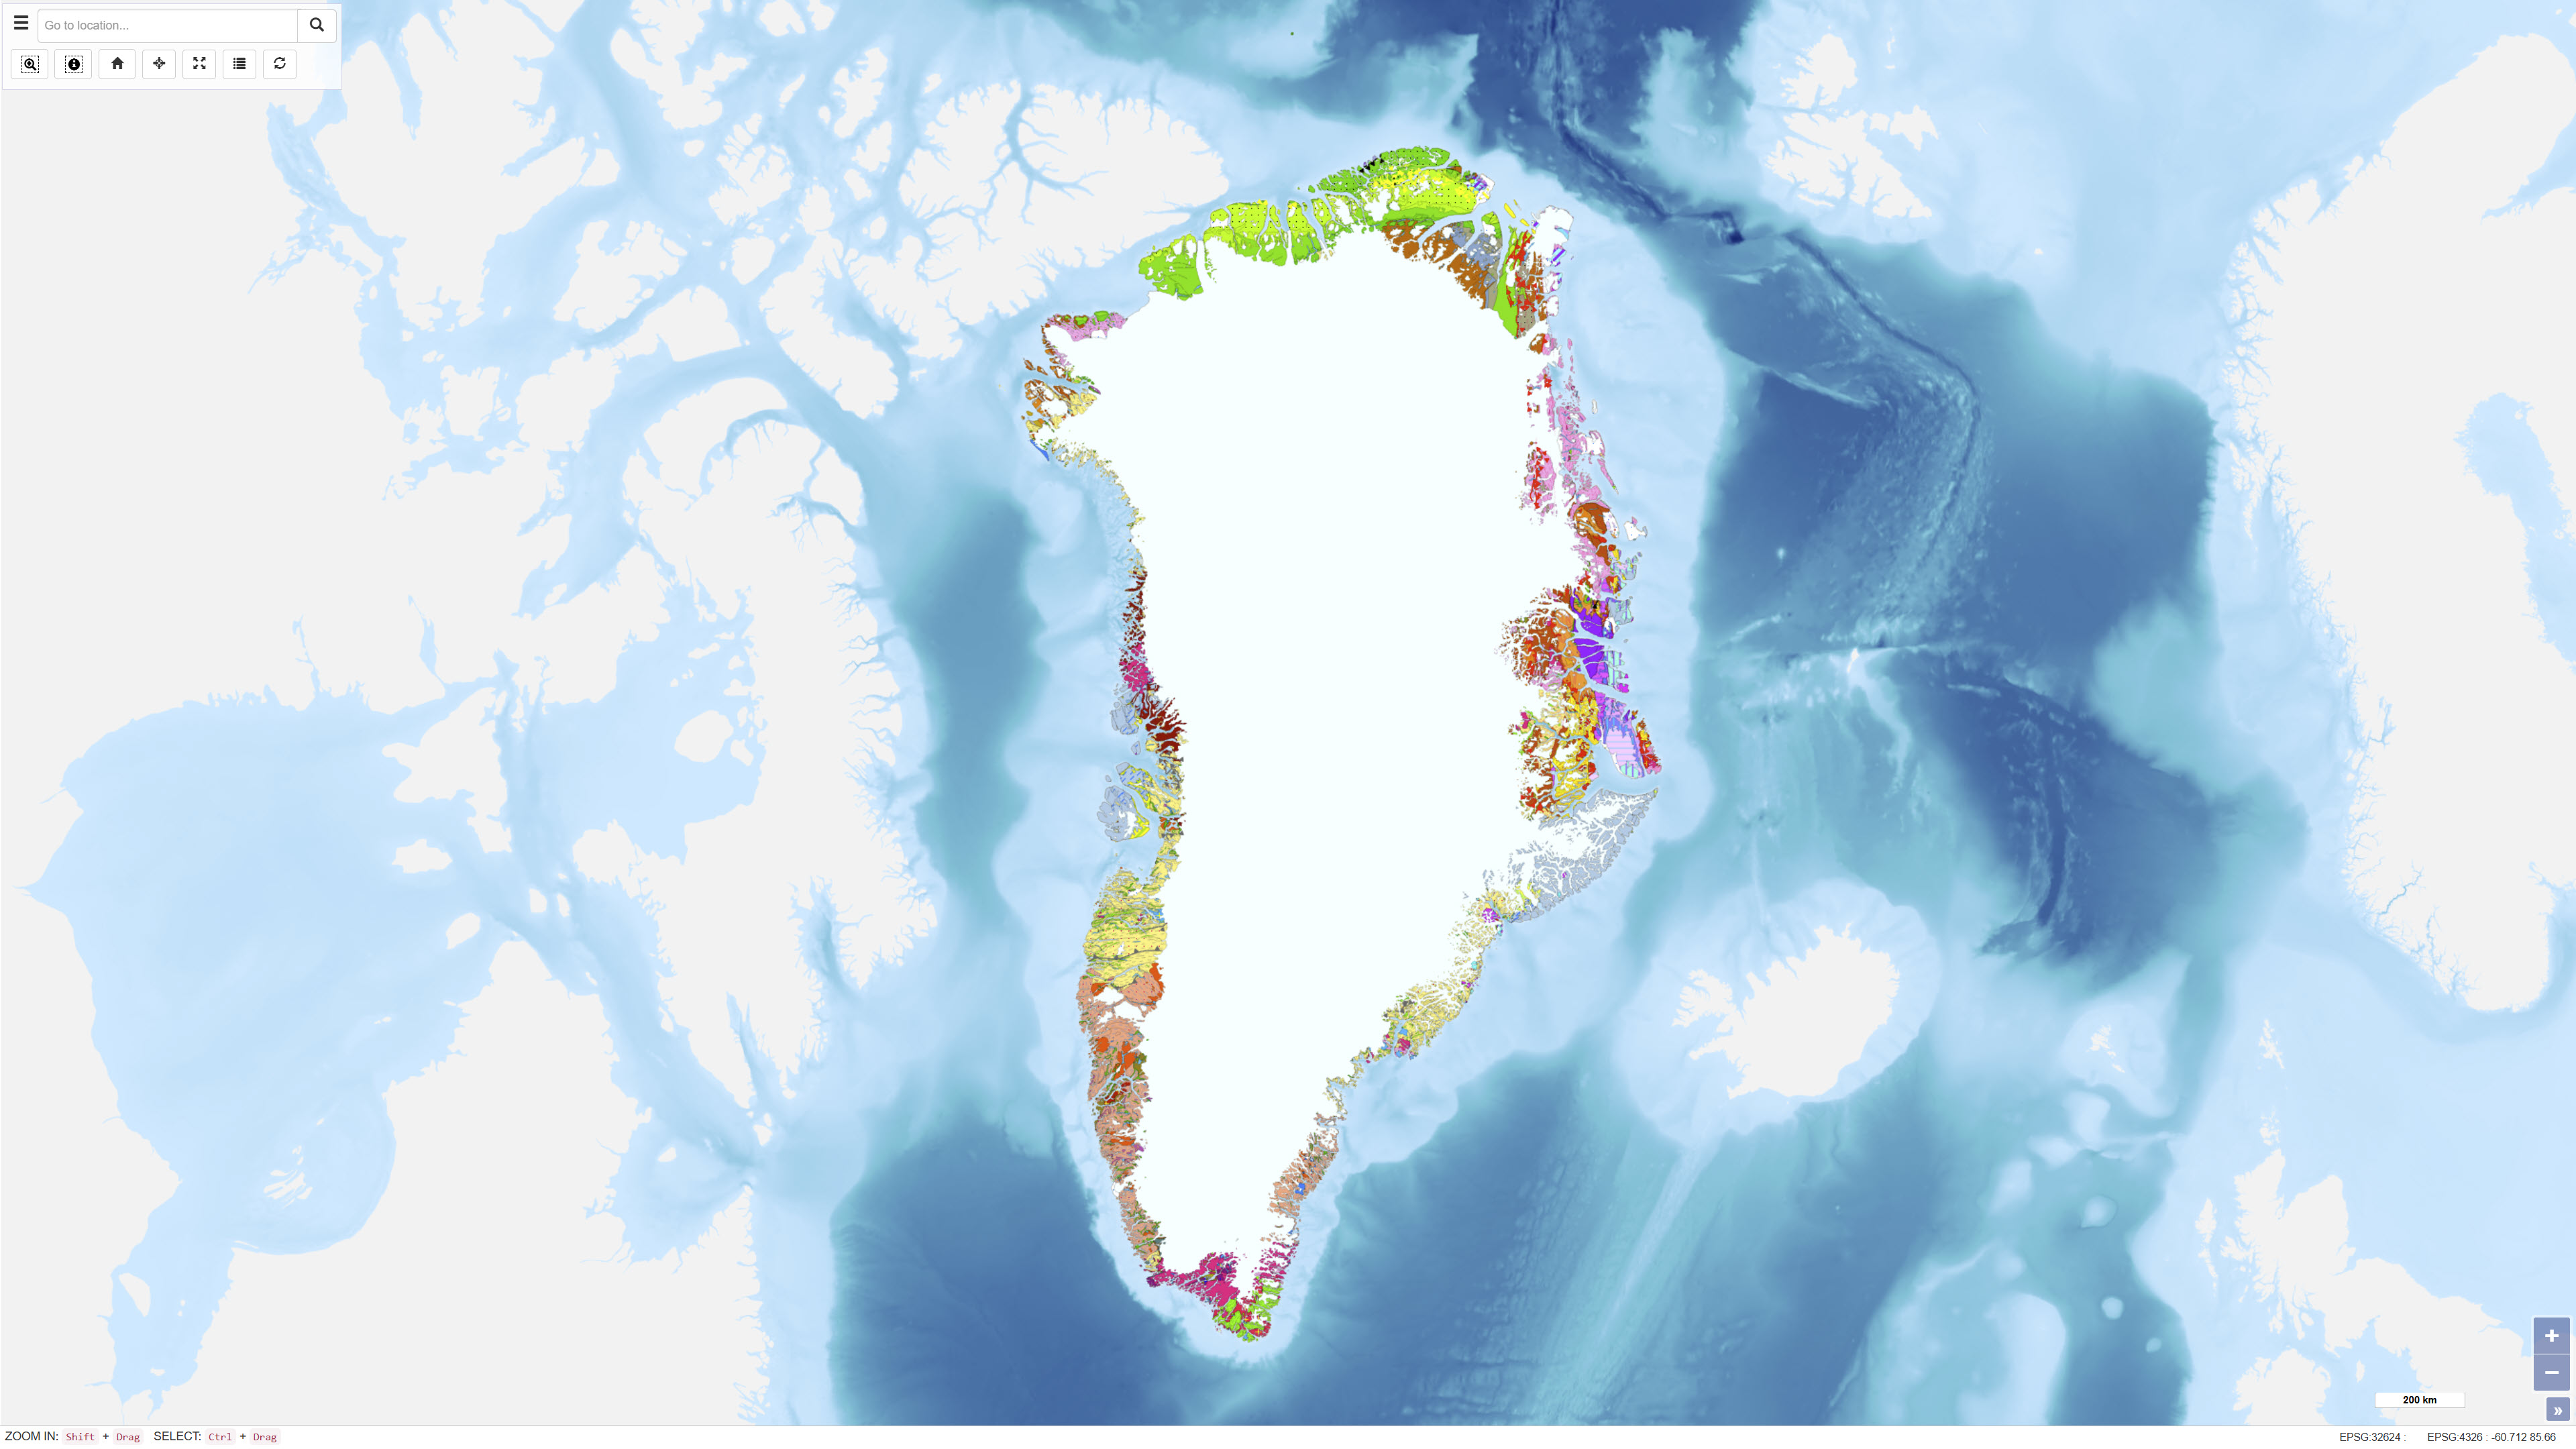
The geological map of Greenland at a scale of 1:500 000 is based on 14 digitised map sheets covering the whole of Greenland, with amendments in specific areas (Pedersen et al. 2013, GEUS Bulletin, DOI: 10.34194/geusb.v28.4727). The original digital version of the map was released through the Greenland Portal in 2012. Continued advances in geological knowledge have necessitated successive revisions in order to keep the map up to date. During the most recent update, a number of geographical areas were revised based on new geological data and interpretations, including parts of West Greenland, North Greenland, North-East Greenland, East Greenland and South-East Greenland. The updated map incorporates revised stratigraphic interpretations and improved representation of geological units and structures. The map has undergone extensive quality control, including complete harmonisation of lineaments and structural elements across map-sheet boundaries. The geological legend is dynamic and reflects the content of the current map view. Geological units are supported by descriptive information, and for most map polygons links are provided to a geological unit database containing further descriptions.