 Arctic SDI catalogue
Chlorophyll
Type of resources
Available actions
Topics
Keywords
Contact for the resource
Provided by
Years
Formats
Representation types
Update frequencies
status
Resolution
-
The analysis was performed per season using DIVA software tool (Data-Interpolating Variational Analysis). The analyses products are stored as NetCDF CF files and made available as WMS layers for easy browsing and adding. Every step of the time dimension corresponds to a 6-year moving average from 1983 to 2016. The depth dimension spans from surface to 1000 m, with 21 vertical levels. The boundaries and overlapping zones between these regions were filtered to avoid any unrealistic spatial discontinuities. This combined water body dissolved oxygen concentration product is masked using the relative error threshold 0.5. Units: µmol/l Created by 'University of Liège, GeoHydrodynamics and Environment Research (ULiège-GHER)'. The data used as input for DIVA have been extracted from the EMODnet Chemistry Download Service: https://emodnet-chemistry.maris.nl/search Intermediate regional data products: Mediterranean Sea - DIVA 4D 6-year analysis of Water body chlorophyll-a 1990/2017 v2018, Arctic Ocean - DIVA 4D 6-year analysis of Water body chlorophyll-a 1980/2017 v2018, Black Sea - DIVA 4D 6-year analysis of Water body chlorophyll-a 1990/2016 v2018, North East Atlantic Ocean - DIVA 4D 6-year analysis of Water body chlorophyll-a 1960/2017 v2018, North Sea - DIVA 4D 6-year analysis of Water body chlorophyll-a 1980/2017 v2018, Baltic Sea - DIVA 4D 6-year analysis of Water body chlorophyll-a 1980/2016 v2018
-

PURPOSE: Chlorophyll a is a photosynthetic pigment common to aquatic algae, and its measurement can provide an estimate of free-floating algae abundance in an aquatic system. For more than 40 years, the Fisheries and Oceans Canada - Great Lakes Laboratory for Fisheries and Aquatic Sciences (DFO-GLLFAS) office in Sault Ste. Marie Ontario has collected water samples for chlorophyll a spectrophotometric analysis, producing data in the form of mg/m3. The collection of chlorophyll a data was generally conducted to assist in characterizing the aquatic systems level of primary productivity, since that can influence fish abundance. This was a supplementary measure of the quality of fish habitat in these systems for a variety of fish-related projects of relevance to DFO’s mandate. Consistency of data collection was dependent on the duration of each project and funding available. DESCRIPTION: The initial study collected chlorophyll a data from the five lakes in the Turkey Lakes Watershed (TLW – Upper and Lower Batchawana Lakes, Wishart Lake, Little Turkey Lake and Turkey Lake) as well as Quinn Lake which is located outside of the TLW (see Smokorowski et al. 2006) in partnership with Environment and Climate Change Canada (ECCC) and Natural Resources Canada (NRCAN), as part of Canada’s Acid Rain Initiative. The TLW study was established in 1979 to evaluate the impacts of acid rain on terrestrial and aquatic ecosystems. This dataset encompasses chlorophyll a data collected from five lakes in the TLW and Quinn Lake (data also collected by the Canadian Wildlife Service and Environment and Climate Change Canada) from 1983 - 2010 with some gaps of varying duration (Webster et al., 2021). Note that an experimental habitat removal took place in some TLW lakes and Quinn Lake in 1999 and 2000. Specifically, in autumn of 1999, 50% of the coarse woody material was removed from the shorelines of Little Turkey Lake and Quinn Lake, and in autumn of 2000, 50% of the course woody material was removed from Wishart Lake shoreline (details available in Smokorowski et al., 2006). Methods Summary: Sampling was only conducted during the open water season and the frequency and extent of sampling frequency in each waterbody varied and was project- and funding-dependent. There are no chlorophyll a data for the years 1986, 1989 – 1990, 1996 – 1997, 2006-2007 and 2009. Sampling was accomplished by rinsing on site an appropriately-cleaned 1 L, brown-opaque polyethylene bottles at least three times. For hand draw samples, the bottle was immersed sub-surface (less than 0.5 meters) to collect the sample. Composite tube samples were collected using an integrated water sampling tube that collected epilimnion water from the entire water column to a depth of 5 meters. Up to five - 1 L (1000 mL) samples were collected per station and returned to the lab on ice. Each 1 L sample was filtered using glass fiber filters (Whatman GF/C, 42.5 mm) within one day of sampling, and then frozen prior to standard chlorophyll a analysis (American Public Health Association [APHA] 1985). From 1983-1998, Chlorophyll a concentrations (mg/L) was calculated based on APHA 1985; from 1998 to present the calculation was based on APHA (1998). The sample dataset information includes the georeferenced sampling locations, the raw data for chlorophyll a calculations, and the calculated chlorophyll a concentrations using both the APHA (1985) and APHA (1998) methods. This dataset was published in partnership with the Canadian Institute of Ecology and Evolution - Living Data Project, which was funded by a CREATE grant from the Natural Science and Engineering Research Council of Canada. We would like to recognize Caroline Dallstream for her effort in publishing this dataset. SAMPLING METHODS: Methods Summary: Sampling was only conducted during the open water season and the frequency and extent of sampling frequency in each waterbody varied and was project- and funding-dependent. There are no chlorophyll a data for the years 1986, 1989 – 1990, 1996 – 1997, 2006-2007 and 2009. See Sampling was accomplished by rinsing on site an appropriately-cleaned 1 L, brown-opaque polyethylene bottles at least three times. For hand draw samples, the bottle was immersed sub-surface (less than 0.5 meters) to collect the sample. Composite tube samples were collected using an integrated water sampling tube that collected epilimnion water from the entire water column to a depth of 5 meters. Up to five - 1 L (1000 mL) samples were collected per station and returned to the lab on ice. Each 1 L sample was filtered using glass fiber filters (Whatman GF/C, 42.5 mm) within one day of sampling, and then frozen prior to standard chlorophyll a analysis (American Public Health Association [APHA] 1985). From 1983-1998, Chlorophyll a concentrations (mg/L) was calculated based on APHA 1985; from 1998 to present the calculation was based on APHA (1998). The sample dataset information includes the georeferenced sampling locations, the raw data for chlorophyll a calculations, and the calculated chlorophyll a concentrations using both the APHA (1985) and APHA (1998) methods. USE LIMITATION: To ensure scientific integrity and appropriate use of the data, we would encourage you to contact the data custodian.
-

Chlorophyll-a (mg/m2) time series at the 3 fixed stations and 46 stations, grouped into transects, of the Atlantic Zonal Monitoring Program (AZMP) under the Quebec region responsibility. The mean integrated chlorophyll-a data (0-100 m) of the last ten years are displayed as 2 layers, one for the June survey (2013-2022. 2020 not sampled), another for the autumn survey (2013-2022). A third layer shows the positions of the fixed stations of the program (Anticosti Gyre, Gaspé Current and Rimouski). Each station is linked with a .png file showing the chlorophyll-a time series and with a .csv file containing all the integrated chlorophyll-a data acquired at those stations since the beginning of the program sampling (columns : Station, Latitude, Longitude, Date(UTC), Sounding(m), Depth_min/Profondeur_min(m), Depth_max/Profondeur_max(m), Integrated_chlorophyll-a/Chlorophylle-a_intégrée(mg/m²)). Purpose The Atlantic Zone Monitoring Program (AZMP) was implemented in 1998 with the aim of increasing the Department of Fisheries and Oceans Canada’s (DFO) capacity to detect, track and predict changes in the state and productivity of the marine environment. The AZMP collects data from a network of stations composed of high-frequency monitoring sites and cross-shelf sections in each following DFO region: Québec, Gulf, Maritimes and Newfoundland. The sampling design provides basic information on the natural variability in physical, chemical, and biological properties of the Northwest Atlantic continental shelf. Cross-shelf sections sampling provides detailed geographic information but is limited in a seasonal coverage while critically placed high-frequency monitoring sites complement the geography-based sampling by providing more detailed information on temporal changes in ecosystem properties. In Quebec region, two surveys (46 stations grouped into transects) are conducted every year, one in June and the other in autumn in the Estuary and Gulf of St. Lawrence. Historically, 3 fixed stations were sampled more frequently. One of these is the Rimouski station that still takes part of the program and is sampled about weekly throughout the summer and occasionally in the winter period. Annual reports (physical, biological and a Zonal Scientific Advice) are available from the Canadian Science Advisory Secretariat (CSAS), (http://www.dfo-mpo.gc.ca/csas-sccs/index-eng.htm). Devine, L., Scarratt, M., Plourde, S., Galbraith, P.S., Michaud, S., and Lehoux, C. 2017. Chemical and Biological Oceanographic Conditions in the Estuary and Gulf of St. Lawrence during 2015. DFO Can. Sci. Advis. Sec. Res. Doc. 2017/034. v + 48 pp. Supplemental Information Water sampling for chlorophyll-a analysis (Welschmeyer 1994 method) is done from Niskin bottles according to AZMP sampling protocol: Mitchell, M. R., Harrison, G., Pauley, K., Gagné, A., Maillet, G., and Strain, P. 2002. Atlantic Zonal Monitoring Program sampling protocol. Can. Tech. Rep. Hydrogr. Ocean Sci. 223: iv + 23 pp.
-

Ocean physical conditions in the Maritimes Region in 2019 were characterized by cooler surface temperatures, continued warmer bottom temperatures and weaker stratification compared to recent years. Deep nutrient inventories were lower than normal over most of the region, with the exception of the Cabot Strait section where deep nutrients were near or higher than normal during the spring sampling and associated with record-warm water. Anomalies of surface nutrients were negative across the region, with the exception of positive anomalies observed at the deep shelf and offshore stations of the Louisbourg section. The spring phytoplankton bloom was near or slightly earlier than normal across the Scotian Shelf (SS) with near-normal duration. Peak chlorophyll a concentrations during the spring bloom occurred within a narrow time window across the SS. At Halifax-2 (HL2), the spring bloom was characterized by a high amplitude, and a rapid progression and decline. Plankton community changes persisted in 2019 with lower abundance of large phytoplankton (diatoms), mainly lower-than-normal biomass of zooplankton and abundance of Calanus finmarchicus, and higher-than-normal abundance of non-copepods. Arctic Calanus and warm-shelf copepods showed mixed abundance anomalies in 2019, reversing the pattern of 2018. Above-normal abundances of Oithona atlantica, especially at HL2, suggest a greater influence of offshore waters in recent years. Surface temperature in the Bedford Basin was near normal in 2019 with mainly cooler-than-normal temperatures from January to June and near- or slightly-above-normal temperatures from July to December. Bottom temperature and salinity were below normal in 2019 with near- or slightly-above-normal conditions at the start of the year and progressing toward cooler and fresher water from February to December. Surface and deep nitrate, phosphate and silicate were near or below normal, with surface phosphate reaching a record low in 2019. The 2018 Continuous Plankton Recorder data indicated an annual abundance of diatoms close to normal for the Eastern (ESS) and Western Scotian Shelf (WSS), while the abundance of dinoflagellates and the Phytoplankton Colour Index values were near (WSS) or above (ESS) normal. The annual abundance of Calanus CI-IV was near normal (ESS) or slightly below normal (WSS), while C. finmarchicus CV-VI levels were slightly below (ESS) or below (WSS) normal. The abundance of Calanus glacialis (ESS, WSS) and Para/Pseudocalanus and Limacina spp. (WSS) were lower than normal, while that of coccolithphore (ESS, WSS), and copepod nauplii and foraminifera (ESS) was higher than normal. "
-

Moving 6-year analysis of chlorophyll-a in the Arctic Region for each season: winter (December-February), spring (March-May), summer (June-August) and autumn (September-November). Every year of the time dimension corresponds to the 6-year centred average of each season. 6-year periods span from 1980-1985, 1981-1986, ....., until 2012-2017. Depth range (IODE standard depths): -300.0, -250.0, -200.0, -150.0, -125.0, -100.0, -75.0, -50.0,-40.0, -30.0, -20.0, -10.0, -5.0, -0.0. Data Sources: observational data from SeaDataNet/EMODnet Chemistry Data Network. Description of DIVA analysis: Geostatistical data analysis by DIVA (Data-Interpolating Variational Analysis) tool. GEBCO 1min topography is used for the contouring preparation. Analysed field masked using relative error threshold 0.3 and 0.5. DIVA settings: signal-to-noise ratio and correlation length were estimated using data mean distance as a minimum (for L) and vertically filtered. Background field: A reference field of all seasonal data between 1980-2017. Detrending of data: no. Advection constraint applied: no. Units: umol/l.
-
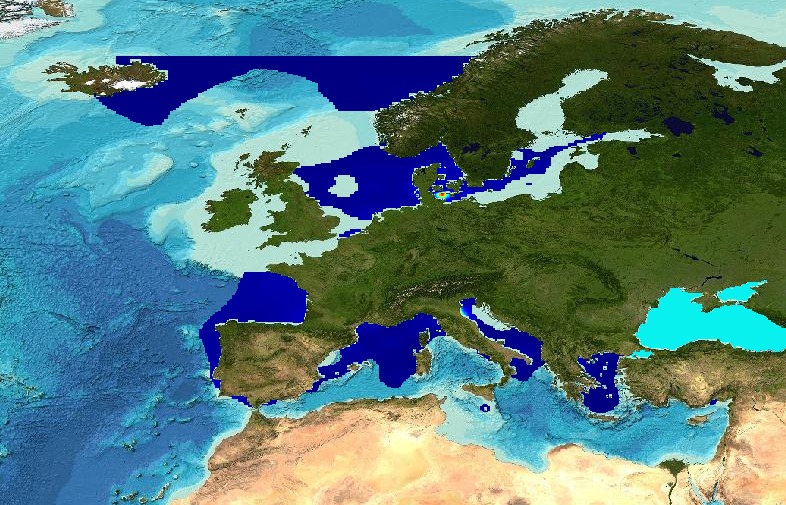
Water_body_chlorophyll-a - Monthly Climatology for the European Seas for the period 1960-2023 on the domain from longitude -45.0 to 70.0 degrees East and latitude 24.0 to 83.0 degrees North. Data Sources: observational data from SeaDataNet/EMODnet Chemistry Data Network. Description of DIVA analysis: The computation was done with the DIVAnd (Data-Interpolating Variational Analysis in n dimensions), version 2.7.12, using GEBCO 30sec topography for the spatial connectivity of water masses. Horizontal correlation length and vertical correlation length vary spatially depending on the topography and domain. Depth range: 0.0, 5.0, 10.0, 15.0, 20.0, 25.0, 30.0, 35.0, 40.0, 45.0, 50.0, 55.0, 60.0, 65.0, 70.0, 75.0, 80.0, 85.0, 90.0, 95.0, 100.0, 125.0, 150.0, 175.0, 200.0, 225.0, 250.0, 275.0, 300.0, 325.0, 350.0, 375.0, 400.0, 425.0, 450.0, 475.0, 500.0, 550.0, 600.0, 650.0, 700.0, 750.0, 800.0, 850.0, 900.0, 950.0, 1000.0, 1050.0, 1100.0, 1150.0, 1200.0, 1250.0, 1300.0, 1350.0, 1400.0, 1450.0, 1500.0, 1550.0, 1600.0, 1650.0, 1700.0, 1750.0, 1800.0, 1850.0, 1900.0, 1950.0, 2000.0, 2100.0, 2200.0, 2300.0, 2400.0, 2500.0, 2600.0, 2700.0, 2800.0, 2900.0, 3000.0, 3100.0, 3200.0, 3300.0, 3400.0, 3500.0, 3600.0, 3700.0, 3800.0, 3900.0, 4000.0, 4100.0, 4200.0, 4300.0, 4400.0, 4500.0, 4600.0, 4700.0, 4800.0, 4900.0, 5000.0, 5100.0, 5200.0, 5300.0, 5400.0, 5500.0 m. Units: mg/m3. The horizontal resolution of the produced DIVAnd analysis is 0.25 degrees.
-
Water body chlorophyll-a - Monthly Climatology for the European Seas for the period 1960-2020 on the domain from longitude -45.0 to 70.0 degrees East and latitude 24.0 to 83.0 degrees North. Data Sources: observational data from SeaDataNet/EMODnet Chemistry Data Network. Description of DIVA analysis: The computation was done with the DIVAnd (Data-Interpolating Variational Analysis in n dimensions), version 2.7.2, using GEBCO 30sec topography for the spatial connectivity of water masses. Horizontal correlation length and vertical correlation length vary spatially depending on the topography and domain. Depth range: 0.0, 5.0, 10.0, 15.0, 20.0, 25.0, 30.0, 35.0, 40.0, 45.0, 50.0, 55.0, 60.0, 65.0, 70.0, 75.0, 80.0, 85.0, 90.0, 95.0, 100.0, 125.0, 150.0, 175.0, 200.0, 225.0, 250.0, 275.0, 300.0, 325.0, 350.0, 375.0, 400.0, 425.0, 450.0, 475.0, 500.0, 550.0, 600.0, 650.0, 700.0, 750.0, 800.0, 850.0, 900.0, 950.0, 1000.0, 1050.0, 1100.0, 1150.0, 1200.0, 1250.0, 1300.0, 1350.0, 1400.0, 1450.0, 1500.0, 1550.0, 1600.0, 1650.0, 1700.0, 1750.0, 1800.0, 1850.0, 1900.0, 1950.0, 2000.0, 2100.0, 2200.0, 2300.0, 2400.0, 2500.0, 2600.0, 2700.0, 2800.0, 2900.0, 3000.0, 3100.0, 3200.0, 3300.0, 3400.0, 3500.0, 3600.0, 3700.0, 3800.0, 3900.0, 4000.0, 4100.0, 4200.0, 4300.0, 4400.0, 4500.0, 4600.0, 4700.0, 4800.0, 4900.0, 5000.0, 5100.0, 5200.0, 5300.0, 5400.0, 5500.0 m. Units: mg/m3. The horizontal resolution of the produced DIVAnd analysis is 0.25 degrees.
-

A chlorophyll fluorescence time series was collected at various locations around the coast of Vancouver Island, British Columbia, Canada for monitoring phytoplankton concentrations. A Wetlabs ECO fluorometer was deployed every few months on a schedule depending on season and sensor availability. The instrument hung by a chain attached to the side of the buoy, or dock, depending on location, and measured chlorophyll using the fluorescence emission at 695nm. The instrument also measured turbidity by detecting the scattered light at 700nm. The units had internal batteries and data storage and were programmed to make a group of 5 measurements every 30 minutes. A copper wiper covered the sampling window between groups of measurements to reduce fouling. Times are in UTC unless otherwise stated.
-

These datasets provide information pertaining to sediment grain size, porosity, organic content, total carbon and nitrogen concentrations, trace element concentrations, chlorophyll and phaeopigment concentrations, and meiofauna and macrofaunal abundance in Simoom Sound between November, 2000, and February, 2001. Data formatting of files were performed by Meagan Mak. Sutherland et al (2023) covers the benthic component of a broader project investigating potential modification of marine ecosystems by shrimp trawling and trapping on the central coast of British Columbia. Sediment and infaunal samples were collected before and after fishing with commercial fishing gear consisting of otter-trawl, beam-trawl, and trap-lines. Simoom Sound was sampled in November 2000 and February 2001. Tabulated data of sediment characteristics that include sediment grain size, porosity, carbon and nitrogen content, trace-element, and chlorophyll concentrations are presented in this report. In addition, the infaunal data are comprised of both macrofaunal and meiofaunal communities.
-
Water body chlorophyll-a - Monthly Climatology for the European Seas for the period 1960-2020 on the domain from longitude -45.0 to 70.0 degrees East and latitude 24.0 to 83.0 degrees North. Data Sources: observational data from SeaDataNet/EMODnet Chemistry Data Network. Description of DIVA analysis: The computation was done with the DIVAnd (Data-Interpolating Variational Analysis in n dimensions), version 2.7.9, using GEBCO 30sec topography for the spatial connectivity of water masses. Horizontal correlation length and vertical correlation length vary spatially depending on the topography and domain. Depth range: 0.0, 5.0, 10.0, 15.0, 20.0, 25.0, 30.0, 35.0, 40.0, 45.0, 50.0, 55.0, 60.0, 65.0, 70.0, 75.0, 80.0, 85.0, 90.0, 95.0, 100.0, 125.0, 150.0, 175.0, 200.0, 225.0, 250.0, 275.0, 300.0, 325.0, 350.0, 375.0, 400.0, 425.0, 450.0, 475.0, 500.0, 550.0, 600.0, 650.0, 700.0, 750.0, 800.0, 850.0, 900.0, 950.0, 1000.0, 1050.0, 1100.0, 1150.0, 1200.0, 1250.0, 1300.0, 1350.0, 1400.0, 1450.0, 1500.0, 1550.0, 1600.0, 1650.0, 1700.0, 1750.0, 1800.0, 1850.0, 1900.0, 1950.0, 2000.0, 2100.0, 2200.0, 2300.0, 2400.0, 2500.0, 2600.0, 2700.0, 2800.0, 2900.0, 3000.0, 3100.0, 3200.0, 3300.0, 3400.0, 3500.0, 3600.0, 3700.0, 3800.0, 3900.0, 4000.0, 4100.0, 4200.0, 4300.0, 4400.0, 4500.0, 4600.0, 4700.0, 4800.0, 4900.0, 5000.0, 5100.0, 5200.0, 5300.0, 5400.0, 5500.0 m. Units: mg/m3. The horizontal resolution of the produced DIVAnd analysis is 0.25 degrees.