 Arctic SDI catalogue
MODIS
Type of resources
Available actions
Topics
Keywords
Contact for the resource
Provided by
Years
Formats
Representation types
Update frequencies
status
Service types
Scale
-
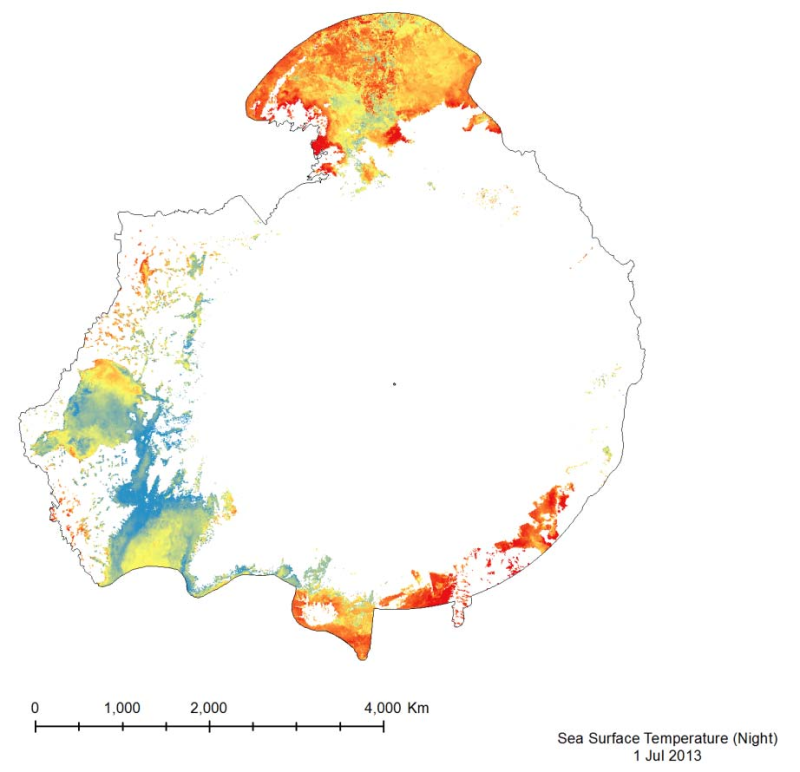
The MODIS Sea Surface Temperature (SST) product provided is a 4km spatialresolution monthly composite made from nighttime measurements from the Aqua Satellite.The nighttime measurements are used to collect a consistent temperature measurement that isunaffected by the warming of the top layer of water by the sun.
-

Data include a collection of annual land cover maps derived from MODIS 250 m spatial resolution remotely sensed imagery for the period 2000 to 2011. Processing of the time series was designed to reduce the occurrence of false change between maps. The method was based on change updating as described in Pouliot et al. (2011, 2013). Change detection accounted for both abrupt changes such as forest harvesting and more gradual changes such as recurrent insect defoliation. To determine the new label for a pixel identified as change, an evidential reasoning approach was used to combine spectral and contextual information. The 2005 MODIS land cover of Canada at 250 m spatial resolution described in Latifovic et al. (2012) was used as the base map. It contains 39 land cover classes, which for time series development was considered too detailed and was reduced to 25 and 19 class versions. The 19 class version corresponds to the North America Land Change Monitoring System (NALCMS) Level 2 legend as described in Latifovic et al. (2012). Accuracy assessment of time series is difficult due to the need to assess many maps. For areas of change in the time series accuracy was found to be 70% based on the 19 class thematic legend. This time series captures the spatial distribution of dominant land cover transitions. It is intended for use in modeling, development of remote sensing products such as leaf area index or land cover based albedo retrievals, and other exploratory analysis. It is not appropriate for use in any rigorous reporting or inventory assessments due to the accuracy of the land cover classification and uncertainty as to the capture of all relevant changes for an application. NOTE: To see this entire product in the map viewer, use a base map in the "World" section (EPSG: 3857).
-
Ocean colour and SST data from the AVHRR, MODIS and MERIS sensors for the UK area
-
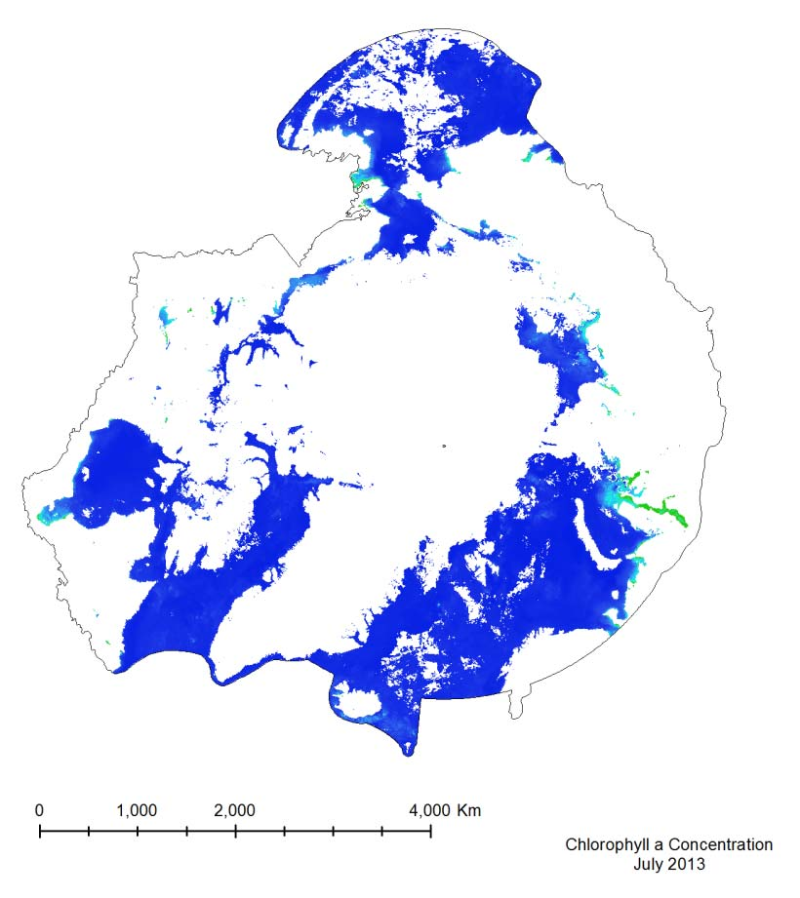
The MODIS marine chlorophyll a product provided, similar to SST, is a 4 km global monthly composite based on smaller resolution daily imagery compiled by NASA. The imagery is reliant on clear ocean (free of clouds and ice) so only months from March to October have been provided, as the chlorophyll levels in the Arctic diminish during the winter months, when sea ice is prevalent. The marine chlorophyll a is measured in mg/m3
-
It has not been possible to identify available trend data for Arctic Ocean sea surface temperatures because there is not enough data to calculate reliable long-term trends for much of the Arctic marine environment (IPCC 2013, NOAA 2015). Here, sea surface temperature for July 2015 is shown from CAFF’s Land Cover Change Index. MODIS Sea Surface Temperature (SST) provided a four-kilometre spatial resolution monthly composite snapshot made from night-time measurements from the NASA Aqua Satellite. The night-time measurements are used to collect a consistent temperature measurement that is unaffected by the warming of the top layer of water by the sun. STATE OF THE ARCTIC MARINE BIODIVERSITY REPORT - <a href="https://arcticbiodiversity.is/marine" target="_blank">Chapter 2</a> - Page 25 - Figure 2.3
-
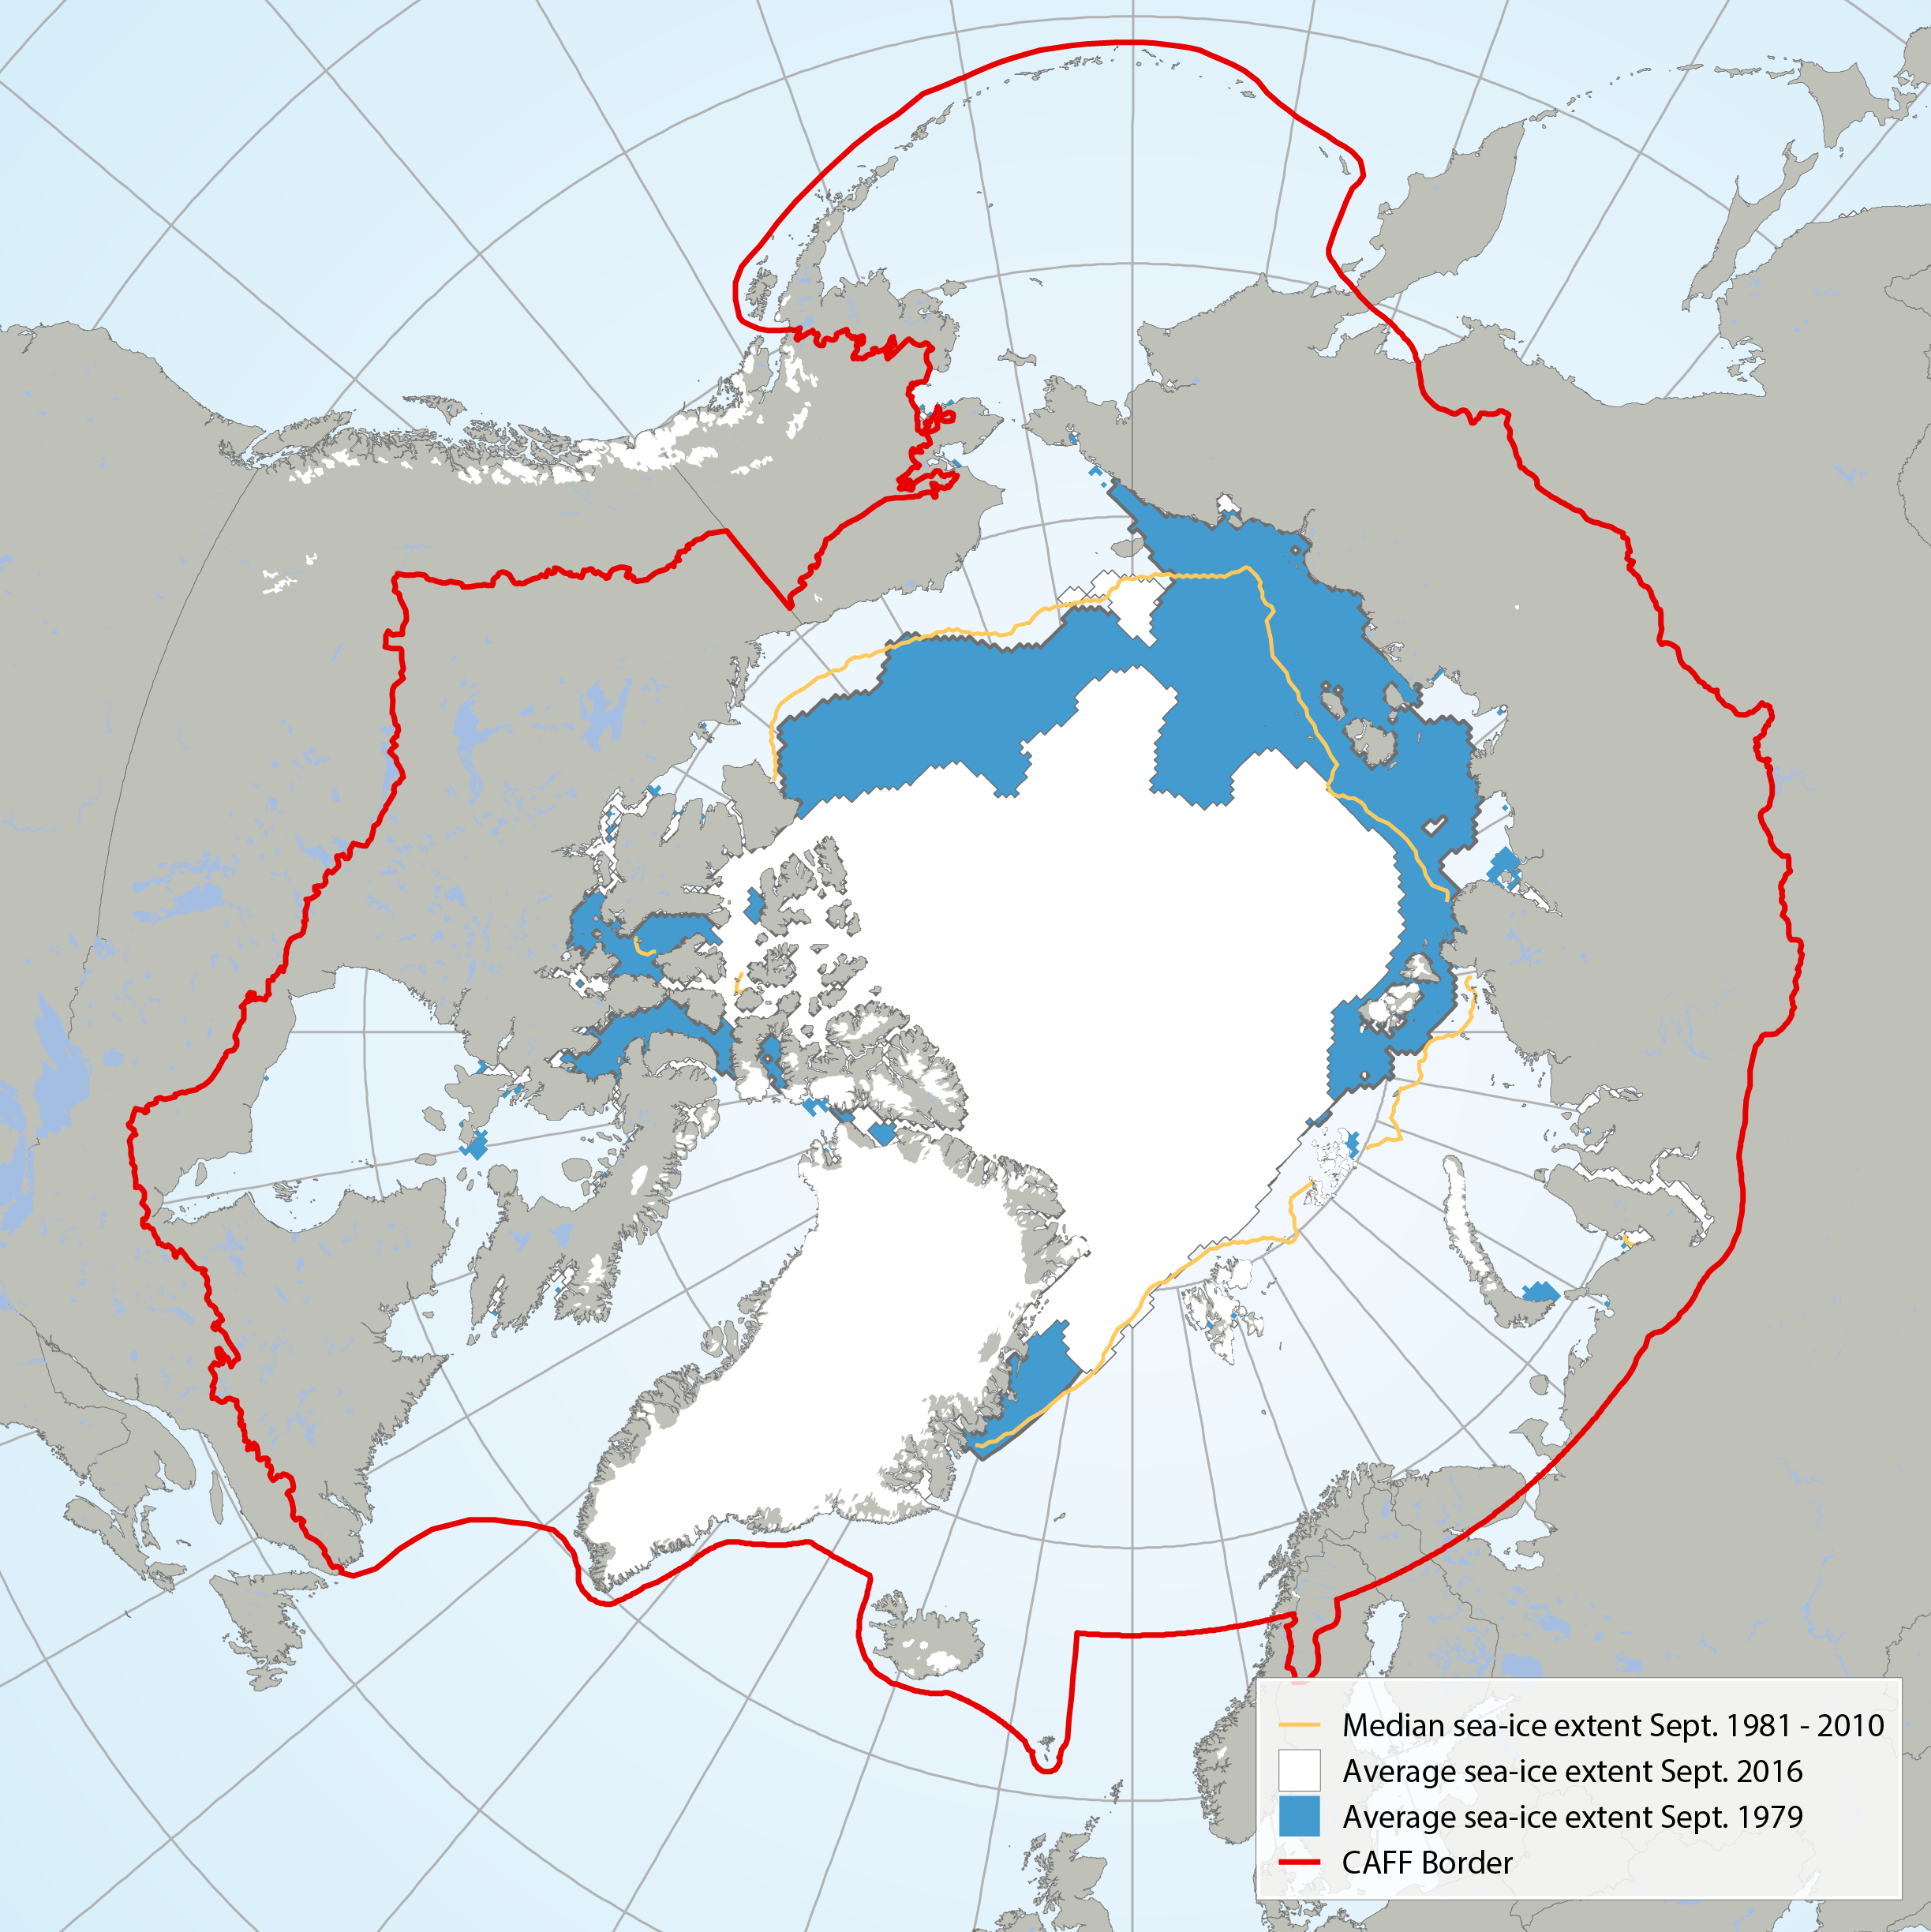
Average September sea ice extent in 1979 (blue) compared with 2016 (white) and the median sea ice extent (yellow line) from 1981 to 2010 (Data: NSDIC 2016). STATE OF THE ARCTIC MARINE BIODIVERSITY REPORT - <a href="https://arcticbiodiversity.is/marine" target="_blank">Chapter 2</a> - Page 27 - Figure 2.4
-
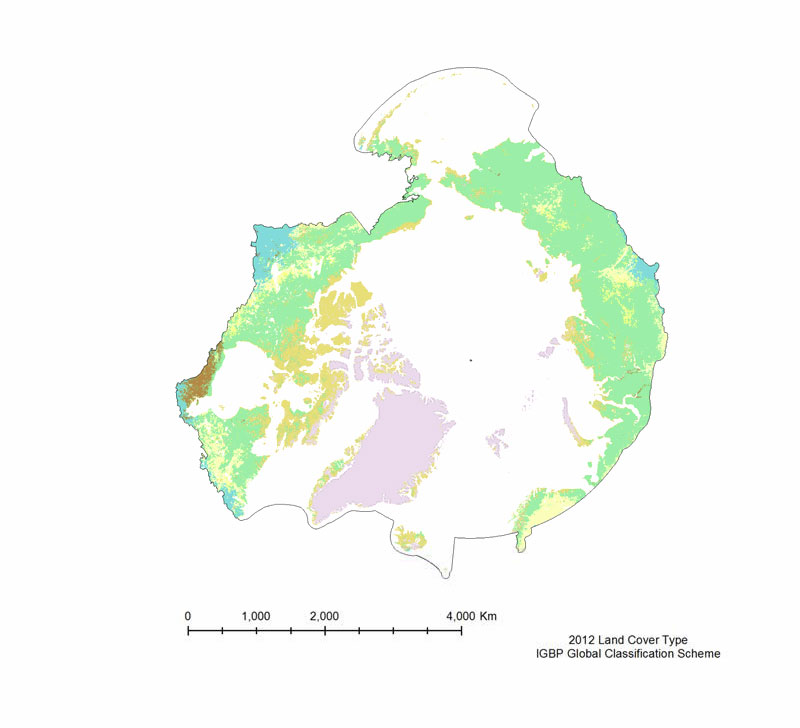
The MODIS Land Cover Type product is created yearly using three landclassification schemes; the International Geosphere Biosphere Programme (IGBP)classification scheme, the Univertiy of Maryland (UMD) classification scheme, and aMODIS-derived Leaf Area Index /Fraction of Photosynthetically Active Radiation(LAI/fPAR) classification scheme (Table 3). The International Geosphere Biosphere Programme (IGBP) identifies seventeenland cover classes, including eleven natural vegetation classes, three non-vegetated landclasses, and three developed land classes. The product provided is derived using the samealgorithm as the 500 m Land Cover Type (MOD12Q1), but is on a 0.05° Climate Model Grid(CMG), that has been clipped to the pan-Arctic extent. The UMD classification scheme issimilar to the IGBP classification scheme, but it excludes the Permanent wetlands,Cropland/Natural vegetation mosaic, and the Snow and ice classes. The LAI/fPARclassification scheme is the smallest of the three, and focuses on forest structure; it only haseleven classes. All three land cover classification schemes are provided, but the IGBPclassification scheme is the most amenable to the Pan-Arctic region.
-
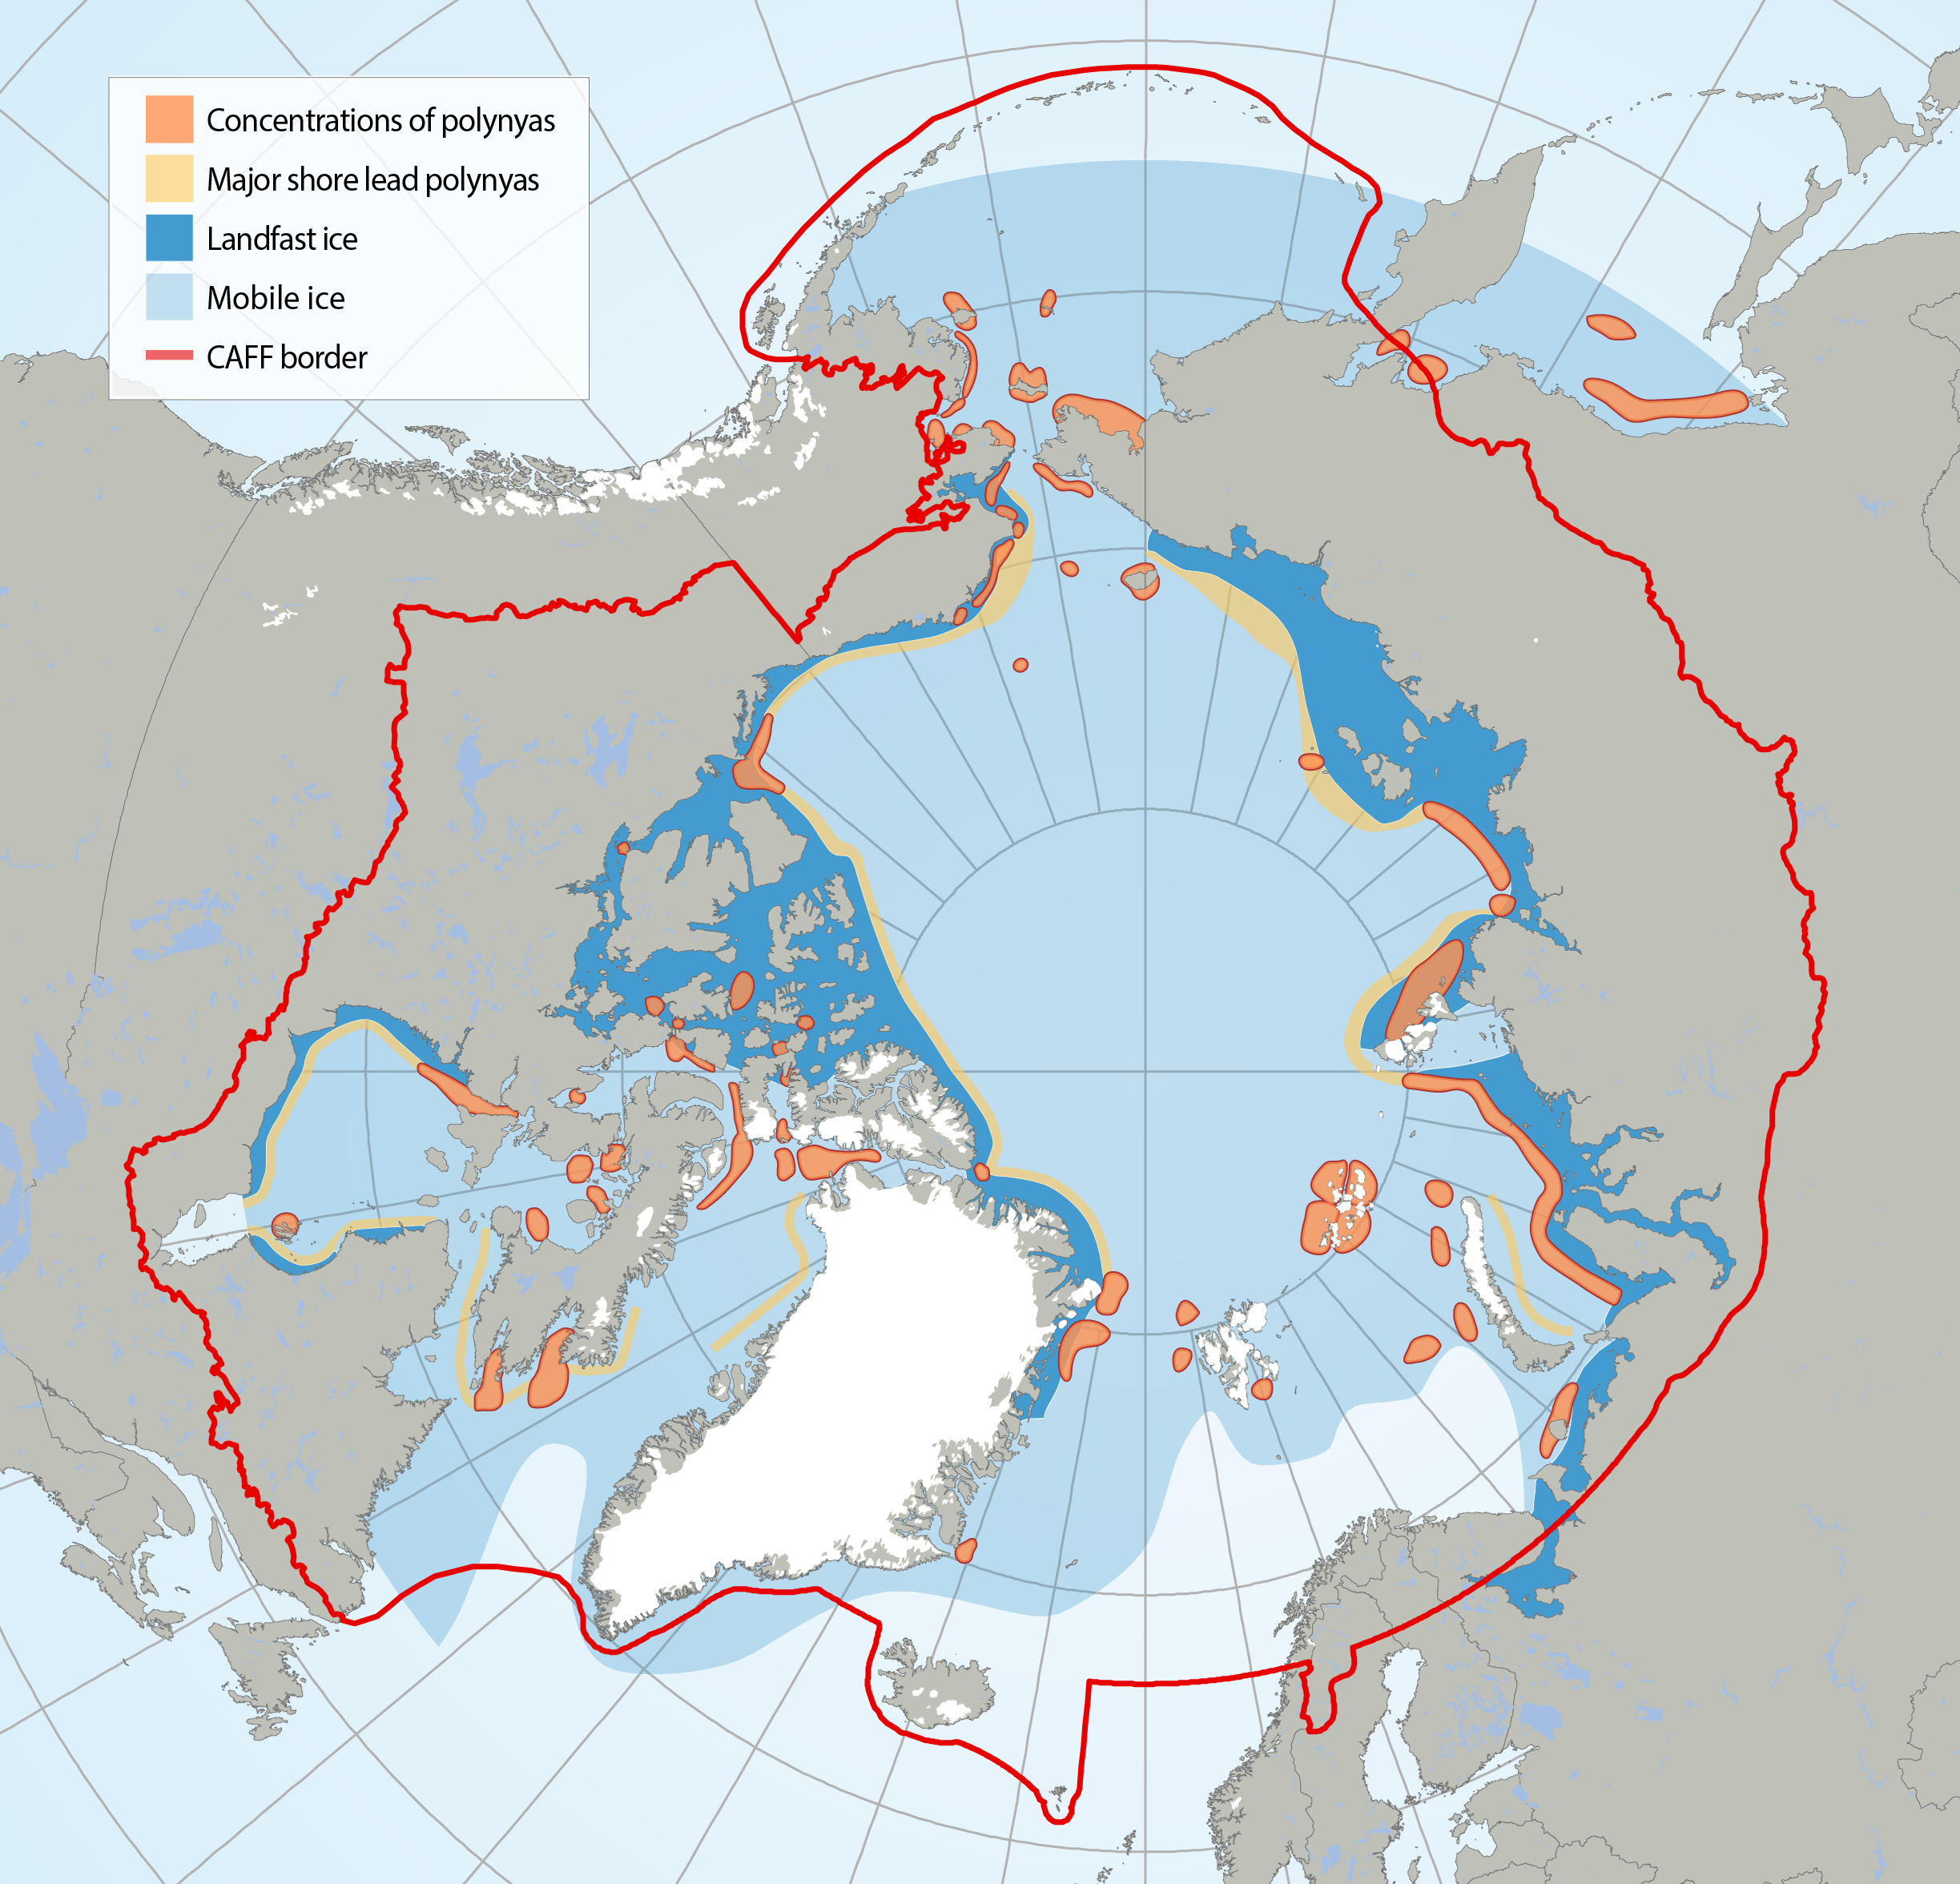
Circumpolar map of known polynyas. Note that polynyas are dynamic systems and some may no longer exist in the form known from their recent history. Adapted from Meltofte (2013) and based on Barber and Massom (2007). STATE OF THE ARCTIC MARINE BIODIVERSITY REPORT - <a href="https://arcticbiodiversity.is/marine" target="_blank">Chapter 2</a> - Page 28 - Figure 2.5
-
The Land Cover Dynamics MODIS product is a yearly product that represents thetiming of vegetation phenology globally. Sub-datasets include vegetation growth, maturity,senescence, and dormancy. This product also includes the NBAR-(Nadir Bidirectionalreflectance distribution function (BRDF) adjusted Reflectance) based EVI, in part becausethe EVI is used to create the Land Cover Dynamics. The Land Cover Dynamics product uses both Terra and Aqua MODIS data. Version005 (provided) has a 500 m spatial resolution, which is an improvement from the 1,000 mversion 004 product. This product is only available in MODIS tiles, so the tiles needed tocover the CAFF pan-Arctic region has been downloaded but not clipped to the pan-Arcticextent at this time.
-
The cloud-corrected NDVI data extracted from historical MODIS satellite images at 250 metre resolution provides reliable, objective, and timely information on the state of vegetation throughout Canada and the northern United States. The methodology applied to the images has remained the same as for the program formerly known as the Crop Condition Assessment Program (CCAP). Since the 2000 growing season, Statistics Canada has been processing and compiling MODerate-resolution Imaging Spectoradiometer (MODIS) data (250 metre resolution). The Multi-Spectral Instrument (MSI) captures two spectral bands (red and infrared) that have proven to be extremely useful to produce the Normalized Difference Vegetation Index (NDVI) utilized for vegetation monitoring. The original NDVI image composites were produced by Agriculture and Agri-Food Canada (link to original data in the resources section). Additional computations were completed by Statistics Canada to remove the effects of residual clouds and to calculate and extract the NDVI by geographic region. This dataset provides access to the MODIS images from 2000 to present in GeoTIFF format and covers the crop area during the growing season (Julian weeks 15 to 37; mid-April to mid-September). It also provides access to a database that contains the statistical NDVI by geographic regions (Townships, Census Consolidated Subdivisions (CCS), Census Divisions (CD) and Census Agricultural Regions (CAR)) and agricultural masks (Agriculture (AGR), Crop (CROP) and Pasture (PAS)).