 Arctic SDI catalogue
Surface
Type of resources
Available actions
Topics
Keywords
Contact for the resource
Provided by
Formats
Representation types
Update frequencies
status
Scale
-

Mapping of the centers of watercourses and surface watercourses on the territory of Quebec City.**This third party metadata element was translated using an automated translation tool (Amazon Translate).**
-
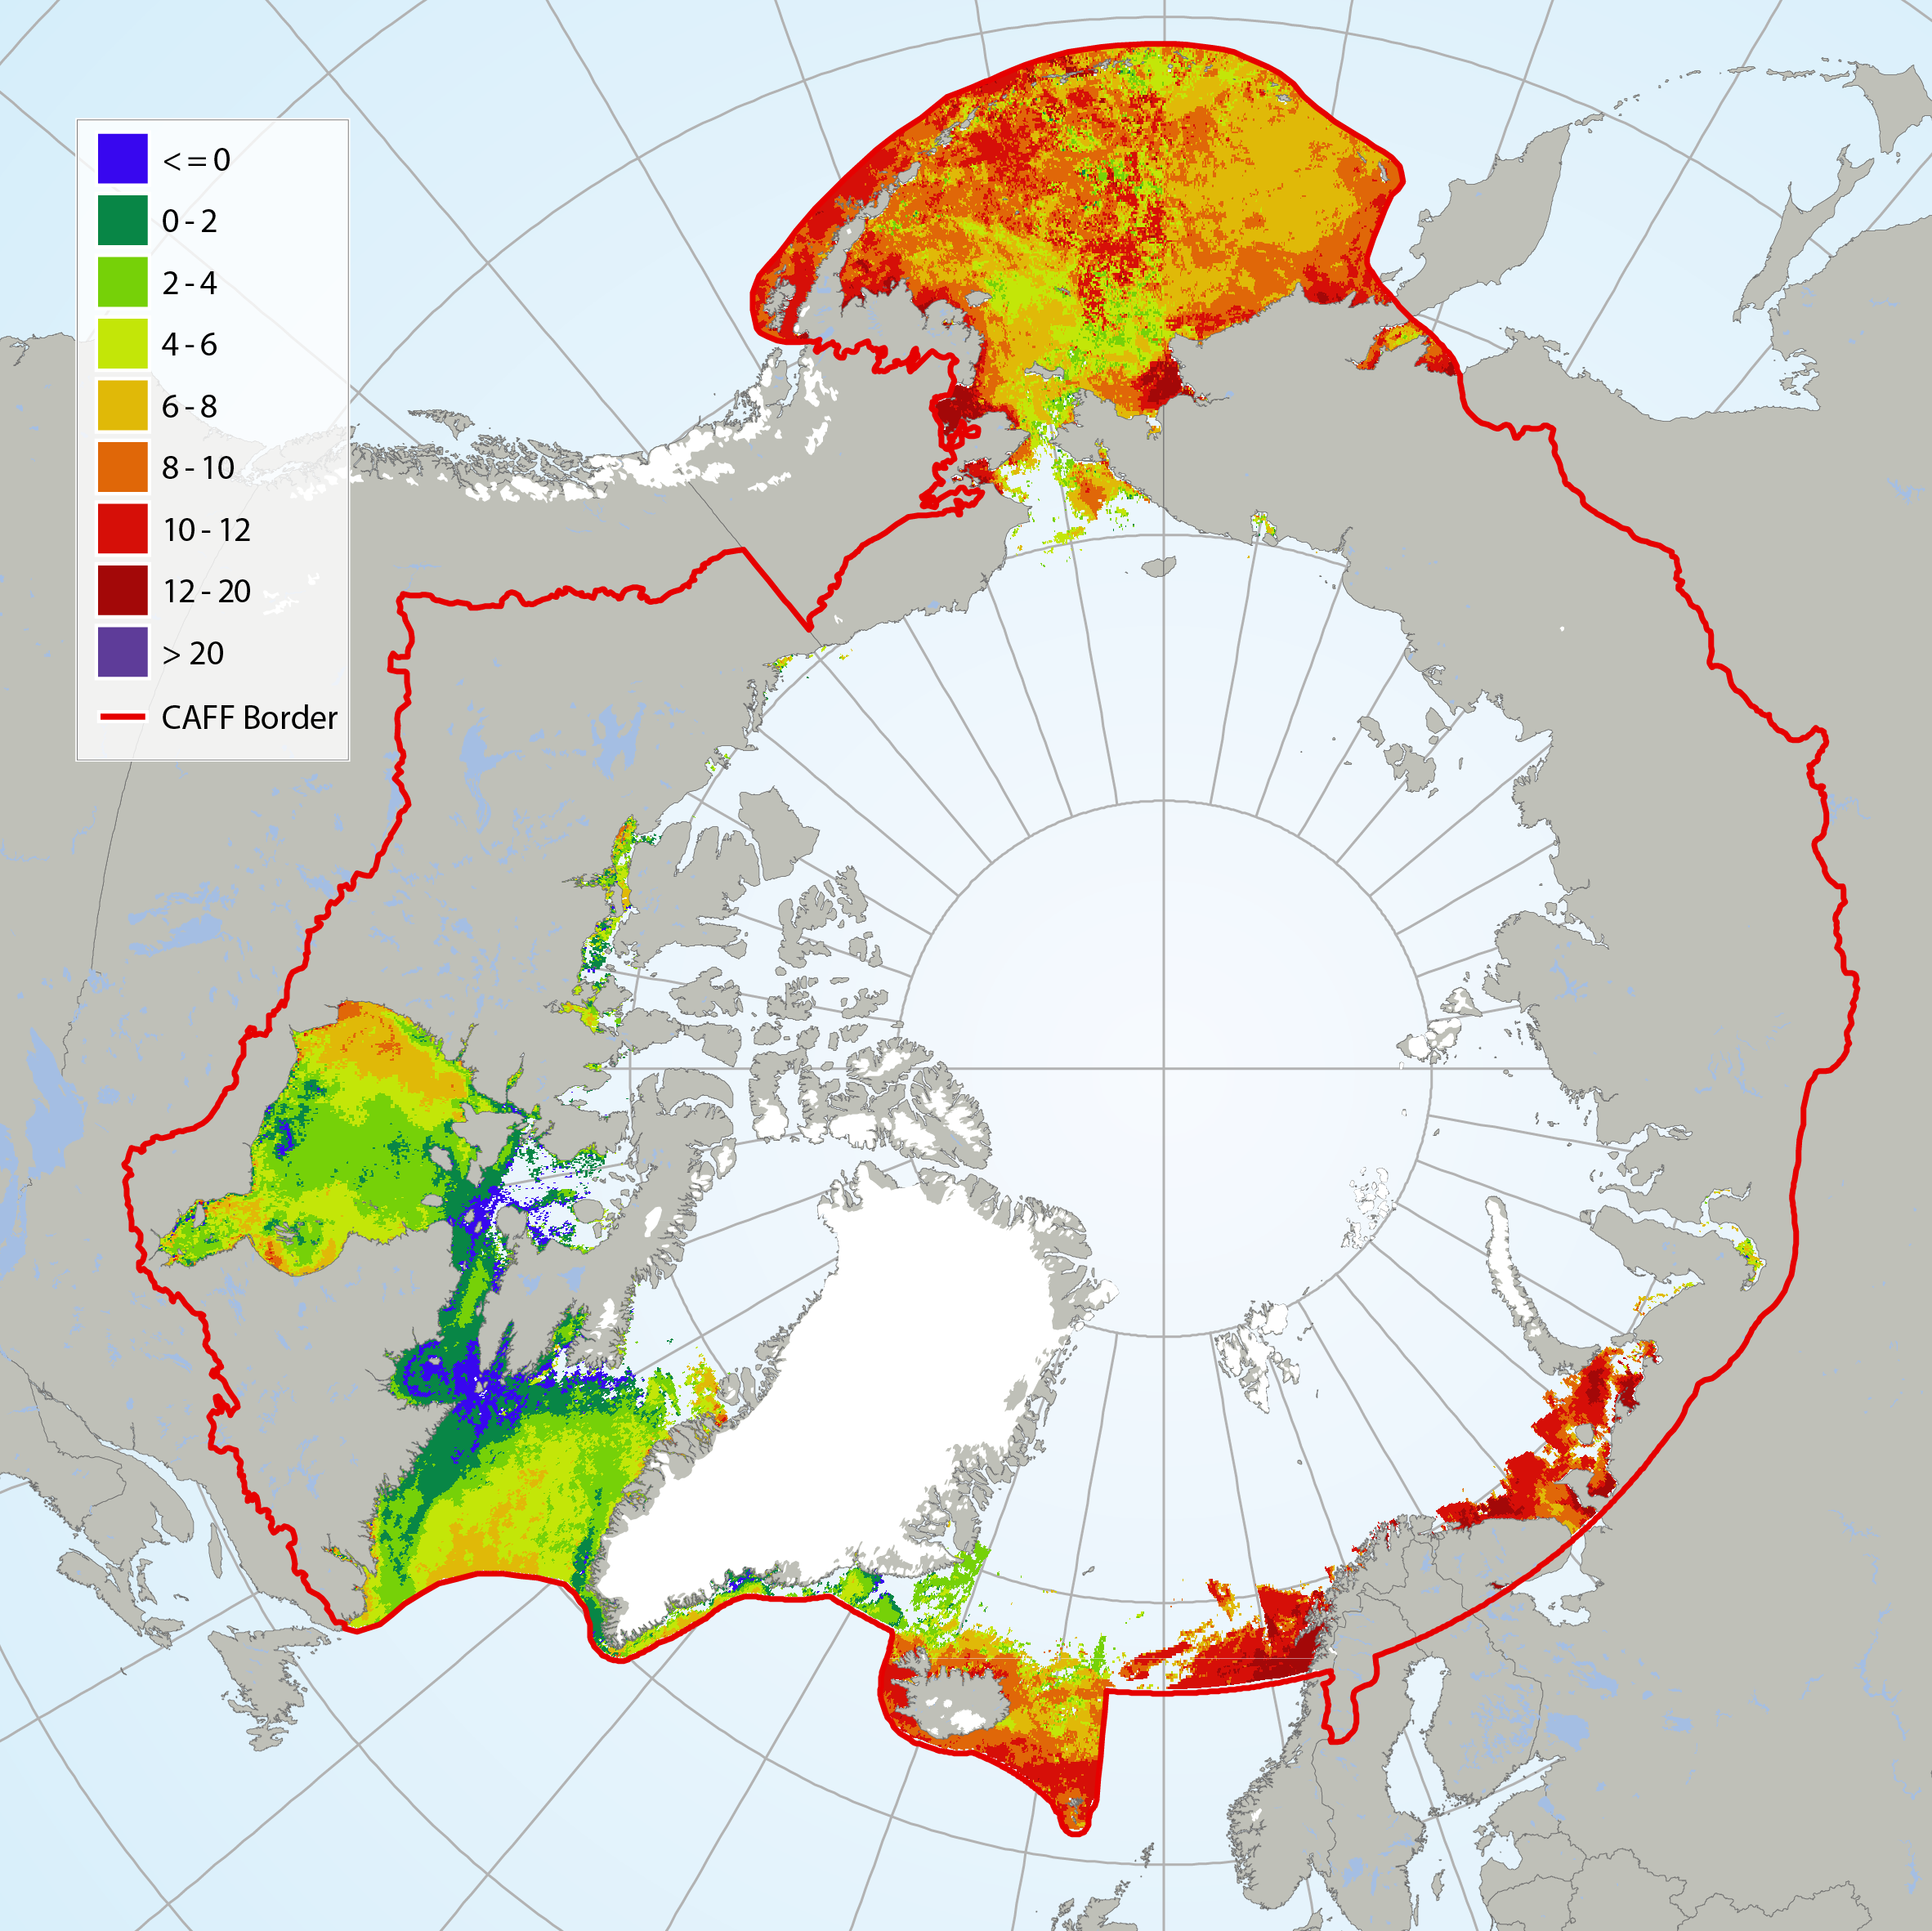
It has not been possible to identify available trend data for Arctic Ocean sea surface temperatures because there is not enough data to calculate reliable long-term trends for much of the Arctic marine environment (IPCC 2013, NOAA 2015). Here, sea surface temperature for July 2015 is shown from CAFF’s Land Cover Change Index. MODIS Sea Surface Temperature (SST) provided a four-kilometre spatial resolution monthly composite snapshot made from night-time measurements from the NASA Aqua Satellite. The night-time measurements are used to collect a consistent temperature measurement that is unaffected by the warming of the top layer of water by the sun. STATE OF THE ARCTIC MARINE BIODIVERSITY REPORT - <a href="https://arcticbiodiversity.is/marine" target="_blank">Chapter 2</a> - Page 25 - Figure 2.3
-
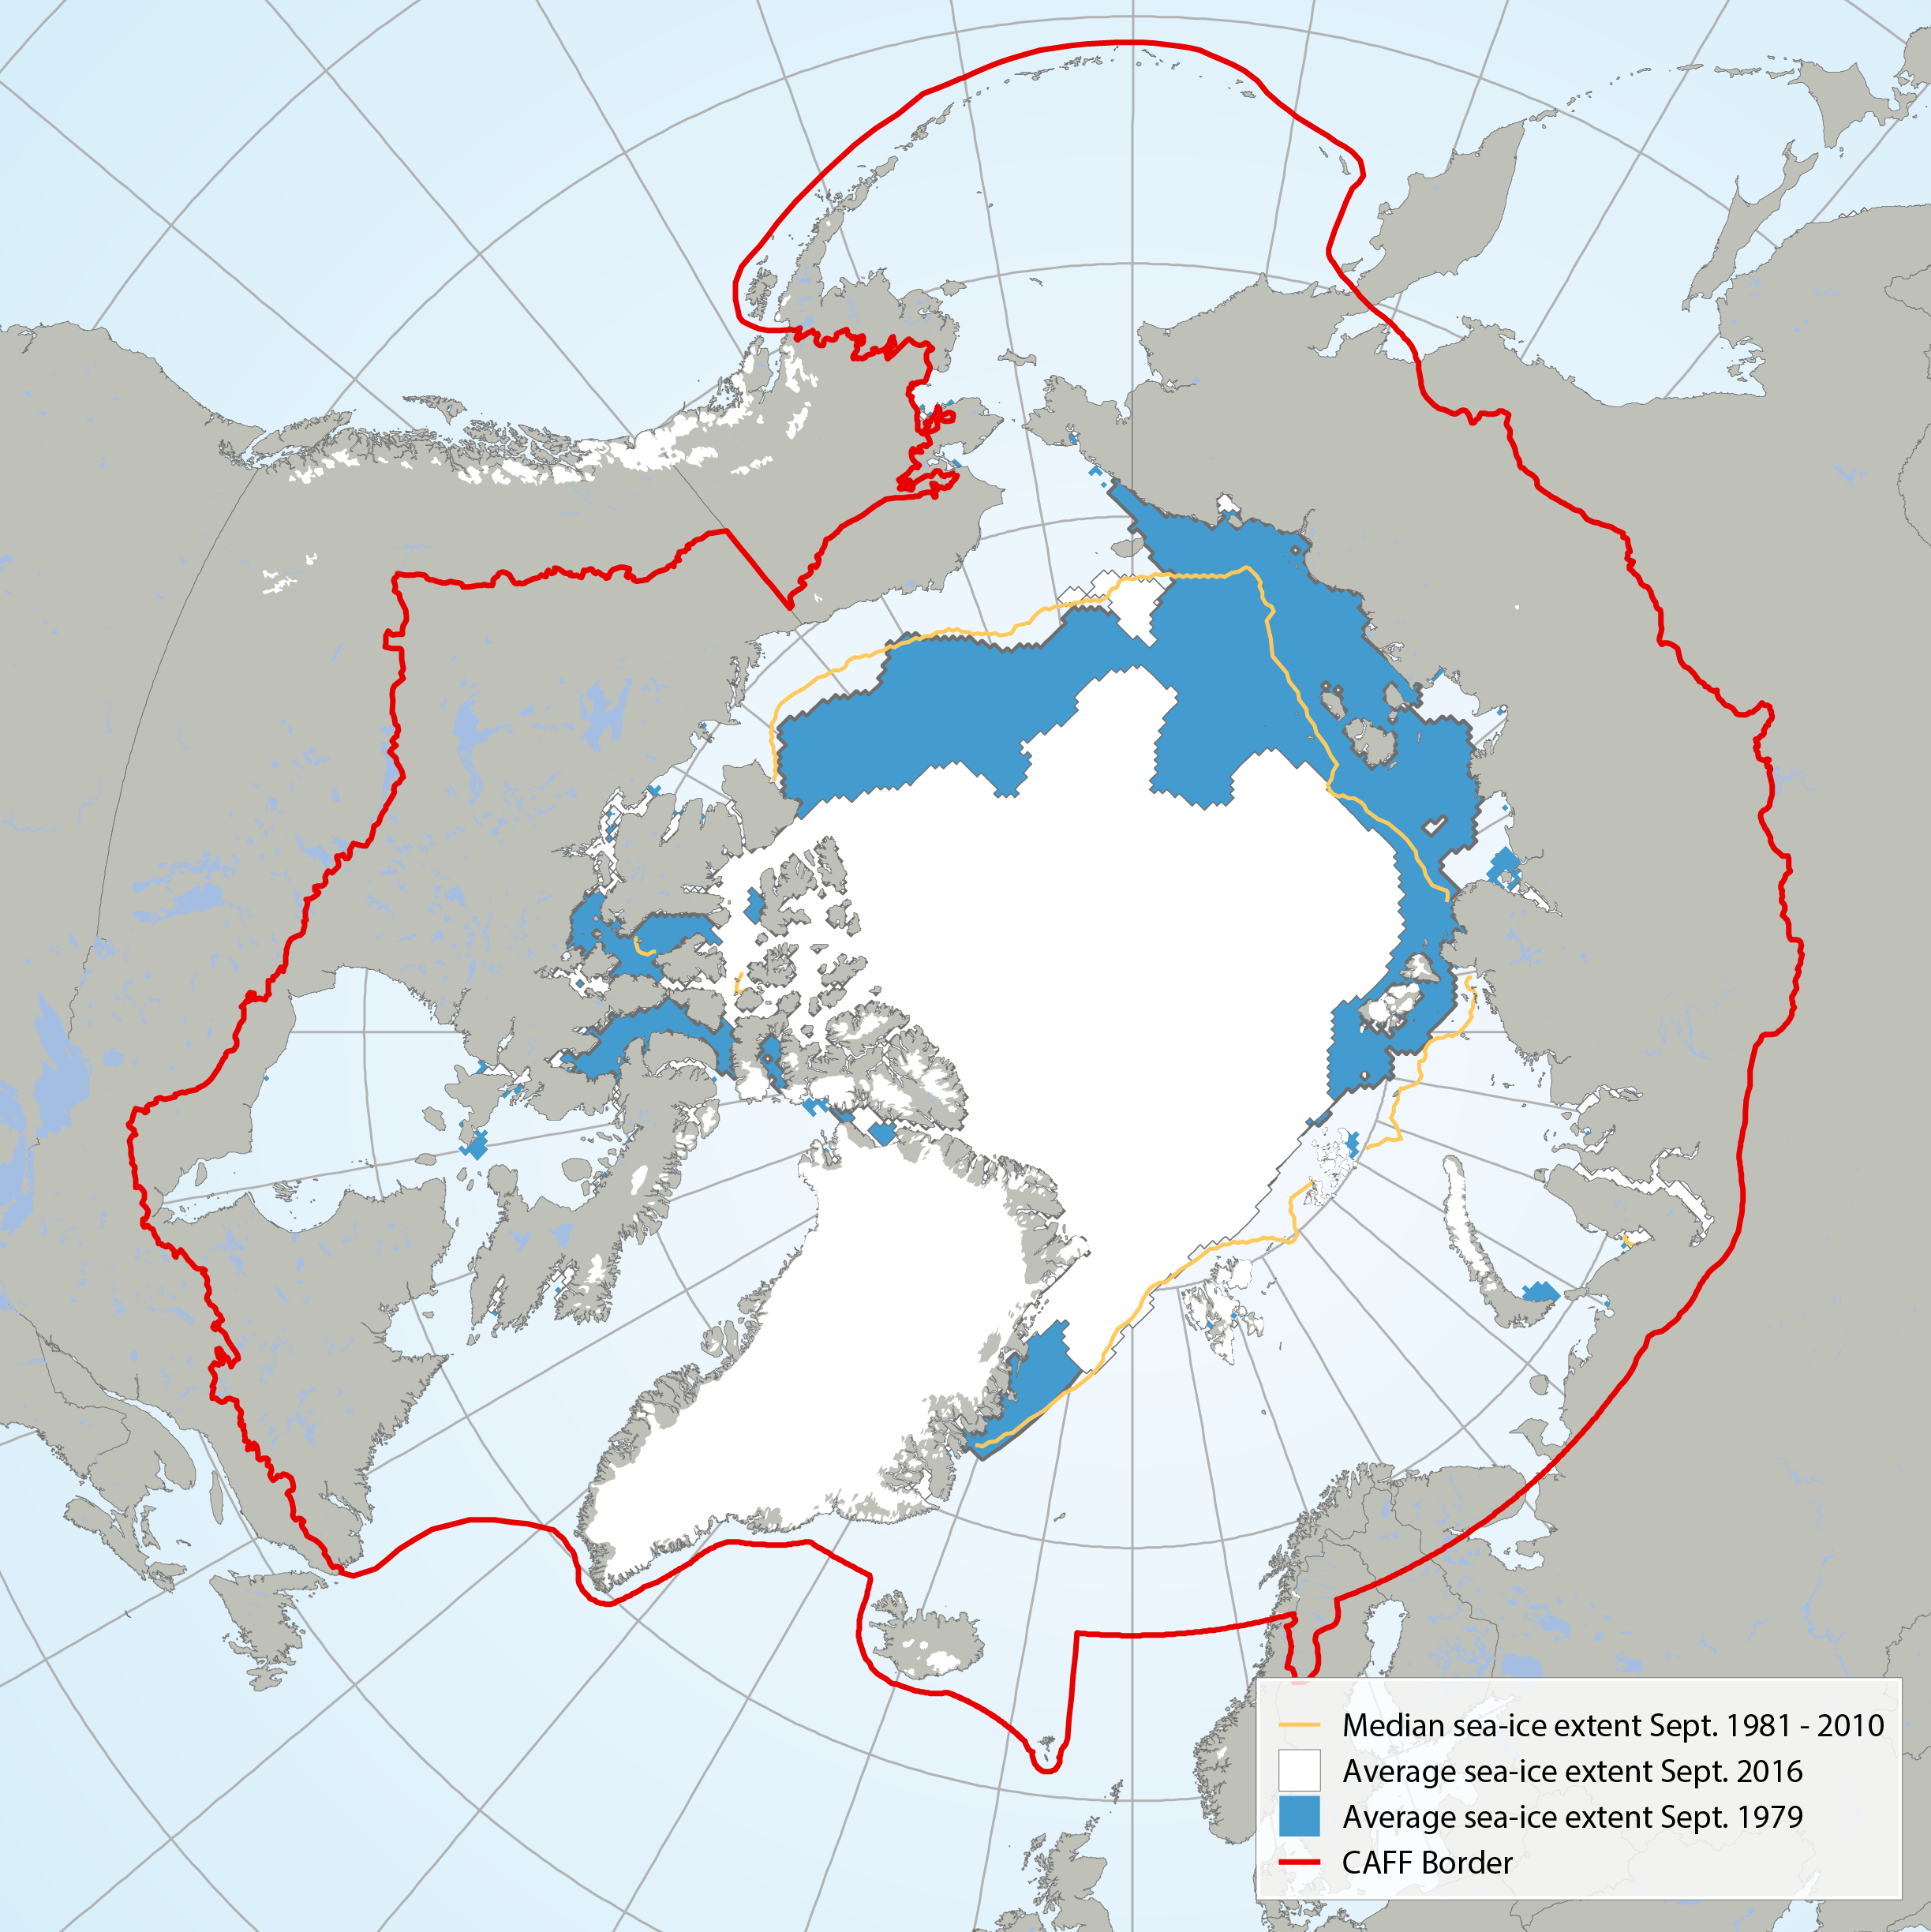
Average September sea ice extent in 1979 (blue) compared with 2016 (white) and the median sea ice extent (yellow line) from 1981 to 2010 (Data: NSDIC 2016). STATE OF THE ARCTIC MARINE BIODIVERSITY REPORT - <a href="https://arcticbiodiversity.is/marine" target="_blank">Chapter 2</a> - Page 27 - Figure 2.4
-

An accurate representation of the relief is essential for a large number of land management applications. Digital terrain models (DTM) and digital surface models (MNS) are simplified representations of ground altimetry. The MNT is a representation of the altitude of “bare ground” without infrastructure, while the MNS reproduces the shape of the Earth's surface by including all the permanent and visible elements of the landscape such as the ground and buildings. It is possible to add vegetation by including the [Numerical Canopy Model (MNC)] (/city-of-montreal/model-numerique-de-canopee-mnc).**This third party metadata element was translated using an automated translation tool (Amazon Translate).**
-
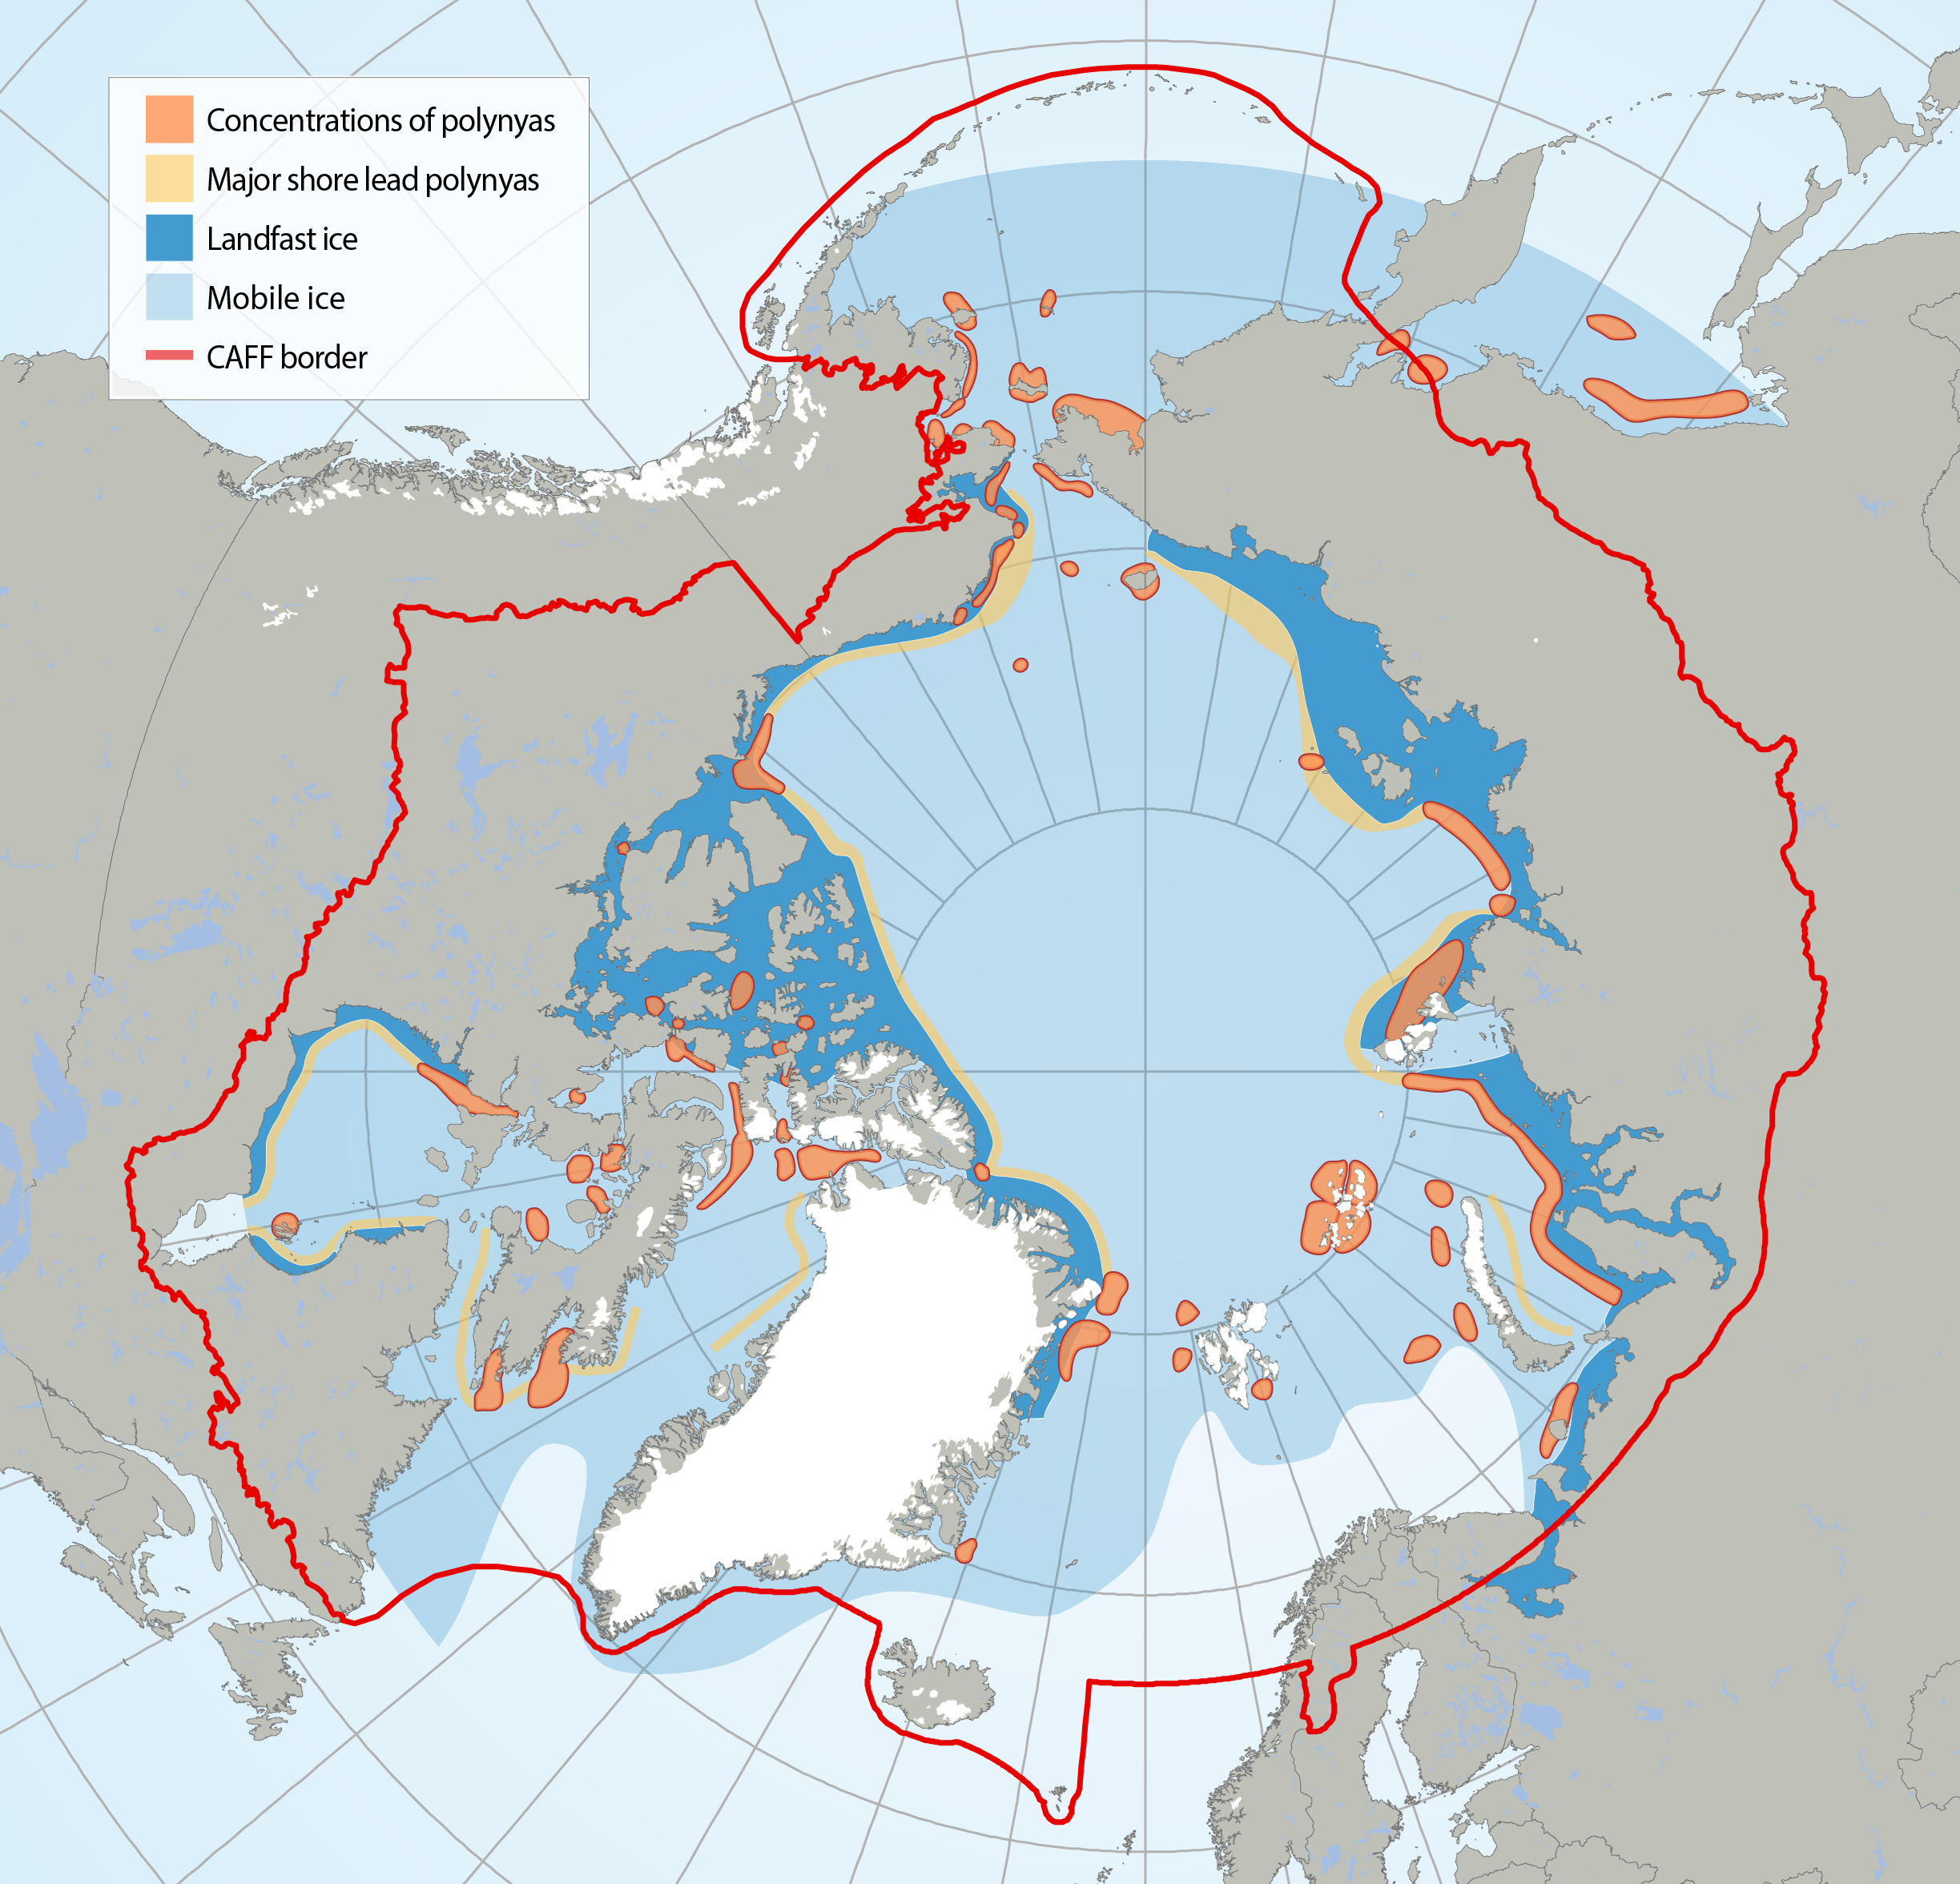
Circumpolar map of known polynyas. Note that polynyas are dynamic systems and some may no longer exist in the form known from their recent history. Adapted from Meltofte (2013) and based on Barber and Massom (2007). STATE OF THE ARCTIC MARINE BIODIVERSITY REPORT - <a href="https://arcticbiodiversity.is/marine" target="_blank">Chapter 2</a> - Page 28 - Figure 2.5
-
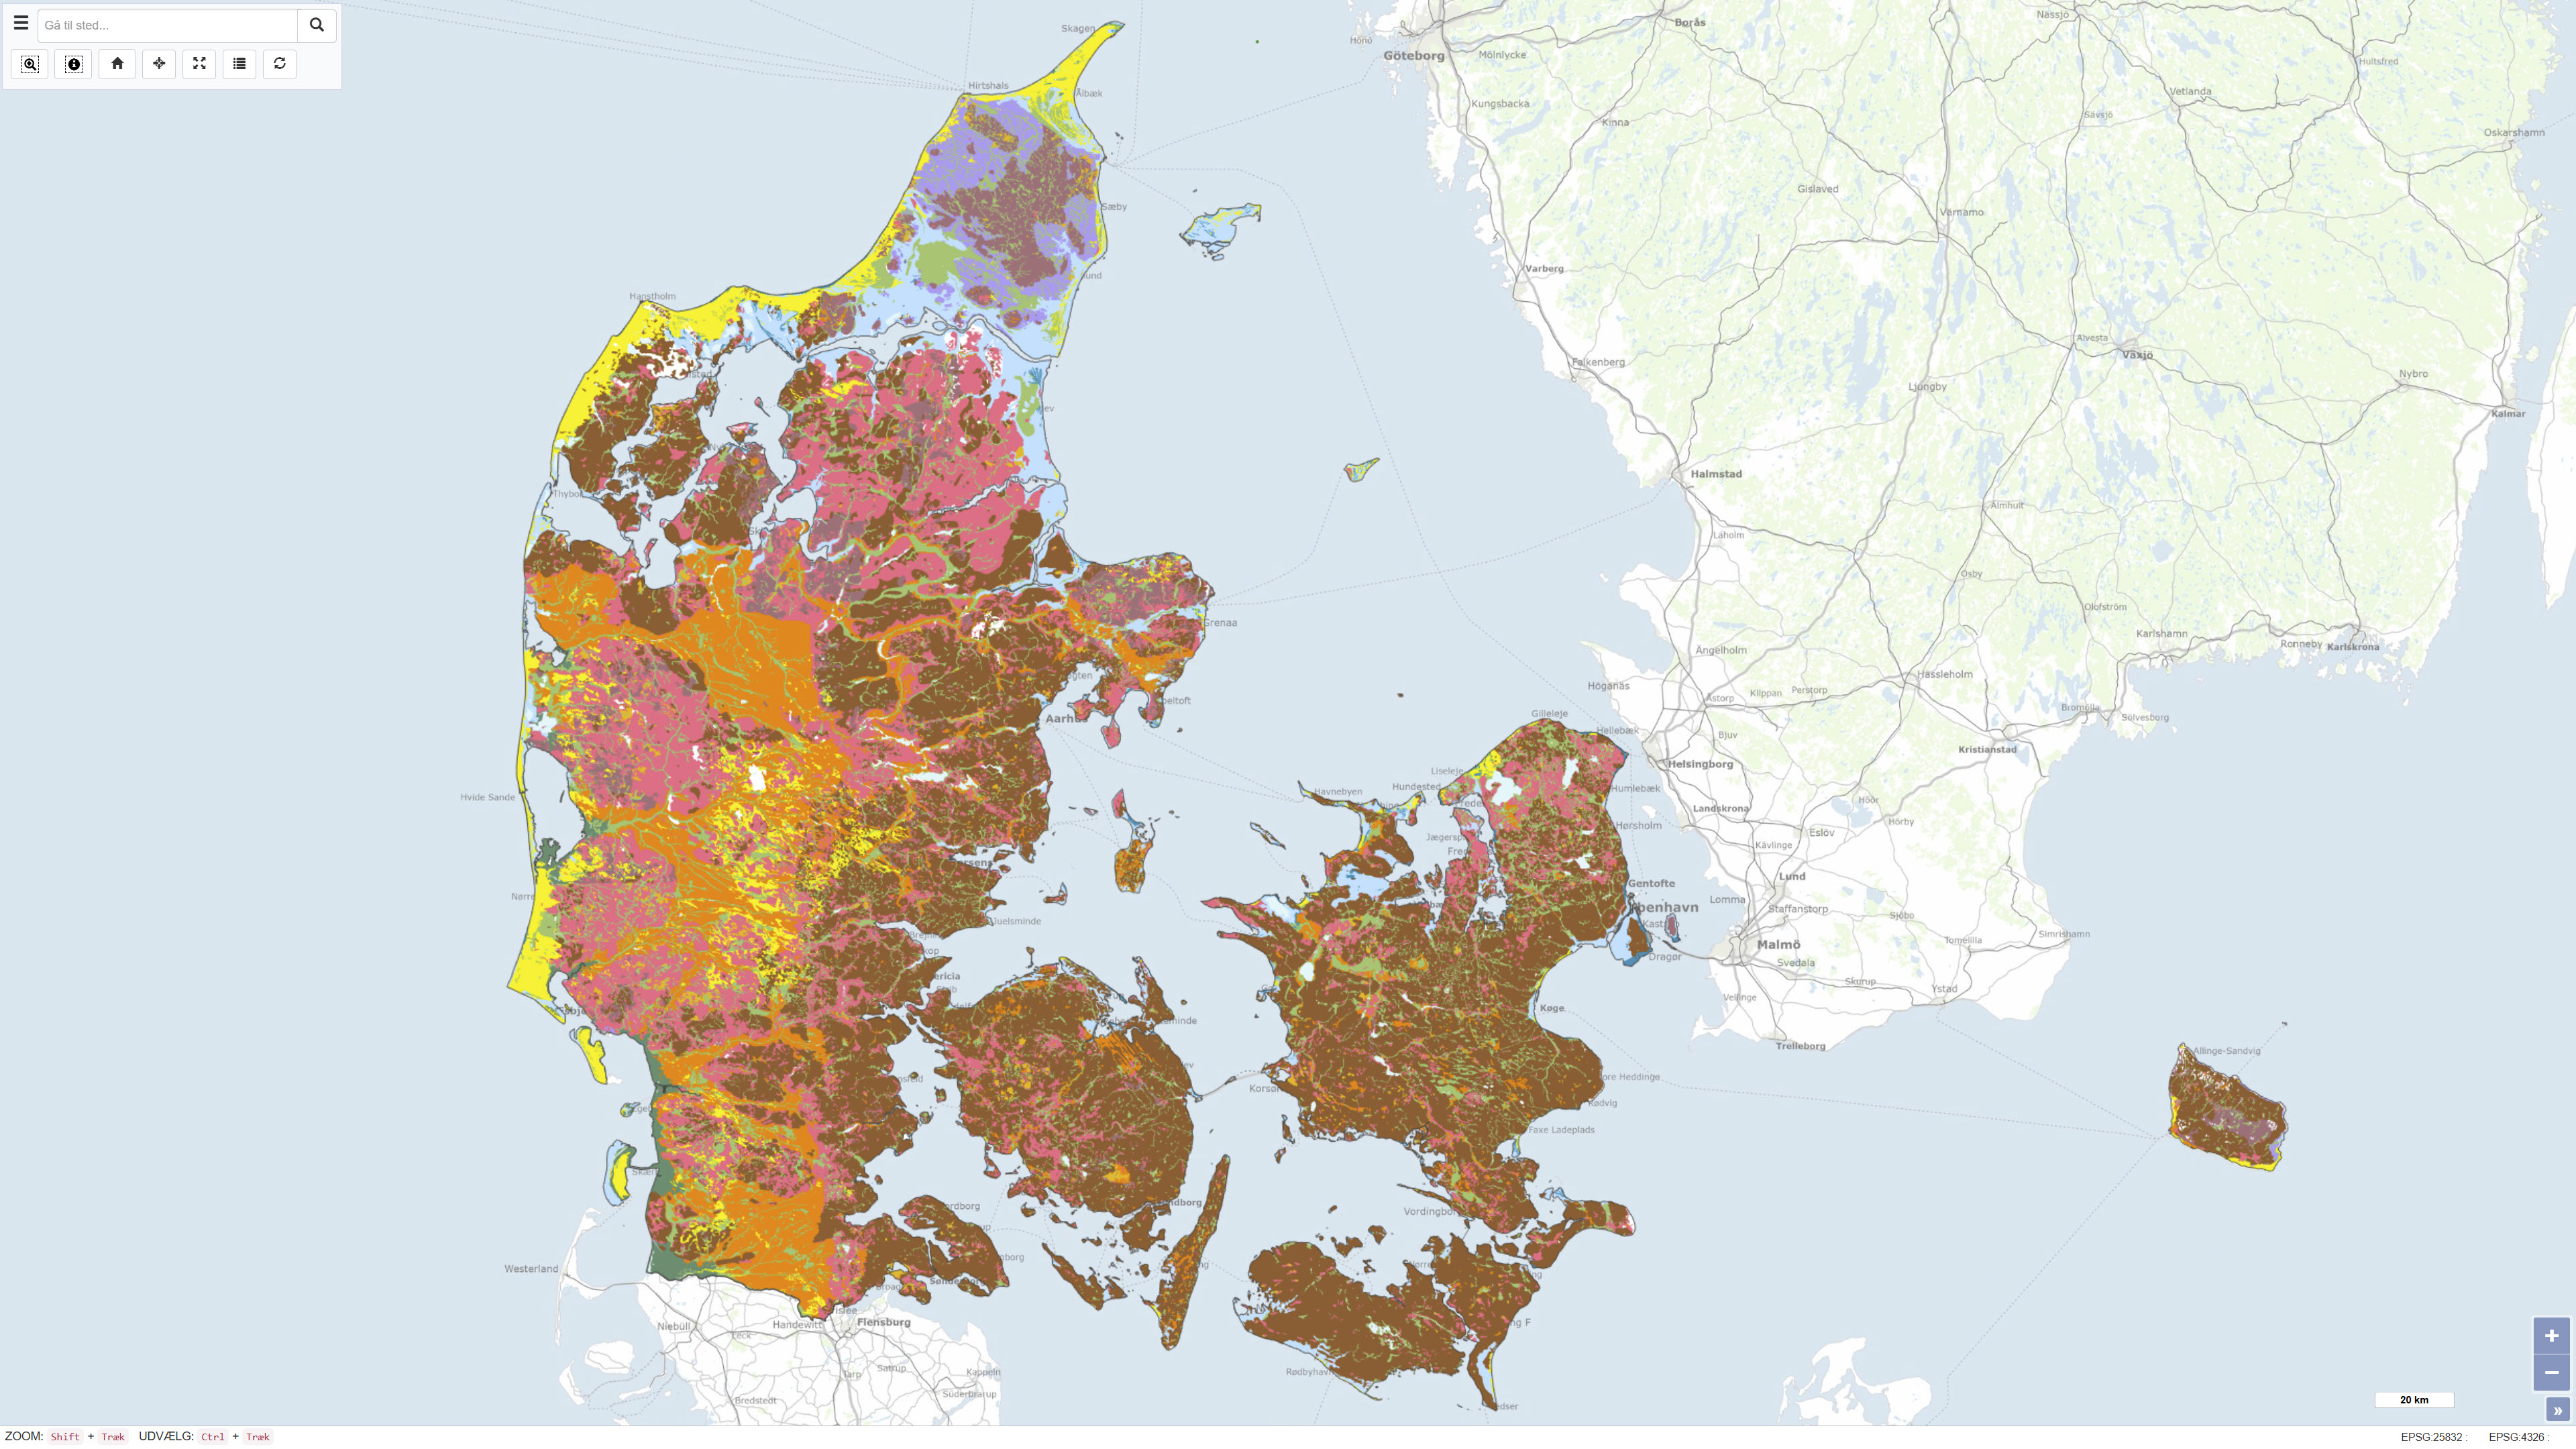
This dataset represents a nationwide digital geological map of superficial deposits in Denmark at a scale of 1:200.000. The map shows the classification and distribution of near-surface deposits, primarily glacial and post-glacial sediments. The dataset is based on the Digital Soil and Sediment Map of Denmark at 1:25.000 in areas where detailed mapping is available. In other areas, the distribution of deposits has been interpreted based on borehole data, landscape analysis and other available geological information. The deposits are classified into 12 generalised types, making the dataset a simplified and generalised version of the detailed 1:25.000 map. The dataset provides a national overview of superficial deposits and serves as a reference for regional and national applications.
-
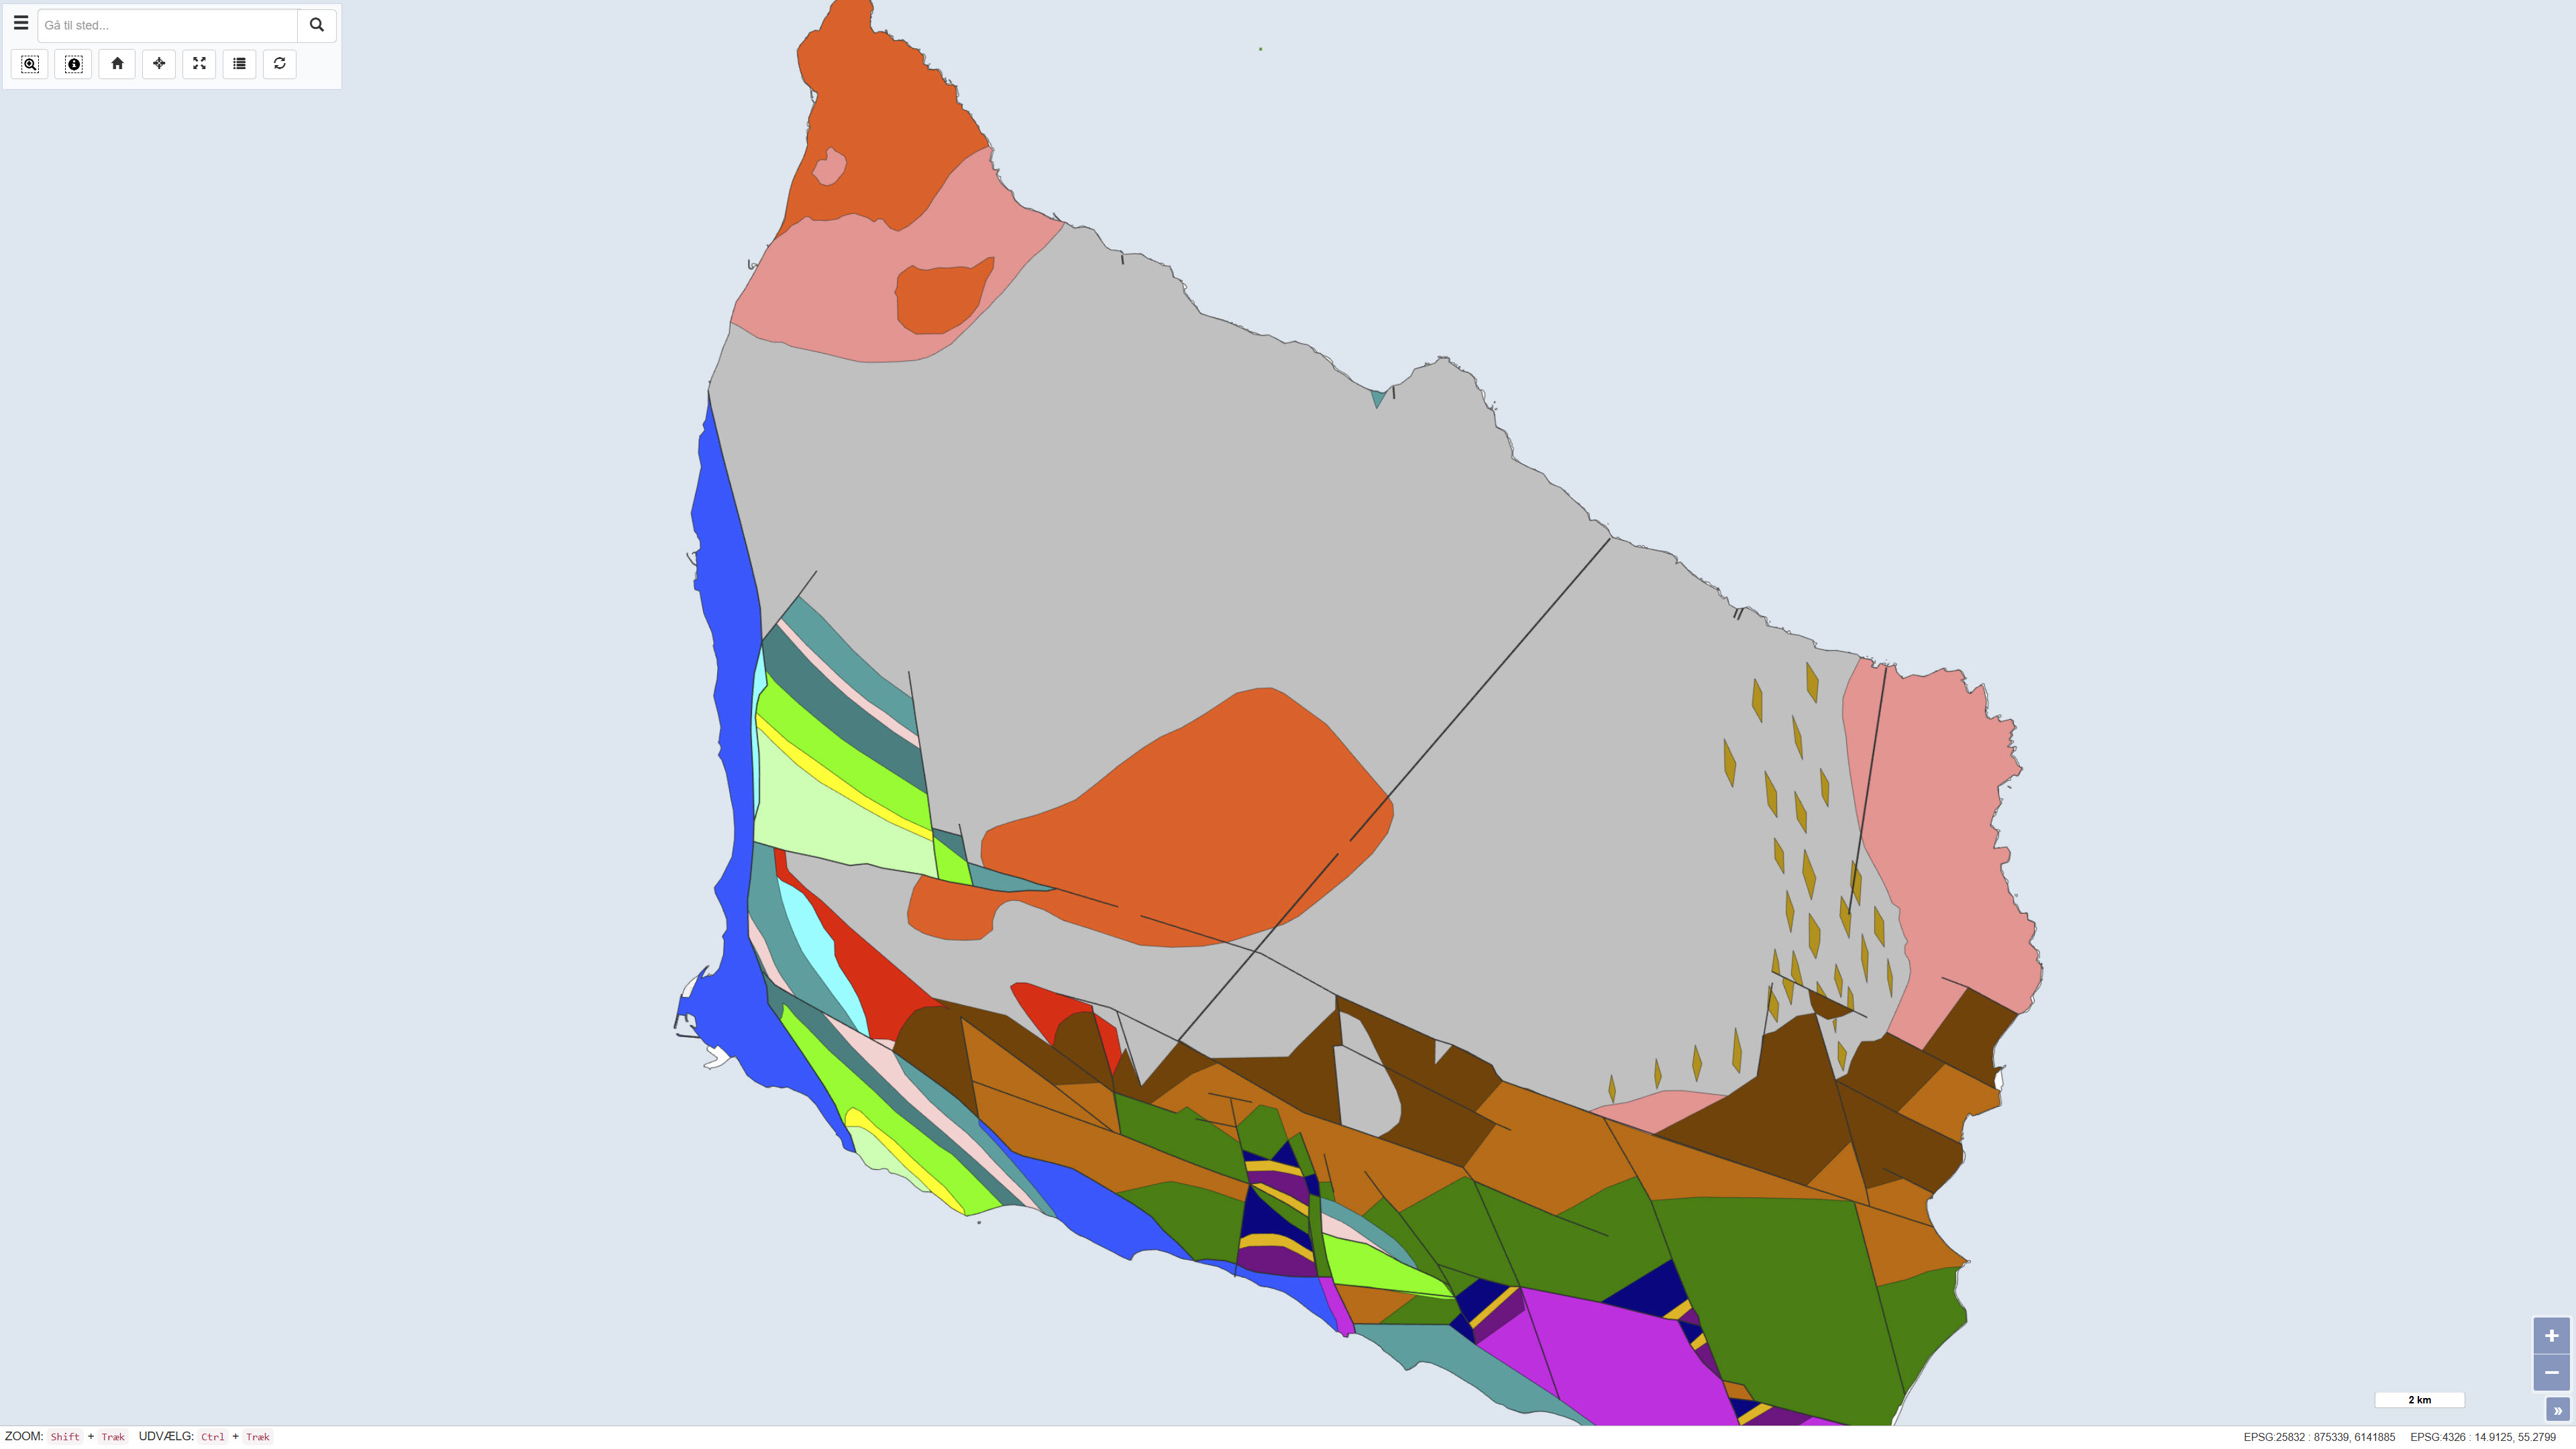
The dataset shows the pre-Quaternary surface of Bornholm and illustrates the distribution of pre-Quaternary rock units and geological structures beneath the Quaternary deposits. The map is based on geological interpretations carried out by Helge Gry in 1960 and 1969 and was published in the journal VARV in 1977. The pre-Quaternary geology of Bornholm differs significantly from the rest of Denmark and is characterised by complex fault systems and a combination of crystalline basement and sedimentary rocks. The map represents a historical, synthesised overview of the pre-Quaternary surface and remains an important reference in geological studies.
-
All the evaluation units of the graphic matrix of the City of Rouyn-Noranda. **This third party metadata element was translated using an automated translation tool (Amazon Translate).**
-
Geospatial vector data for the division of properties in the agglomeration of Montreal containing general information on property assessment units, including the codification of use (CUBF), approximate dimensions and registration number. IMPORTANT: This division has no legal value and should not be confused with cadastral division.**This third party metadata element was translated using an automated translation tool (Amazon Translate).**
-

High-resolution relief data produced from LiDAR surveys and limited to crop plots are particularly useful in the agricultural sector since they make it possible to model surface drainage in order to identify drainage problems or the risks of soil erosion. Agronomic interpretation will take advantage of this information not only in the form of the numerical terrain model and the shading, but also with the level curves, flow paths and basins located inside the cultivated plots, as delimited by the database of declared agricultural plots and productions (BDPPAD) of the Financière Agricole du Québec (FADQ). Level curves of 1 m covering the entire treated territory excluding cultivated plots (agricultural, forest, urban, etc.) are also available. These new data are the result of a collaboration between the MRNF and the MAPAQ, and they are offered thanks to the open valorization of data initially derived from LiDAR to the MRNF Forest Inventory Directorate (DIF). We hope that this data will support better soil and water management interventions, in order to mitigate the consequences of climate change, and to promote sustainable agriculture.**This third party metadata element was translated using an automated translation tool (Amazon Translate).**