 Arctic SDI catalogue
Océan
Type of resources
Available actions
Keywords
Contact for the resource
Provided by
Years
Formats
Representation types
Update frequencies
status
Service types
Scale
-

Monthly mean temperature from Bedford Institute of Oceanography North Atlantic Model (BNAM) results were averaged over 1990 to 2015 period to create monthly mean climatology for the Northwest Atlantic Ocean, which can be considered as a representation of the climatological state of the Northwest Atlantic Ocean. The BNAM model is eddy-resolving, NEMO-based ice-ocean coupled North Atlantic Ocean model developed at the Bedford Institute of Oceanography (BIO) to support DFO monitoring programs. The data available here is monthly climatology for eight selected depths (surface, 110 m, 156 m, 222 m, 318 m, 541 m, 1062 m, bottom) in 1/12 degree spatial resolution. The data for each month from 1990 until present for the entire model domain ( 8°–75°N latitude and 100°W–30°E longitude) and various depths is available upon request. The 1990-2017 model hindcast result is compared with observational data from surface drifter and satellite altimetry. The model demonstrates good skill in simulating surface currents, winter convection events in the Labrador Sea, and the Atlantic Meridional Overturning Circulation as observed at 26.5°N and 41°N. Model results have been used to interpret changes in the Labrador Current and observed warming events on the Scotian Shelf, and are reported through the annual AZMP Canadian Science Advisory Secretariat Process. When using data please cite following: Wang, Z., Lu, Y., Greenan, B., Brickman, D., and DeTracey, B., 2018. BNAM: An eddy resolving North Atlantic Ocean model to support ocean monitoring. Can. Tech. Rep. Hydrogr. Ocean. Sci. 327: vii + 18p
-

An annual trawl survey is conducted in Southwestern Nova Scotia and the Bay of Fundy to assess the lobster stocks in the area. The survey is conducted with the Northeast Fisheries Science Center Ecosystem Survey Trawl (NEST), a small mesh trawl with a cod end liner, which ensures the capture of various sizes of lobster. The dimensions and location of the trawl are monitored and recorded throughout the tow using an electronic trawl mensuration system. In addition, water temperature and depth are also monitored. The target tow length is 1 kilometer which is tracked using an Olex marine charting system. Vessel crew, DFO science staff and a contracted at sea observer work together to perform required tasks and collect all relevant data. Catch from each tow is separated by species, weighed and counted. Length frequency data is collected on select groundfish and crab species and detailed morphometric data is collected on each lobster. PARAMETERS COLLECTED: Set information and profile - includes set date, time depth and location Catch summary - weight and number caught of each species Length Freqeuncies - completed for up to 100 fish for selected species Lobster Morphological Data - detailed data collected on each lobster Bottom Temperature Trawl Metrics NOTES ON QUALITY CONTROL: Data is visually verified and double keypunched. On loading to Oracle, data is run through rigorous automated checks to verify data accuracy and integrity. SAMPLING METHODS: The target tow length is 1 kilometer which is tracked using an Olex marine charting system. Vessel crew, DFO science staff and a contracted at sea observer work together to perform required tasks and collect all relevant data. Catch from each tow is separated by species, weighed and counted. Length frequency data is collected on select groundfish and crab species, detailed morphometric data is collected on each lobster. Bottom temperature and trawl metrics are collected for each tow. CITATION LIST: Denton, Cheryl M.. 2020. Maritimes Region Inshore Lobster Trawl Survey Technical Description. Canadian technical reports of fisheries and aquatic sciences (DFO) 3376.
-

Likelihood of Presence of Bottlenose Whales in the Bay of Fundy and the Port Hawkesbury Area Response Plan. The Coastal Oceanography and Ecosystem Research section (DFO Science) reviewed reported opportunistic whale sightings and local knowledge sources to estimate areas where Northern Bottlenose Whales are seasonally present and delineate these areas. A version of this dataset was created for the National Environmental Emergency Center (NEEC) following their data model and is available for download in the Resources section. Cite this data as: Lazin, G., Hamer, A.,Corrigan, S., Bower, B., and Harvey, C. Data of: Likelihood of presence of Bottlenose Whale in Area Response Planning pilot areas. Published: June 2018. Coastal Ecosystems Science Division, Fisheries and Oceans Canada, St. Andrews, N.B. https://open.canada.ca/data/en/dataset/29dd835b-7c96-4c62-b558-275dfe13cbe9
-

Significant Benthic Areas are defined in DFO's Ecological Risk Assessment Framework (ERAF) as "significant areas of cold-water corals and sponge dominated communities", where significance is determined "through guidance provided by DFO-lead processes based on current knowledge of such species, communities and ecosystems". Here we provide maps of the location of significant concentrations of corals and sponges on the east coast of Canada produced through quantitative analyses of research vessel trawl survey data, supplemented with other data sources where available. We have conducted those analyses following a bio-regionalization approach in order to facilitate modelling of similar species, given that many of the multispecies surveys do not record coral and sponge catch at species level resolution. The taxa analyzed are sponges (Porifera), large and small gorgonian corals (Alcyonacea), and sea pens (Pennatulacea). We applied kernel density estimation (KDE) to create a modelled biomass surface for each of those taxa, and applied an aerial expansion method to identify significant concentrations, following an approach first applied in 2010 to this region. We compared our results to those obtained previously. KDE uses only geo-referenced biomass data to identify "hot spots". The borders of the areas so identified can be refined using knowledge of null catches and species distribution models that predict species presence-absence and/or biomass, both incorporating environmental data.
-
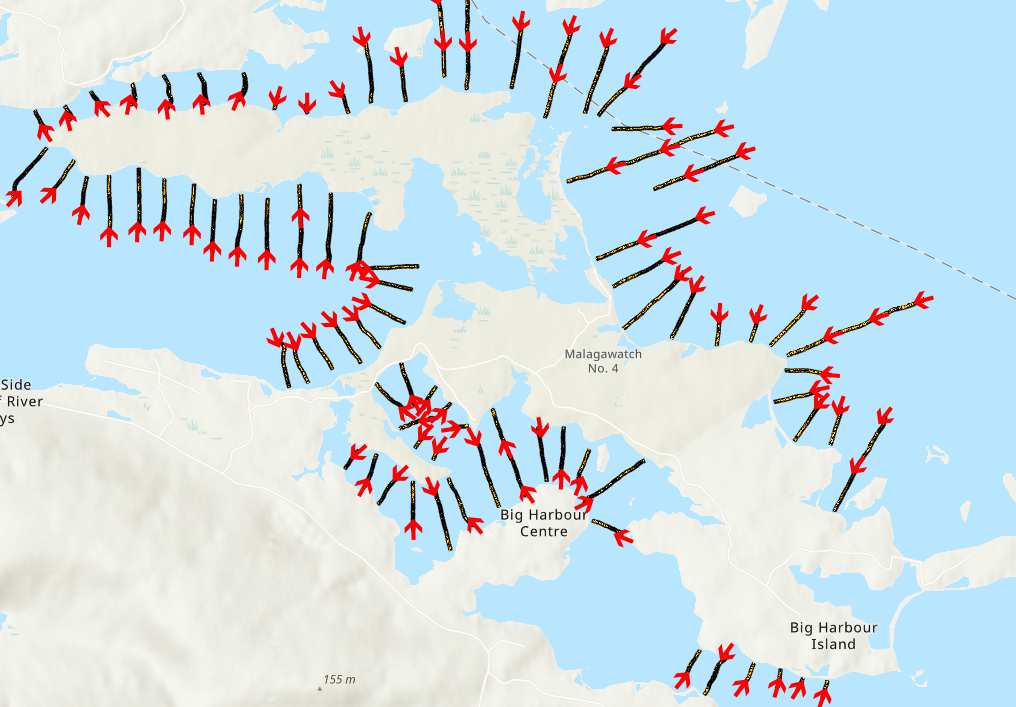
Bay Scale Assessment of Nearshore Habitat Bras dOr Lake - Malagawash 2007 2008 data is part of the publication Bay Scale Assessment of Nearshore Habitat Bras d'Or Lakes. A history of nearshore benthic surveys of Bras d’Or Lake from 2005 – 2011 is presented. Early work utilized drop camera and fixed mount sidescan. The next phase was one of towfish development, where camera and sidescan were placed on one platform with transponder-based positioning. From 2009 to 2011 the new towfish was used to ground truth an echosounder. The surveys were performed primarily in the northern half of the lake; from 10 m depth right into the shallows at less than 1 m. Different shorelines could be distinguished from others based upon the relative proportions of substrate types and macrophyte canopy. The vast majority of macrophytes occurred within the first 3 m of depth. This zone was dominated by a thin but consistent cover of eelgrass (Zostera marina L.) on almost all shores with a current or wave regime conducive to the growth of this plant. However, the eelgrass beds were frequently in poor shape and the negative impacts of commonly occurring water column turbidity, siltation, or possible localized eutrophication, are suspected. All survey data were placed into a Geographic Information System, and this document is a guide to that package. The Geographic Information System could be used to answer management questions such as the placement and character of habitat compensation projects, the selection of nearshore protected areas or as a baseline to determine long term changes. Vandermeulen, H. 2016. Video-sidescan and echosounder surveys of nearshore Bras d’Or Lake. Can. Tech. Rep. Fish. Aquat. Sci. 3183: viii + 39 p. Cite this data as: Vandermeulen H. Bay Scale Assessment of Nearshore Habitat Bras d'Or Lake - Malagawash 2007 - 2008. Published May 2022. Coastal Ecosystems Science Division, Fisheries and Oceans Canada, Dartmouth, N.S.
-

Monthly mean salinity from Bedford Institute of Oceanography North Atlantic Model (BNAM) results were averaged over 1990 to 2015 period to create monthly mean climatology for the Northwest Atlantic Ocean, which can be considered as a representation of the climatological state of the Northwest Atlantic Ocean. The BNAM model is eddy-resolving, NEMO-based ice-ocean coupled North Atlantic Ocean model developed at the Bedford Institute of Oceanography (BIO) to support DFO monitoring programs. The data available here is monthly climatology for eight selected depths (surface, 110 m, 156 m, 222 m, 318 m, 541 m, 1062 m, bottom) in 1/12 degree spatial resolution. The data for each month from 1990 until present for the entire model domain ( 8°–75°N latitude and 100°W–30°E longitude) and various depths is available upon request. The 1990-2017 model hindcast result is compared with observational data from surface drifter and satellite altimetry. The model demonstrates good skill in simulating surface currents, winter convection events in the Labrador Sea, and the Atlantic Meridional Overturning Circulation as observed at 26.5°N and 41°N. Model results have been used to interpret changes in the Labrador Current and observed warming events on the Scotian Shelf, and are reported through the annual AZMP Canadian Science Advisory Secretariat Process. When using data please cite following: Wang, Z., Lu, Y., Greenan, B., Brickman, D., and DeTracey, B., 2018. BNAM: An eddy resolving North Atlantic Ocean model to support ocean monitoring. Can. Tech. Rep. Hydrogr. Ocean. Sci. 327: vii + 18p
-

The Coastal Oceanography and Ecosystem Research section (DFO Science) reviewed the presence of Lobster in the Population Ecology Division (DFO Science) Ecosystem Survey trawls to describe the likelihood of presence. The survey consists of a stratified random design using a bottom trawl. Lobsters are found in few trawls in the Bay of Fundy and Port Hawkesbury Area Response Plan regions, however Lobsters are landed in nearshore areas. Therefore, lobsters are described as being likely present throughout the ARP. This layer was created for consideration in oil spill response planning. A version of this dataset was created for the National Environmental Emergency Center (NEEC) following their data model and is available for download in the Resources section. Cite this data as: Lazin, G., Hamer, A.,Corrigan, S., Bower, B., and Harvey, C. Data of: Likelihood of presence of American Lobster in Area Response Planning pilot areas. Published: June 2018. Coastal Ecosystems Science Division, Fisheries and Oceans Canada, St. Andrews, N.B. https://open.canada.ca/data/en/dataset/47bf4555-ce3c-492f-a367-a6eab1862970
-

Bay Scale Assessment of Habitat in Bras d'Or Lake - River Denys 2005 - 2009 data is part of the publication Bay Scale Assessment of Nearshore Habitat Bras d'Or Lakes. A history of nearshore benthic surveys of Bras d’Or Lake from 2005 – 2011 is presented. Early work utilized drop camera and fixed mount sidescan. The next phase was one of towfish development, where camera and sidescan were placed on one platform with transponder-based positioning. From 2009 to 2011 the new towfish was used to ground truth an echosounder. The surveys were performed primarily in the northern half of the lake; from 10 m depth right into the shallows at less than 1 m. Different shorelines could be distinguished from others based upon the relative proportions of substrate types and macrophyte canopy. The vast majority of macrophytes occurred within the first 3 m of depth. This zone was dominated by a thin but consistent cover of eelgrass (Zostera marina L.) on almost all shores with a current or wave regime conducive to the growth of this plant. However, the eelgrass beds were frequently in poor shape and the negative impacts of commonly occurring water column turbidity, siltation, or possible localized eutrophication, are suspected. All survey data were placed into a Geographic Information System, and this document is a guide to that package. The Geographic Information System could be used to answer management questions such as the placement and character of habitat compensation projects, the selection of nearshore protected areas or as a baseline to determine long term changes. Vandermeulen, H. 2016. Video-sidescan and echosounder surveys of nearshore Bras d’Or Lake. Can. Tech. Rep. Fish. Aquat. Sci. 3183: viii + 39 p. Cite this data as: Vandermeulen H. Bay Scale Assessment of Nearshore Habitat Bras d'Or Lake - River Denys 2005 - 2009. Published May 2022. Coastal Ecosystems Science Division, Fisheries and Oceans Canada, Dartmouth, N.S.
-

A history of nearshore benthic surveys of Bras d’Or Lake from 2005 – 2011 is presented. Early work utilized drop camera and fixed mount sidescan. The next phase was one of towfish development, where camera and sidescan were placed on one platform with transponder-based positioning. From 2009 to 2011 the new towfish was used to ground truth an echosounder. The surveys were performed primarily in the northern half of the lake; from 10 m depth right into the shallows at less than 1 m. Different shorelines could be distinguished from others based upon the relative proportions of substrate types and macrophyte canopy. The vast majority of macrophytes occurred within the first 3 m of depth. This zone was dominated by a thin but consistent cover of eelgrass (Zostera marina L.) on almost all shores with a current or wave regime conducive to the growth of this plant. However, the eelgrass beds were frequently in poor shape and the negative impacts of commonly occurring water column turbidity, siltation, or possible localized eutrophication, are suspected. All survey data were placed into a Geographic Information System, and this document is a guide to that package. The Geographic Information System could be used to answer management questions such as the placement and character of habitat compensation projects, the selection of nearshore protected areas or as a baseline to determine long term changes. Vandermeulen, H. 2016. Video-sidescan and echosounder surveys of nearshore Bras d’Or Lake. Can. Tech. Rep. Fish. Aquat. Sci. 3183: viii + 39 p. Cite this data as: Vandermeulen H. Bay Scale Assessment of Nearshore Habitat Bras d'Or Lake. Published May 2022. Coastal Ecosystems Science Division, Fisheries and Oceans Canada, Dartmouth, N.S.
-

Species Distribution Models (SDM) were used to predict and identify priority areas for enhanced monitoring of cetaceans in eastern Canadian waters off Nova Scotia, Newfoundland and Labrador. This data set represents information presented in Gomez et al. (2020) and includes sighting records and SDM outputs for ten cetacean species with sufficient records (n > 450) and sightings only for an additional six species. For more information about sighting records including which were included in each SDM, please see Gomez et al. 2020. This study used a compilation of aerial- and vessel-based cetacean sightings data from 1975-2015 assembled in Gomez et al. (2017) from variety of sources. Note that sightings data from many of these sources are not effort-corrected and apparent distribution patterns based on these opportunistic sightings data are biased by when and where survey activities were conducted. Unfavorable weather and reduced visual effort in winter, spring, and autumn likely account for the fewer sighting records in these seasons compared to summer. The dataset does not include dead animal, stranding, entanglement or entrapment data. While some of the databases include records obtained during the whaling period (catches or sightings recorded prior to 1975), for all analyses/modelling conducted in this study, only sightings of free-swimming whales obtained during the post-whaling period (1975-2015) were used. Quality control checks included discarding all records outside of our study area and removing redundant records (identical species, day, month, latitude and longitude).The data used do not reflect any updates or corrections to the databases that have occurred since the data were compiled in 2016. Sightings are not available for download here, please contact the original data sources listed below to obtain raw sightings data. This study represents an important initiative in eastern Canada to highlight key areas for cetacean monitoring in waters off Nova Scotia, Newfoundland and Labrador. Habitats with high suitability are interpreted as areas where cetacean monitoring efforts may be prioritized, and results can help direct future survey efforts. These model outputs used cetacean sightings from several decades and dynamic environmental predictors that used seasonal averages across multiple years. As proxies for prey availability, five predictor environmental variables were selected for the SDM: ocean depth, compound topographic index, sea surface temperature, areas of persistently high chlorophyll-a concentration, and regional chlorophyll-a magnitude. See Gomez et al. (2020) for further details on modelling methods. Persistent patterns over time (between 1975-2015) are the main patterns expected to be captured by these models. Further, SDM results presented here are not the same as species density maps; rather, they portray predicted suitable habitat based on environmental characteristics and sightings data that were not always derived from effort-based surveys. Consequently, the use of these models in marine spatial planning processes should be accompanied by complimentary approaches such as acoustic and visual validation of the SDM results as well as additional monitoring and modeling efforts. Please refer to Gomez et al. (2020) for examples on how to best use these data outputs. Future efforts will focus on using more recent data and improving these models to facilitate the inclusion of cetaceans in marine spatial planning processes that are currently underway. Data sources: Fisheries and Oceans Canada Maritimes region and Newfoundland and Labrador region (Whale Sightings Database, Ocean and Ecosystem Sciences Division, Dartmouth, NS; http://www.inter.dfo-mpo.gc.ca/Maritimes/SABS/popec/sara/Database, MacDonald et. al. 2017) Ocean Biogeographic Information System (OBIS; http://www.iobis.org/), North Atlantic Right Whale Consortium (NARWC; http://www.narwc.org/) Whitehead Lab at Dalhousie University (http://whitelab.biology.dal.ca/) Environment and Climate Change Canada’s (Canadian Wildlife Service) Eastern Canada Seabirds at Sea (ECSAS) program (Gjerdrum et al. 2012). References: Gomez, C., Konrad, C.M., Vanderlaan, A., Moors-Murphy, H.B., Marotte, E., Lawson, J., Kouwenberg, A-L., Fuentes-Yaco, C., Buren, A. 2020. Identifying priority areas to enhance monitoring of cetaceans in the Northwest Atlantic Ocean. Can. Tech. Rep. Fish. Aquat. Sci. 3370: vi + 103 p. http://waves-vagues.dfo-mpo.gc.ca/Library/40869155.pdf Gomez C, Lawson J, Kouwenberg A, Moors-Murphy H, Buren A, Fuentes-Yaco C, Marotte E, Wiersma YF, Wimmer T. 2017. Predicted distribution of whales at risk: identifying priority areas to enhance cetacean monitoring in the Northwest Atlantic Ocean. Endangered Species Research 32:437-458 https://www.int-res.com/abstracts/esr/v32/p437-458/ Gjerdrum, C., D.A. Fifield, and S.I. Wilhelm. 2012. Eastern Canada Seabirds at Sea (ECSAS) standardized protocol for pelagic seabird surveys from moving and stationary platforms. 31 Canadian Wildlife Service Technical Report Series No. 515. Atlantic Region. vi + 37 p. MacDonald, D., Emery, P., Themelis, D., Smedbol, R.K., Harris, L.E., and McCurdy, Q. 2017. Marine mammal and pelagic animal sightings (Whalesightings) database: a user’s guide. Can. Tech. Rep. Fish. Aquat. Sci. 3244: v + 44 p.