 Arctic SDI catalogue
Ruisseau
Type of resources
Available actions
Topics
Keywords
Contact for the resource
Provided by
Formats
Representation types
Update frequencies
status
-

RUISSO program sampling points, stream water quality, Aquatic environment monitoring network.**This third party metadata element was translated using an automated translation tool (Amazon Translate).**
-
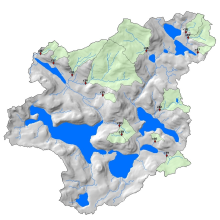
Data from the RUISSO program, bacteriological and physicochemical quality of streams and inland water bodies in the Montreal agglomeration, from the Aquatic Environment Monitoring Network. An [interactive map] (https://experience.arcgis.com/experience/38d7c7bb43da4e2082aa836689d0d318/) is also available.**This third party metadata element was translated using an automated translation tool (Amazon Translate).**
-
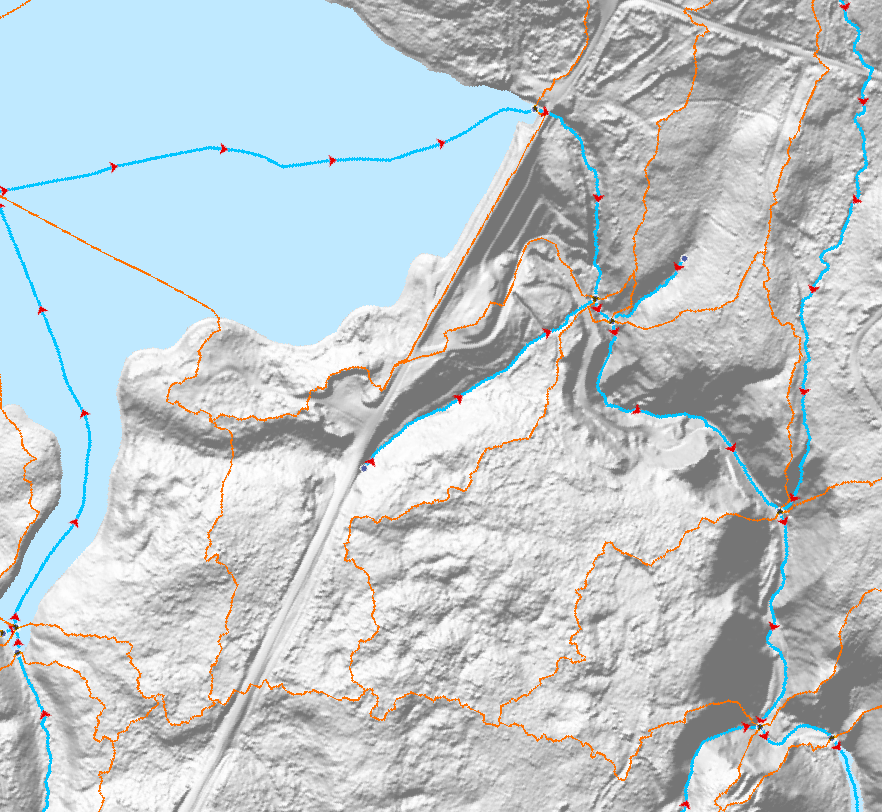
Watercourses on the territory of the city of Lévis identified in the Regulation respecting land use planning and development plans (RV-2015-15-04) **This third party metadata element was translated using an automated translation tool (Amazon Translate).**
-
Linear hydrographic network of the City of Rouyn-Noranda. The ditches of drainage is not included. **This third party metadata element was translated using an automated translation tool (Amazon Translate).**
-
History of annual reviews of the quality of water bodies in Montreal. The aquatic environment monitoring network (RSMA) takes surface water samples in order to draw up a state of the situation in the Montreal agglomeration.**This third party metadata element was translated using an automated translation tool (Amazon Translate).**
-

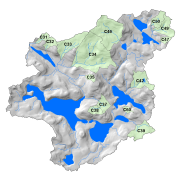
The Turkey Lakes Watershed (TLW) Study was established in 1979 by several federal government departments (Natural Resources Canada, Environment and Climate Change Canada, and Fisheries and Oceans Canada) to study the impacts of acid rain on aquatic and forest ecosystems but has since expanded to include other research on toxic contaminants, forest harvesting, habitat modification, and climate change. The TLW is a mixed hardwood forest with a 10.5 km squared area in the Canada Shield that drains into Lake Superior, and has been the focus of many interdisciplinary, whole-ecosystem studies on environmental issues. Benthic invertebrates, or insects found at the bottom of waterbodies, can be key indicators of stream health and play important roles in nutrient cycling and the food chain. In 1995, a project within the TLW aimed to evaluate how stream ecosystems respond to tree harvesting, which involved long-term surveys of benthic invertebrate communities pre- and post-harvest. Three stream catchments (c31, c33, c34) were harvested at different intensities in the summer of 1997 and were compared to multiple undisturbed catchments. Alongside the invertebrate data, corresponding stream habitat surveys, streamside litterfall traps, leaf decomposition, deposition of stream particulate matter, and standing sediment bedload data was collected during the same period. The data was collected from 1995-2009 by researchers at the Canadian Forest Service (Great Lakes Forestry Centre). This dataset is a rare and valuable resource because there are very few existing long-term datasets of benthic invertebrates from the same locations, and because this dataset is integrated with other biological and chemical datasets within the broader TLW database stored at the Open Government data repository. For an overview of other types of data available from the TLW, see https://doi.org/10.1002/hyp.14109, and for a complete list of publications that have been produced from data collected at this site, see https://www.canada.ca/en/environment-climate-change/services/turkey-lakes-watershed-study/publications.html.
-
The Canadian Hydrospatial Network (CHN) is an analysis-ready geospatial network of features that help enable the modelling of surface water flow in Canada. The six main layers and feature types are: flowlines, waterbodies, catchments, catchment aggregates, work units, and hydro nodes. Where possible the CHN is derived from high resolution source data such as Light Detection and Ranging (LiDAR) derived Digital Elevation Models (DEMs) and aerial imagery, to name a few. If existing provincial or territorial hydrographic networks meet the standards, they are incorporated into the CHN, otherwise automatic extraction methods are used on the high-resolution source data. To provide full network connectivity, if neither of these methods is possible in a region, the NHN is converted into the CHN until higher-resolution source data is available. Additional value-added attributes are included in the CHN to aid modelling, such as stream order and reach slope. The CHN physical model and features are also closely aligned and harmonized with the USGS 3DHP hydrographic network, which aids trans-border modelling. Where possible geonames (i.e. toponyms) are also added. The CHN is produced and disseminated by hydrologically connected geographic areas called work units. Work units can contain just one watershed, several small adjacent watersheds outletting into a large body of water, or be one of many parts of a larger watershed. In all cases, the features of a work unit are hydrologically connected. This is a more natural approach to data delivery, in comparison to data that is split into tiles. A generalized work unit index file is provided in the downloads to help users decide which files to download. For more information on the CHN please visit the project webpage: https://natural-resources.canada.ca/canadian-hydrospatial-network
-
This dataset contains average concentrations of water chemistry collected from stream catchments C31, C32, C33, C34, C35, C37, C38, C39, C42, C46, C47, C49, and C50 in the Turkey Lakes Watershed, approximately 60 km northwest of Sault Ste. Marie, Ontario, Canada. These are average concentrations recorded from 1981-2018 in milligrams per litre (mg/L) of major ions (Ca, Mg, K, Na, SO4, Cl, NO3-N, NH4-N) and some nutrients (TP, TN) collected by the Great Lakes Forestry Centre. Samples are collected according to variable schedules such that frequency generally increased with increasing stream flow, (sampling period was shortest during spring runoff, 1-3 days, and longest during winter, 2-3 weeks). Sampling was accomplished by rinsing an appropriately cleaned 2-litre, polyethylene bottle at least 3 times with stream water followed by immersion to collect the final sample. Care was taken to not disturb the stream sediments throughout the sampling procedure. pH and conductivity testing is completed right after sampling. Other chemical analyses are completed by the Great Lakes Forestry Centre in Sault Ste. Marie within 2 weeks of collection. Sample integrity was maintained through storage in the dark at 4 degrees Celsius and analyzed at room temperature.
-
This dataset contains annual mean stream water flow/discharge data derived from daily means for headwater streams draining forested hillslopes measured at stream catchments C31, C32, C33, C34, C35, C37, C38, C39, C42, C46, C47, C49, and C50 in the Turkey Lakes Watershed, approximately 60 km northwest of Sault Ste. Marie, Ontario, Canada. This data set is recorded as annual mean flow by calendar year (January-December in litres per second), annual mean flow by water year (October to September in litres per second), and annual number of zero flow days by water year. Daily mean flows that were used to derive this data set were recorded from 1981-2012 by the Great Lakes Forestry Centre, and are reported for 1981-2011 due to some inaccuracies throughout the 2012 data. Hydrological gauging stations employ "flow-control" 120 degree V-notch weirs (catchments 31, 33, 34, 37, 39, 42, 46, and 47), 90 degree V-notch weirs (catchments 32, 35, and 49), and 60 degrees V-notch weirs (catchment 38) to facilitate monitoring of stream discharge. Water "stage" or depth within the structure (e.g. in the pool behind the weir notch) is automatically and continuously recorded by chart recorders (Leupold & Stevens A-71 SE Water Level Recorder) from 1981-2003. Capacitance rods (Trutrack WT-HR 1000) installed in stilling wells replaced the chart recorders over the period of 2002 to 2003 and were used until 2012. The capacitance rods logged data at 1 hour intervals for the majority of their use and then averaged to a daily rate. Manual stage measurements have been taken intermittently when synoptic water chemistry samples were taken throughout the years. Stage data are then converted to a continuous record of flow using the relationship between stage and discharge measurements.
-
The Turkey Lakes Watershed Study (TLWS) was established in 1979 and is one of the longest running ecosystem studies in Canada. It is 10.5 km2 and is located approximately 60 km north of Sault Ste. Marie, Ontario at the northern margin of the Great Lakes – St. Lawrence forest region. Researchers from Natural Resources Canada, Environment Canada and Fisheries and Oceans Canada established the research watershed to evaluate the impacts of acid rain on terrestrial and aquatic ecosystems. Since its inception, the study has taken a multi-disciplinary approach to investigating the processes that govern ecosystem responses to natural and anthropogenic perturbations. The goal of the TLWS is to obtain a whole-ecosystem analysis of the biogeochemical processes operating at the site. This permits system models to be developed and validated. The holistic approach that has been adopted from the outset allows research to evolve and expand from its original acidification focus to include evaluations of other environmental issues. Partnerships and collaboration are part of the founding principles behind the TLWS to improve our ability to measure, model and predict effects of human activity on ecosystem function. Over time, research and monitoring have expanded to explore the effects of forest harvesting, climate change, aquatic habitat manipulations and toxic contaminants. Advancements of our scientific knowledge of forest ecosystems and a baseline of long-term environmental data enables study results to inform Canadian governments on environmental policy and forest management legislation. Hydrological, meteorological, and vegetation data collected by scientists at the Great Lakes Forestry Centre is included in this directory. Experimental sites and scientific investigations in the TLW are summarized in the compendium document. Visit our website at: