Lac
Type of resources
Available actions
Topics
Keywords
Contact for the resource
Provided by
Formats
Representation types
Update frequencies
status
Scale
-

Mapping of the centers of watercourses and surface watercourses on the territory of Quebec City.**This third party metadata element was translated using an automated translation tool (Amazon Translate).**
-

Surface hydrographic network of the City of Rouyn-Noranda **This third party metadata element was translated using an automated translation tool (Amazon Translate).**
-

The flows and effluent quality data is for the parameters of: * Biological Oxygen Demand BOD5/CBOD5 * Total Suspended Solids (TSS), also described as Residual Particulate Solids * Total Phosphorus (TP) * total monthly flow Keywords: Sewage, Effluent, Discharge, Watershed, Waterworks, Water management, Muncipality
-

COURDO program sampling points, stream quality, Aquatic environment monitoring network.**This third party metadata element was translated using an automated translation tool (Amazon Translate).**
-

COURDO SPÉCIAL program sampling points, watercourse quality, Aquatic environment monitoring network.**This third party metadata element was translated using an automated translation tool (Amazon Translate).**
-

This theme offers detailed information on lakes and waterways throughout Quebec. All the descriptors available in this layer come directly from the Lakes and Rivers (LCE) database. The data includes lake centroids and stream junctions and includes information on lake morphology such as length, width, depth, volume, and elevation, as well as the area of watersheds. This data is intended for researchers, engineers, government agencies, government agencies, environmental professionals, as well as students and industries, for applications in the environment, hydrology, and hydraulics. **This third party metadata element was translated using an automated translation tool (Amazon Translate).**
-

History of annual reviews of the quality of water bodies in Montreal. The aquatic environment monitoring network (RSMA) takes surface water samples in order to draw up a state of the situation in the Montreal agglomeration.**This third party metadata element was translated using an automated translation tool (Amazon Translate).**
-

This dataset supports the assessment of plankton community structure and water quality within Toronto Area of Concern (AOC). The data was collected to evaluate the Beneficial Use Impairment (BUI) 13 - Degradation of Phytoplankton and Zooplankton Populations, and to provide georeferenced habitat information relevant to BUI 14 - Loss of Fish and Wildlife Habitat. The dataset provides a complete suite of water quality, microbial, phytoplankton and zooplankton observations collected from multiple georeferenced stations throughout the Toronto Harbor. Each datapoint includes latitude and longitude, sampling date, year and season, along with physiochemical measurements such as temperature, dissolved oxygen, total phosphorus, total nitrogen, nitrate + nitrite, chlorophyll-a and turbidity. Biological data includes phytoplankton, zooplankton and rotifer abundance and biomass across major taxonomic groups, as well as size structured zooplankton data distinguishing small and large taxa. The dataset also includes microbial community metrics and rate-based parameters such as bacterial growth rates, primary productivity and bacterial production. Sampling was conducted across multiple ecotypes identified by “Area” in the dataset (Inner Harbor, Islands, Habitat Cells and Embayments). The data structure allows for comparisons among sites, seasons, ecotypes and provides the basis for statistical analysis of plankton community composition, trophic relationships and ecological patterns within the AOC of Toronto Harbor. Results indicate water quality, zooplankton abundance and biomass differed across habitat ecotypes, with Inner Harbor exhibiting very low biomass similar to the open waters of Lake Ontario and a higher proportion of small taxa like rotifers, in spite of elevated nutrients. This pattern suggests environmental stress from runoff and contamination from the surrounding urban area. Zooplankton prey reductions are likely due to multiple urban environmental impacts including runoff and contaminants. Ecotype impacted zooplankton productivity but not primary productivity, indicating that protected systems (Island channels, Habitat Cells and Embayments) can offer diverse physical habitats and forage for fishes. Though primary productivity rates were reduced in most habitats, productivity was shunted into bacterial growth which were highly elevated throughout the entire AOC.
-

The datasets contain water surface evaporation (PET, in mm of H2O) over Canada's landmass at a spatial resolution of 10-km and temporal intervals of a month and a year over a 24-year period of 2000-2023. The PET was produced by the Land Surface Model EALCO (Ecological Assimilation of Land and Climate Observations) developed at Natural Resources Canada. The PET algorithm in EALCO integrates the dynamic surface evolutions of liquid water, ice, and snow-on-ice for a waterbody into the Penman Equation. The PET was simulated at a daily time step. The monthly (or annual) PET in the datasets is the sum of the daily PET values in a month (or a year). Dew and frost formations simulated by EALCO are included in the PET as negative values, so the PET represents the net water flux between water surface and the atmosphere. Details of the dataset and the EALCO PET modelling algorithms can be found in Li, Wang, and Li (2020, Spatial variations and long‑term trends of potential evaporation in Canada. Scientific Reports, 10: 22089, doi.org/10.1038/s41598-020-78994-9).
-

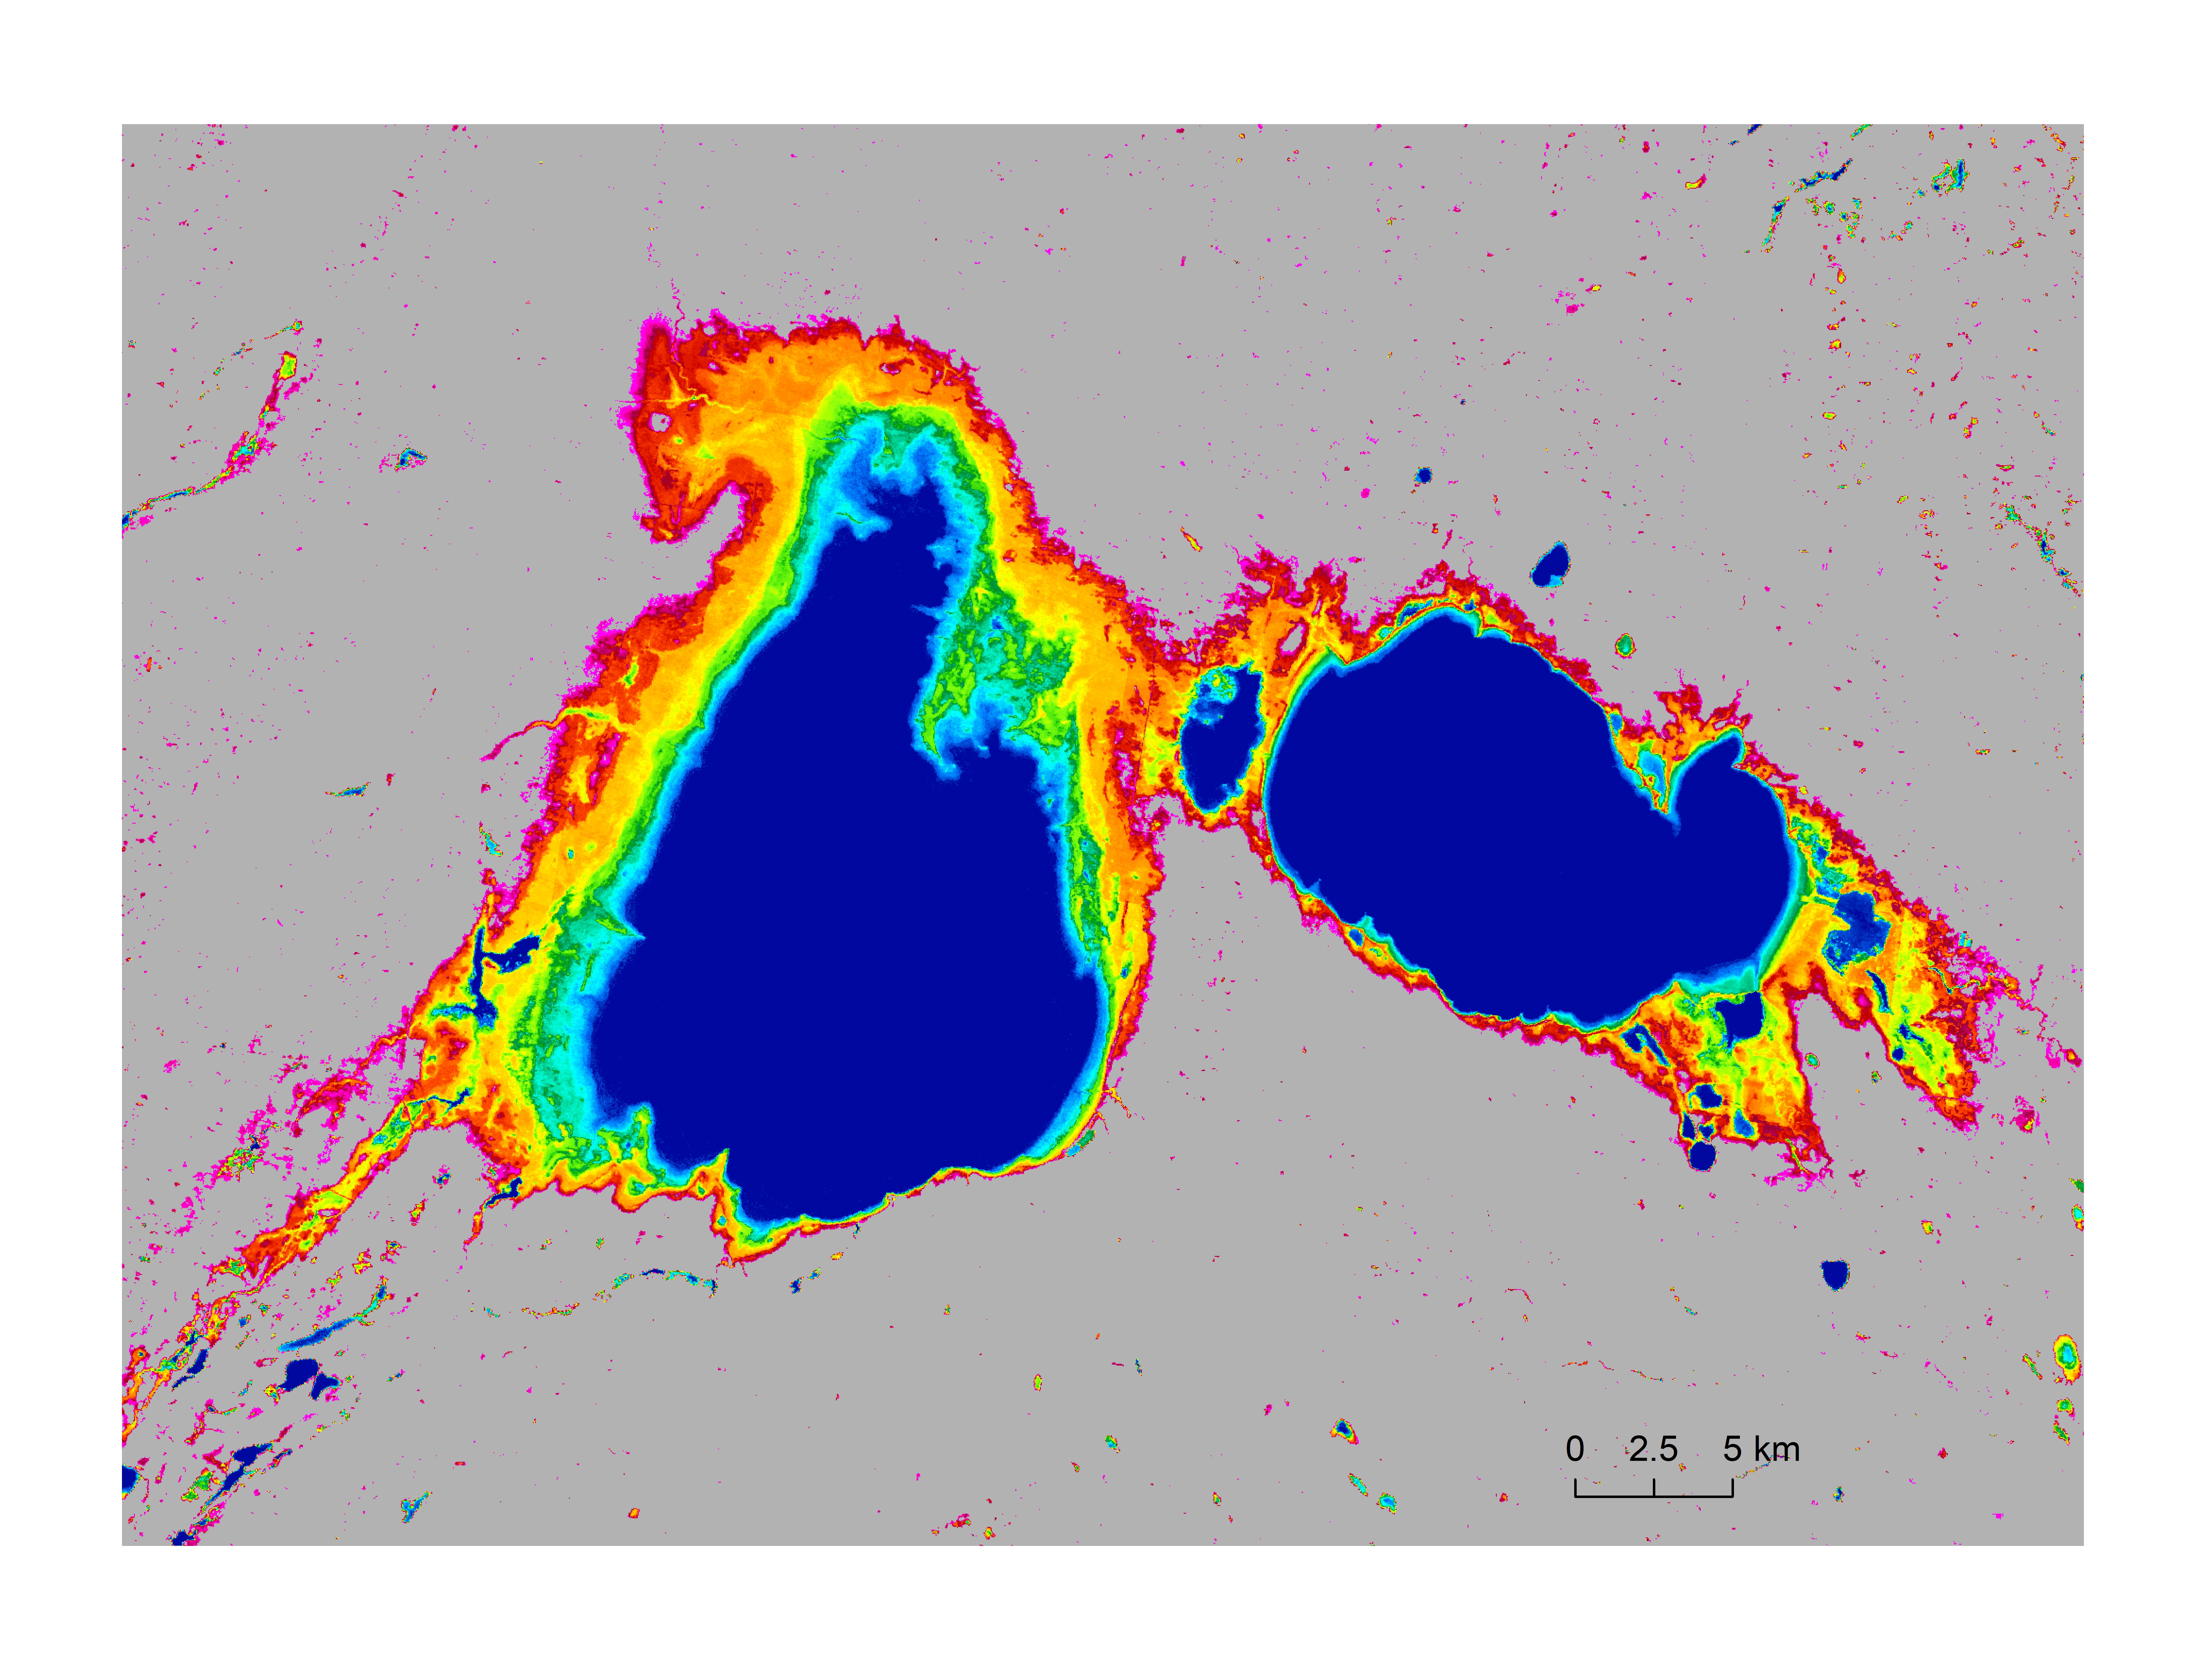
Data represents surface water occurrence frequency (percentage), which describes the frequency for each grid appeared as water in the 30 years time period of 1991 to 2020. The data covers Canada’s entire landmass including all transboundary watersheds, and is at 30-meter spatial resolution. The surface water occurrence frequency is derived using the surface water model of Wang et al. (2023) from all-available monthly water data observed by the Landsat satellites (Pekel et al., 2016). Here, permanent waters are represented by 100%, and permanent land surfaces by 0%, of water occurrence for a 30-meter by 30-meter grid. References: Pekel, J.-F., A. Cottam, N. Gorelick, A.S. Belward, 2016, High-resolution mapping of global surface water and its long-term changes. Nature, 540, 418-422. Wang, S., J. Li, and H. A. J. Russell, 2023, Methods for Estimating Surface Water Storage Changes and Their Evaluations. Journal of Hydrometeorology, DOI: https://doi.org/10.1175/JHM-D-22-0098.1.
 Arctic SDI catalogue