 Arctic SDI catalogue
Surveys
Type of resources
Topics
Keywords
Contact for the resource
Provided by
Formats
Representation types
Update frequencies
status
-

Fishing event (e.g., day, time, location, catch effort), and associated biological data from the Standardized Inlet Survey component of the annual Sablefish Research and Assessment Survey on the British Columbia coast. Introduction DFO and the Canadian Sablefish Association undertake a collaborative fishery-independent annual research survey under a joint agreement. The survey employs longline trap gear to obtain catch rate data, gather biological samples, capture oceanographic measurements, and collect tag release and recapture data. Data summaries are provided here for standardized sets conducted at fixed stations within mainland inlets. The design of the sablefish survey has developed over time by incorporating and discontinuing components, including individual experimental studies (not available on OpenData). This Standardized Inlet Survey component differs in methodology from the other two survey components: (1) Offshore stratified random survey (2003 – present; available on OpenData using link below), and (2) Standardized trap survey – offshore indexing and offshore tagging (1990 – 2010; not yet available on OpenData). For the Standardized Inlet Survey, sets are allocated to five specific polygons in each of the following four inlet areas: Portland Inlet, Gil Island, Finlayson Channel, and Dean/Burke Channel. All four inlets were surveyed consistently between 2003 and 2019. No inlets were surveyed in 2020, and a single inlet was surveyed each year since 2021. Survey procedures are standardized and documented in Canadian Technical Reports of Fisheries and Aquatic sciences. Data tables provided for the Standardized Inlet Survey include (i) Effort, (ii) Catch, and (iii) Biological Information. Inlet Effort This table contains information about annual survey trips and fishing events (sets). Trip-level information includes the year the survey took place, a unique trip identifier, the vessel that conducted the survey and the trip start and end dates (the dates the vessel was away from the dock conducting the survey). Set-level information includes the inlet name, date, time, location and depth that fishing took place, soak time, and number of traps deployed. All successful fishing events are included, where successful sets are those that met survey design specifications. Inlet Catch This table contains the catch information from successful fishing events. Catch is identified to species or to the lowest taxonomic level possible. Catch is recorded as fish counts and / or weight. The unique trip identifier and set number are included so that catches can be related to the fishing event information (including capture location) for each set. Inlet Biological Information This table contains the biological data for sampled catches. Data may include any or all of length, weight, sex, maturity and age. Most of the sampled catch is Sablefish; however, some biological information has been collected for other species. Age structures are collected and are archived until required for analyses; therefore, all existing structures have not been aged. Tissue samples (usually a fin clip) may be collected for genetic (DNA) analysis for specific species. Tissue samples may be archived until required for analysis; for more information please see the data contacts. The unique trip identifier and set number are included so that samples can be related to the fishing event and catch information.
-

These data sets provide information pertaining to epifauna taxa including bottom-dwelling shrimp and fish along trawling transects in Bones Bay and Turnour Bay between 2001 and 2002. Data sets were compiled and formatted by Meagan Mak. Abstract from the report: This study is a component of a larger project designed to assess potential effects of shrimp trawling gear on epifauna, shrimp, fish, and benthic habitat of Clio Channel located in Broughton Archipelago, British Columbia, Canada. Replicate beam-trawl surveys were carried out on individual transects in both Bones Bay and Turnour Bay located in the northern and southern portions of Clio Channel, respectively. A submersible, towed video-camera surveyed the seabed to enumerate epifauna and fish taxa before and after trawling activities. In regards to the video surveys, fish and epifauna (e.g. common shrimp) were observed across Clio Channel, while sea whips were predominate in the Turnour Bay video transects.
-

This dataset contains observations of species occurrences from seafloor imagery collected by the autonomous underwater vehicle (AUV) during the 2012 Expedition to Cobb Seamount. The National Oceanographic and Atmospheric Administration-operated SeaBED-class AUV which collected photographic images from 4 transects ranging from 436 m to 1154 m in depth.
-

These data sets provide information pertaining to shrimp and bycatch estimates associated with beam-trawling and trapping (2001-2002) in Clio Channel. Data sets were compiled and formatted by Meagan Mak. Abstract from report: As part of a project investigating possible modification of marine ecosystems by shrimp trawling and trapping, we enumerated beam trawl and prawn trap catches at two locations in Clio Channel, south -central coast of British Columbia. Beam trawl surveys were conducted in Bones Bay and Turnour Bay during October 2001 and January 2002, respectively, and a prawn trap survey was conducted in Turnour Bay during March 2002. Catch data from the two gear types are presented.
-
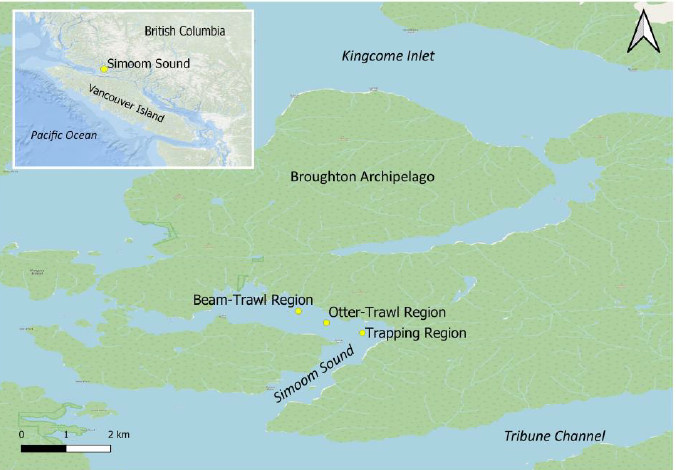
These data sets provide information pertaining to abundant taxa including bottom-dwelling shrimp and fish along trawling and trapping transects in Simoom Sound at November, 2000, and February, 2001. Data sets were compiled and formatted by Meagan Mak. Abstract from report: This study is a component of a larger project designed to compare the effects of shrimp trawling and trapping gear on shrimp, fish and the benthic habitat of Simoom Sound located in Broughton Archipelago, British Columbia, Canada. Otter-trawling, beam-trawling, and trapping took place in three distinct experiment blocks of the central seabed of the Sound. In turn, each block consisted of replicate transects, where a towed submersible video-camera surveyed shrimp and fish before and after trawling. Video surveys were deployed only before trapping. From the video surveys, we determined the abundance of common shrimp taxa and fish.
-

A goal of the Government of Canada’s Coastal Environmental Baseline Program (CEBP) is to amalgamate historic environmental data from high vessel traffic areas. An extensive DFO biological sampling program was conducted from 1980 to 1981 on Sturgeon and Roberts banks located on the outer Fraser River estuary, BC, Canada. This report collates and simplifies three data sets: water quality and nearshore fish catch previously published as DFO Data Report 340 (Conlin et al.1982), and un- published weight-length (W-L) data for two locations on Sturgeon Bank (Iona and Steveston) and near Westshore Terminals (Coal Port) on Roberts Bank. W-L data were reconstructed from archived computer printouts using Optical Character Recognition methods. Analyses of water quality data indicate that the two banks provided different fish habitats with Sturgeon Bank having a greater freshwater influence. Although Iona area water quality was exposed to sewage outfall from a nearby sewage treatment plant, it appears that fish communities were not different from the other Sturgeon Bank area (Steveston). The fish communities were found to be different between the two banks with Roberts Bank having greater overall abundance and diversity. Interestingly, of the seven fish species used for condition factor analyses, five were found to have lower Relative Condition Factors in the Roberts Bank sampling area.
-

This dataset contains observations of species occurrences from seafloor imagery collected by the remotely operated underwater vehicle (ROV) during the 2012 Expedition to Cobb Seamount. The ROV operated by Fisheries and Oceans Canada was a customized Deep Ocean Engineering Phantom HD2+2 which collected photographic images from 12 transects ranging from 35 m to 211 m in depth.
-

Fishing event data (e.g. year, date, time, location, catch and effort) and associated biological data from the Offshore Stratified Random Survey component of the annual Sablefish Research and Assessment Survey on the British Columbia coast. Introduction DFO and the Canadian Sablefish Association (CSA) collaborate to undertake an annual fishery-independent research survey under a joint agreement. The survey employs longline trap gear to obtain catch rate data, gather biological samples, capture oceanographic measurements, and collect tag release and recapture data. Data summaries provided here are for the offshore stratified random sampling design (StRS) component of the survey, which has been conducted annually since 2003. The design of the sablefish survey has developed over time by incorporating and discontinuing components, including individual experimental studies (not available on OpenData). This StRS Survey component differs in methodology from the other two survey components: (1) Standardized trap survey – mainland inlets (1994-present; available on OpenData using link below), and (2) Standardized trap survey – offshore indexing and offshore tagging (1990 – 2010; not yet available on OpenData). The Sablefish offshore stratified random trap survey (StRS) follows a depth and area stratified random sampling design. The survey area is partitioned into five spatial strata (S1 to S5) and three depth strata (RD1 to RD3) for a total of 15 strata. The five spatial strata are S1 (South West Coast Vancouver Island or SWCVI), S2 (North West Coast Vancouver Island or NWCVI), S3 (Queen Charlotte Sound or QCS), S4 (South West Coast of Haida Gwaii or SWCHG), and S5 (North West Coast of Haida Gwaii or NWCHG). The three depth strata are 100-250 fathoms (RD1), 250-450 fathoms (RD2), and 450-750 fathoms (RD3). The area within each of the 15 strata are sectioned into 2 km x 2 km grid cells or ‘fishing blocks’ from which set locations are randomly chosen each year. Survey procedures are standardized and documented in Canadian Technical Reports of Fisheries and Aquatic sciences. Data tables provided for the offshore stratified random survey include (i) effort, (ii) catch, (iii) biological information, (iv) the sampling frame from which blocks are selected for sampling each year, and (v) the calculated coastwide Sablefish biomass index. StRS Effort This table contains information about the annual survey trips and fishing events (sets). Trip-level information includes the year the survey took place, a unique trip identifier, the vessel that conducted the survey and the trip start and end dates (the dates the vessel was away from the dock conducting the survey). Set-level information includes the date, time, location and depth that fishing took place, the survey spatial and depth strata for the set, reason for the set, soak time, number of traps deployed and number of traps fished. All successful fishing events are included, i.e., those sets that conformed to specified survey standards. StRS Catch This table contains the catch information from successful fishing events. Catches are identified to species or to the lowest taxonomic level possible. Catches are recorded as fish counts and / or weight. The unique trip identifier and set number are included so that catches can be related to the fishing event information (including capture location). StRS Biological Information This table contains the biological data for sampled catches. Data may include any or all of length, weight, sex, maturity, and age. Most of the sampled catch is Sablefish; however, some biological information has been collected on Rockfish, Flatfish and other Roundfish species in some years. Age structures are collected and are archived until required for analyses; therefore, all existing structures have not been aged at this time. Tissue samples (usually a fin clip) may be collected for genetic (DNA) analysis for specific species. Genetic samples may be archived until required for analyses; for more information, please see the data contacts. The unique trip identifier and set number are included so that samples can be related to the fishing event and catch information. Sample Frame This table contains a list of all of the 2km x 2km grid cells or ‘fishing blocks’ that are part of the stratified random sampling frame. A subset of blocks are randomly selected for sampling each year from this list. For each grid cell, the corresponding depth and spatial strata ID is included. This sample frame can be used to calculate design-based abundance indices for the survey. StRS Biomass Index This table contains a coastwide relative biomass index for Sablefish based on the annual StRS survey. Stratified random sampling mean index values and 95% confidence intervals are calculated by year using the classical survey stratified random sampling estimator (Cochran 1977) and the number of possible sampling units per stratum provided by Wyeth et al. (2007). The relative biomass index has been input to the operating model and management procedure used to provide management advice for BC Sablefish since 2011 (Cox et al. 2011).
-
This data provides the integrated cadastral framework for Canada Lands. The cadastral framework consists of active and superseded cadastral parcel, roads, easements, administrative areas, active lines, points and annotations. The cadastral lines form the boundaries of the parcels. COGO attributes are associated to the lines and depict the adjusted framework of the cadastral fabric. The cadastral annotations consist of lot numbers, block numbers, township numbers, etc. The cadastral framework is compiled from Canada Lands Survey Records (CLSR), registration plans (RS) and location sketches (LS) archived in the Canada Lands Survey Records.
-

Catch, effort, location (latitude and longitude), and associated biological data from the Hecate Strait Multispecies Assemblage Bottom Trawl Surveys in Hecate Strait, British Columbia. Introduction The Hecate Strait Multispecies Assemblage Bottom Trawl survey series consists of twelve surveys that were conducted from 1984 to 2003 by the Pacific Biological Station, Fisheries and Oceans Canada. The main objective of this survey series was to collect detailed catch and biological data on species assemblages in order to develop an ecological basis for mixed species stock assessment in Hecate Strait. These surveys also provided abundance indices for individual species and were a source of information on recruitment. The surveys were conducted using a combination of charter vessels and two Canadian Coast Guard Research Vessels, the R/V G.B. Reed and R/V W.E. Ricker. To determine haul locations, a grid of 19 km² (10 nautical miles²) blocks were used with an attempt made to establish one trawl site within each 18 metre depth interval within each block. The 1984 survey involved one chartered and one research vessel; all other surveys were single vessel surveys. The Hecate Strait Multispecies Assemblage Bottom Trawl survey series surveyed Pacific Fishery Management areas 4, 5, and 101 to 106. A total of 1,111 number of tows were made with a Yankee 36 trawl net. This survey series is the predecessor for the present day Hecate Strait Synoptic Bottom Trawl Survey and represents one of the longest running time series of fisheries independent groundfish surveys on the west coast. For further details about the Hecate Strait Multispecies assemblage bottom trawl survey series, a list of reports can be found in the supporting documents section. Effort This table contains information about the survey trips and fishing events (trawl tows/sets) that are part of this survey series. Trip-level information includes the year the survey took place, a unique trip identifier, the vessel that conducted the survey, and the trip start and end dates (the dates the vessel was away from the dock conducting the survey). Set-level information includes the date, time, location, and depth that fishing took place, as well as information that can be used to calculate fishing effort (duration) and swept area. All successful fishing events are included, regardless of what was caught. Catch This table contains the catch information from successful fishing events. Catches are identified to species or to the lowest taxonomic level possible. Most catches are weighed, but some are too small (“trace” amounts) or too large (e.g. very large Big Skate). The unique trip identifier and set number are included so that catches can be related to the fishing event information (including capture location). Biology This table contains the available biological data for catches which were sampled. Data may include any or all of length, sex, weight, age. Different length types are measured depending on the species. Age structures are collected when possible for species where validated aging methods exist and are archived until required for an assessment; therefore, all existing structures have not been aged at this time. The unique trip identifier and set number are included so that samples can be related to the fishing event and catch information. Biomass This table contains relative biomass indices of species that have been captured in every survey of the time series. The coefficient of variation and bootstrapped 95% confidence intervals are provided for each index. The groundfish data synopsis report (Anderson et al. 2019) provides an explanation of how the relative biomass indices are derived.