 Arctic SDI catalogue
atlas
Type of resources
Available actions
Topics
Keywords
Contact for the resource
Provided by
Years
Formats
Representation types
Update frequencies
status
Service types
-
The Agro-Pedological Atlas is a set of layers which show the characteristics, the fertility, the quality of the water regime, the vulnerability to degradation and the potential of the agricultural soils and land in the Monteregian region of the province of Quebec. Une version en français est disponible à http://nlwis-snite1.agr.gc.ca/cgi-bin/ogc/apaq-aapq_wms_f?service=wms&request=getcapabilities
-
The Agro-Pedological Atlas is a set of interactive maps which show the characteristics, the fertility, the quality of the water regime, the vulnerability to degradation and the potential of the agricultural soils and land in the Monteregian region of the province of Quebec.
-
L'atlas agropédologique est un ensemble de cartes interactives qui montrent les caractéristiques, la fertilité, la qualité du régime hydrique, la vulnérabilité à la dégradation et le potentiel des sols et des terres agricoles situées en Montérégie dans la province de Québec.
-
L’Atlas agropédologique est un ensemble de couches qui montrent les caractéristiques, la fertilité, la qualité du régime hydrique, la vulnérabilité à la dégradation et le potentiel des sols et des terres agricoles situées en Montérégie dans la province de Québec. An English version is available at http://nlwis-snite1.agr.gc.ca/cgi-bin/ogc/apaq-aapq_wms_e?service=wms&request=getcapabilities
-
The "Atlas of New Brunswick - Digital Edition" contains over 2000 maps across two scale levels (1:30,000 and 1:150,000). These maps can be viewed in their digital format (PDF) or they can be downloaded and printed. All maps are formatted to be printed on a tabloid sized page (11" x 17"). Printing on a different page size will distort the scale of the maps. An index of featured place names is also included which is updated weekly.
-

This file contains a generalized representation of watersheds developed from the 1:50,000 BC Watershed Atlas with each region coded for occurrence of freshwater fish species (including anadromous salmon in their freshwater stages). The initial fish species codes for presence/absence in each watershed were derived from an GIS overlay of fish species occurrences within broadly defined fish regions for BC. This overlay of fish ranges describes the occurrences of fish species in 30 regions throughout the province. These broad species ranges were derived from McPhail and Carveth's 'Key to Freshwater Fish of BC' and refined further based on the most current expert opinion. Coding for watershed polygons based on this expert opinion was originally: 0= out of species range; 4 = core range; 5= introduced range; 6= peripheral range; 9= estuarine polygons only. A further refinement of watershed fish species coding was developed from actual observations of fish species in the lakes and rivers of British Columbia. This data comes from a number of fish inventory sources. Watersheds with known records of occurrence for each fish species were consequently recoded as such: 4, 5, 6, 9 now equal '1' if a museum record, and, 4, 5, 6, 9 now equal '2' for a less reliable record, and, 0 now equals '8'. for an out-of range record
-

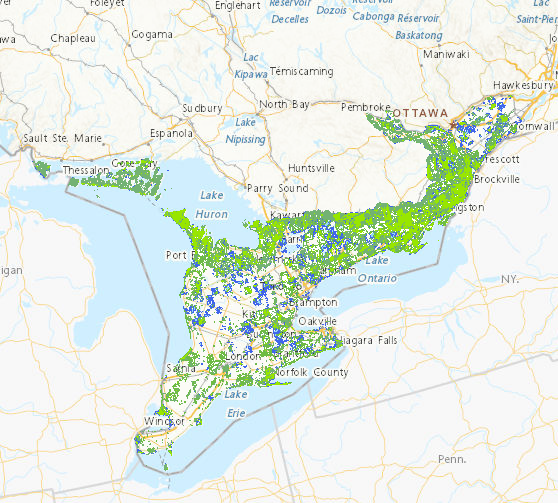
The Canadian Wildlife Service - Ontario Region Biodiversity Atlas represents the Canadian Wildlife Service biodiversity portfolio across the Ontario portions of the Boreal Hardwood Shield (Bird Conservation Region 12) and Mixedwood Plains (Bird Conservation Region 13) ecozones. These data are the derived product from an extensive landscape assessment that assessed the Canadian Wildlife Service biodiversity portfolio (Species at Risk, migratory birds, habitat) at various resolutions. Biodiversity is mapped by forest, grassland (open country) and wetland quality and quantity, and then progressively combined to identify local High Value Biodiversity Areas. At the finest resolution, scores were applied to each unit of analysis (5 hectare hexagon in Bird Conservation Region 12; 2 hectare hexagon in Bird Conservation Region 13), based on over 30 criteria for landscape habitat condition, Species at Risk and migratory birds. Habitat condition scores were derived from guidance in Environment and Climate Change Canada's existing How Much Habitat is Enough? and in Bird Conservation Region 12, where the landscape is less fragmented, habitat was also based on draft guidance in How Much Disturbance is too Much? Individual scores were summed and various combinations (e.g. top 25% of forest scores + top 25% of Species at Risk (SAR) scores) were calculated to identify areas with multiple conservation value. For each habitat type (forest, grassland and wetland), study units with more than one conservation value were aggregated into High Value Habitat which were subsequently aggregated into High Value Biodiversity Areas (HVBA). The results are areas on the landscape that have high value from a Canadian Wildlife Service specific lens; that is, they are high quality habitats that are important for Species at Risk and/or migratory birds. High value habitats are those forests, grasslands and wetlands with potential high conservation value (PHCV). They contain at least 1 of a possible 3 potential high conservation values: top 25% of overall habitat scores, top 25% of Species at Risk (SAR) scores, and/or top 25% of relevant migratory bird scores. High value forest, grassland and wetland were derived by combining landscape, Species at Risk (SAR) and migratory bird elements (see Table 1). Overall habitat scores were assigned to each study unit based on the combined scores for each forest, grassland and wetland. These overall habitat scores were divided into quartiles, and the top 25% of each total score (overall forest, overall grassland and overall wetland) are considered to be potential high conservation value. Similarly, SAR scores were assigned for each study unit, totalled and broken into quartiles. The top 25% of SAR scores that intersect each of forest, grassland and wetland are considered to be the highest quality habitats important to SAR and have potential high conservation value. Finally, relevant migratory bird scores were totalled within each study unit, divided into quartiles and the top 25% of migratory bird scores that intersect each of forest, grassland and wetland are considered to be the highest quality habitats important to migratory birds and have potential high conservation value. Study units with a PHCV greater than 0 (i.e., contains at least 1 of the possible 3 potential high conservation values) were aggregated together by 750 m to create High Value Habitats. High value biodiversity areas (HVBAs) are those study units that contain multiple high value habitats (high value forest and/or high value grassland and/or high value wetland). High value biodiversity areas (HVBA) were derived by aggregating high value forest, grassland and wetland. Study units with a potential high conservation value greater than 1 were aggregated together by 750 m. Biodiversity sites are areas greater than 20 ha, and secondary biodiversity sites are areas less than 20 ha in area.
-
The Canadian Wildlife Service - Ontario Region Biodiversity Atlas represents the Canadian Wildlife Service biodiversity portfolio across the Ontario portions of the Boreal Hardwood Shield (Bird Conservation Region 12) and Mixedwood Plains (Bird Conservation Region 13) ecozones. These data are the derived product from an extensive landscape assessment that assessed the Canadian Wildlife Service biodiversity portfolio (Species at Risk, migratory birds, habitat) at various resolutions. Biodiversity is mapped by forest, grassland (open country) and wetland quality and quantity, and then progressively combined to identify local High Value Biodiversity Areas. At the finest resolution, scores were applied to each unit of analysis (5 hectare hexagon in Bird Conservation Region 12; 2 hectare hexagon in Bird Conservation Region 13), based on over 30 criteria for landscape habitat condition, Species at Risk and migratory birds. Habitat condition scores were derived from guidance in Environment and Climate Change Canada's existing How Much Habitat is Enough? and in Bird Conservation Region 12, where the landscape is less fragmented, habitat was also based on draft guidance in How Much Disturbance is too Much? Individual scores were summed and various combinations (e.g. top 25% of forest scores + top 25% of Species at Risk (SAR) scores) were calculated to identify areas with multiple conservation value. For each habitat type (forest, grassland and wetland), study units with more than one conservation value were aggregated into High Value Habitat which were subsequently aggregated into High Value Biodiversity Areas (HVBA). The results are areas on the landscape that have high value from a Canadian Wildlife Service specific lens; that is, they are high quality habitats that are important for Species at Risk and/or migratory birds. High value habitats are those forests, grasslands and wetlands with potential high conservation value (PHCV). They contain at least 1 of a possible 3 potential high conservation values: top 25% of overall habitat scores, top 25% of Species at Risk (SAR) scores, and/or top 25% of relevant migratory bird scores. High value forest, grassland and wetland were derived by combining landscape, Species at Risk (SAR) and migratory bird elements (see Table 1). Overall habitat scores were assigned to each study unit based on the combined scores for each forest, grassland and wetland. These overall habitat scores were divided into quartiles, and the top 25% of each total score (overall forest, overall grassland and overall wetland) are considered to be potential high conservation value. Similarly, SAR scores were assigned for each study unit, totalled and broken into quartiles. The top 25% of SAR scores that intersect each of forest, grassland and wetland are considered to be the highest quality habitats important to SAR and have potential high conservation value. Finally, relevant migratory bird scores were totalled within each study unit, divided into quartiles and the top 25% of migratory bird scores that intersect each of forest, grassland and wetland are considered to be the highest quality habitats important to migratory birds and have potential high conservation value. Study units with a PHCV greater than 0 (i.e., contains at least 1 of the possible 3 potential high conservation values) were aggregated together by 750 m to create High Value Habitats. High value biodiversity areas (HVBAs) are those study units that contain multiple high value habitats (high value forest and/or high value grassland and/or high value wetland). High value biodiversity areas (HVBA) were derived by aggregating high value forest, grassland and wetland. Study units with a potential high conservation value greater than 1 were aggregated together by 750 m. Biodiversity sites are areas greater than 20 ha, and secondary biodiversity sites are areas less than 20 ha in area.