 Arctic SDI catalogue
coastal
Type of resources
Available actions
Topics
Keywords
Contact for the resource
Provided by
Years
Formats
Representation types
Update frequencies
status
Service types
-

The Canadian Hydrographic Service (CHS) Low Water Mark Lines provide alongshore and across-shore geomorphological and biological attributes of the low water mark shoreline. The lines are used in the CHS nautical charts to represent the level reached by sea water at low tide.
-
Coastal British Columbia bathymetry. Depth P - Photic 0-20m S - Shallow 20-200m M - Midepth 200 - 500 D - Deep 500-1000m A - Abyssal > 1000m X - unknown Blanks are land CRIMS is a legacy dataset of BC coastal resource data that was acquired in a systematic and synoptic manner from 1979 and was intermittently updated throughout the years. Resource information was collected in nine study areas using a peer-reviewed provincial Resource Information Standards Committee consisting of DFO Fishery Officers, First Nations, and other subject matter experts. There are currently no plans to update this legacy data.
-
(La version française suit) What is an Ecologically and Biologically Significant Area? Ecologically and Biologically Significant Areas (EBSAs) are areas within Canada’s oceansthat have been identified through formal scientific assessments as having special biological or ecological significance when compared with the surrounding marine ecosystem.Failure to define an area as an EBSA does not mean that it is unimportant ecologically. All areas serve ecological functions to some extent and require sustainable management. Rather, areas identified as EBSAs should be viewed as the most important areas where, with existing knowledge, regulators and marine users should be particularly risk averse to ensure ecosystems remain healthy and productive. Why are EBSAs identified? EBSA information is used to inform marine planning, including environmental assessment and the siting of marine-based activities, by: Informing and guiding project-specific or regional environmental assessments; Informing and guiding industries and regulators in their planning and operations, for example: EBSAs have been acknowledged and referred to (often as "Special Areas" or "Potentially Sensitive Areas") in oil and gas related assessments. EBSA information has been provided to proponents of submarine cable projects to be used for route planning purposes. Informing and guiding the Integrated Oceans Management (IOM)process within five Large Oceans Management Areas (LOMAs)and 12 marine bioregions; Serving as a basis for the identification of Areas of Interest (AOIs)and of Marine Protected Areas (MPAs)(individually and in the context of planning bioregional networks of MPAs); How are EBSAs identified? The process used to identify EBSAs is generally comprised of two phases. The first phase involves compiling scientific data and knowledge of a marine area’s ecosystems ─ notably fish species, marine mammals, sea birds, marine flora, marine productivity, physical and chemical conditions and geology. “Knowledge” includes experiential knowledge of long-time uses of the areas. In some cases (e.g., in the Arctic), substantial efforts are taken to collect traditional knowledge on ecosystems and environmental conditions from community members, fish harvests, hunters and individuals whose knowledge of the study area complement and often helps fill scientific data gaps. In the second phase, the available information for a marine area (e.g. a bioregion) is assessed against five nationally-established science-based criteria including: Uniqueness: How distinct is the ecosystem of an area compared to surrounding ones? Aggregation: Whether or not species populate or convene to the study area? Fitness consequence: How critical the area is to the life history of the species that use it (e.g. is it a spawning or feeding ground)? Naturalness: How pristine or disturbed by human activities is the study area? Resilience: What is the ability of the ecosystem to bounce back if it is disturbed? Progress to date and next steps EBSAs have been identified for large portions of Canada’s Atlantic and Pacific oceans as well as most of the Arctic oceans. For a map of current EBSAs in these areas, click here. EBSAs will continue to be identified in priority areas as resources become available to carry out the process. The boundaries or locations of existing EBSAs may be modified to reflect both new knowledge and changing environmental conditions. Les zones d'importance écologique et biologique (ZIEB) sont des zones au sein des eaux océaniques canadiennesque des évaluations scientifiques officielles ont désignées comme ayant une importance écologique et biologique particulière par rapport à l'écosystème marin environnant. Le fait qu'une zone n'ait pas été désignée comme ayant une importance écologique et biologique ne signifie pas pour autant qu'elle n'a pas une importance écologique. Toutes les zones assument des fonctions écologiques dans une certaine mesure et exigent une gestion durable. Les zones désignées comme des ZIEB devraient plutôt être vues comme des zones extrêmement importantes, où les connaissances, les législateurs et les utilisateurs des ressources marines doivent exercer une grande prudence eu égard au risque, afin de veiller à ce que les écosystèmes restent sains et productifs. Pourquoi des ZIEB sont-elles désignées? Les renseignements relatifs à ces aires sont utilisés pour appuyer la planification marine, notamment l'évaluation environnementale et la mise en place d'activités marines: En informant et guidant les industries et les législateurs pour une planification et une conduite d'activités optimale, par exemple: les zones d'importance écologique et biologique ont été prises en compte et mentionnées dans les évaluations portant sur le pétrole et le gaz. Des renseignements ont été fournis aux promoteurs de projets de câbles sous-marins, afin de les aider à en déterminer les tracés. En information et en guidant le processus de gestion intégrée des océans dans cinq zones étendues de gestion des océans et 12 biorégions marines. En servant de fondement pour la détermination des zones d'intérêt et des zones de protection marines (de manière individuelle et dans le cadre de la planification des réseaux biorégionaux de zones de protection marines). Comment désigne-t-on les zones d'importance écologique et biologique? Le processus utilisé pour désigner les zones d'importance écologique et biologique comprend généralement deux étapes. La première étape consiste à recueillir des données scientifiques et des connaissances relatives aux écosystèmes d'une aire marine, notamment les espèces de poissons, de mammifères marins et d'oiseaux marins, la flore marine, la productivité marine, les conditions physiques et chimiques, et la géologie. Les « connaissances » comprennent les connaissances empiriques des utilisateurs de longue date de ces aires. Dans certains cas (p. ex. dans l'Arctique), d'importants efforts sont déployés pour réunir les connaissances traditionnelles sur les écosystèmes et les conditions environnementales des membres des communautés, des pêcheurs, des chasseurs et des personnes dont la connaissance de la zone étudiée complète l'information existante et permet souvent d'aider à combler les lacunes dans les données scientifiques. La deuxième étape consiste à évaluer l'information disponible relative à une aire marine (p. ex., une biorégion) en utilisant cinq critères scientifiques nationaux: La spécificité: dans quelle mesure l'écosystème d'une aire est-il distinct des écosystèmes environnants? La concentration: l'aire étudiée abrite-t-elle des espèces ou est-elle un lieu de regroupement d'espèces? Les conséquences sur la valeur adaptative: dans quelle mesure l'aire est-elle vitale pour le cycle biologique des espèces qui l'utilisent (p. ex., est-ce une zone de frai ou d'alimentation? Le caractère naturel: dans quelle mesure la zone étudiée est-elle demeurée intacte ou est-elle perturbée par les activités humaines? La résilience: dans quelle mesure l'écosystème est-il capable de se rétablir s'il est perturbé? Progrès réalisés à ce jour et prochaines étapes Des zones d'importance écologique et biologique ont été désignées dans une grande partie des eaux océaniques de l'Atlantique et du Pacifique canadien, ainsi que dans la quasi-totalité de l'océan Arctique. À mesure que des ressources seront disponibles pour mener à bien le processus, des zones d'importance écologique et biologique continueront à être désignées dans les zones prioritaires. Les limites ou les emplacements des zones d'importance écologique et biologique existantes sont susceptibles d'être modifiés pour refléter les nouvelles connaissances et conditions environnementales.
-
A point file showing a collection of specific GPS spatial points recorded during the video taping of the shoreline. The points are represented by a specific latitude and longitude taken at a specific date and time. Each are associated with a specific BIOSLIDE at a specific SHOREUNIT in the Shorezone data
-
The Canadian Hydrographic Service (CHS) High Water Mark Lines provide alongshore and across-shore geomorphological and biological attributes of the high water mark shoreline. The lines are used in the CHS nautical charts to represent the level reached by sea water at high tide.
-
Location of Harbour Seal haulout locations in coastal BC waters. CRIMS is a legacy dataset of BC coastal resource data that was acquired in a systematic and synoptic manner from 1979 and was intermittently updated throughout the years. Resource information was collected in nine study areas using a peer-reviewed provincial Resource Information Standards Committee consisting of DFO Fishery Officers, First Nations, and other subject matter experts. There are currently no plans to update this legacy data.
-
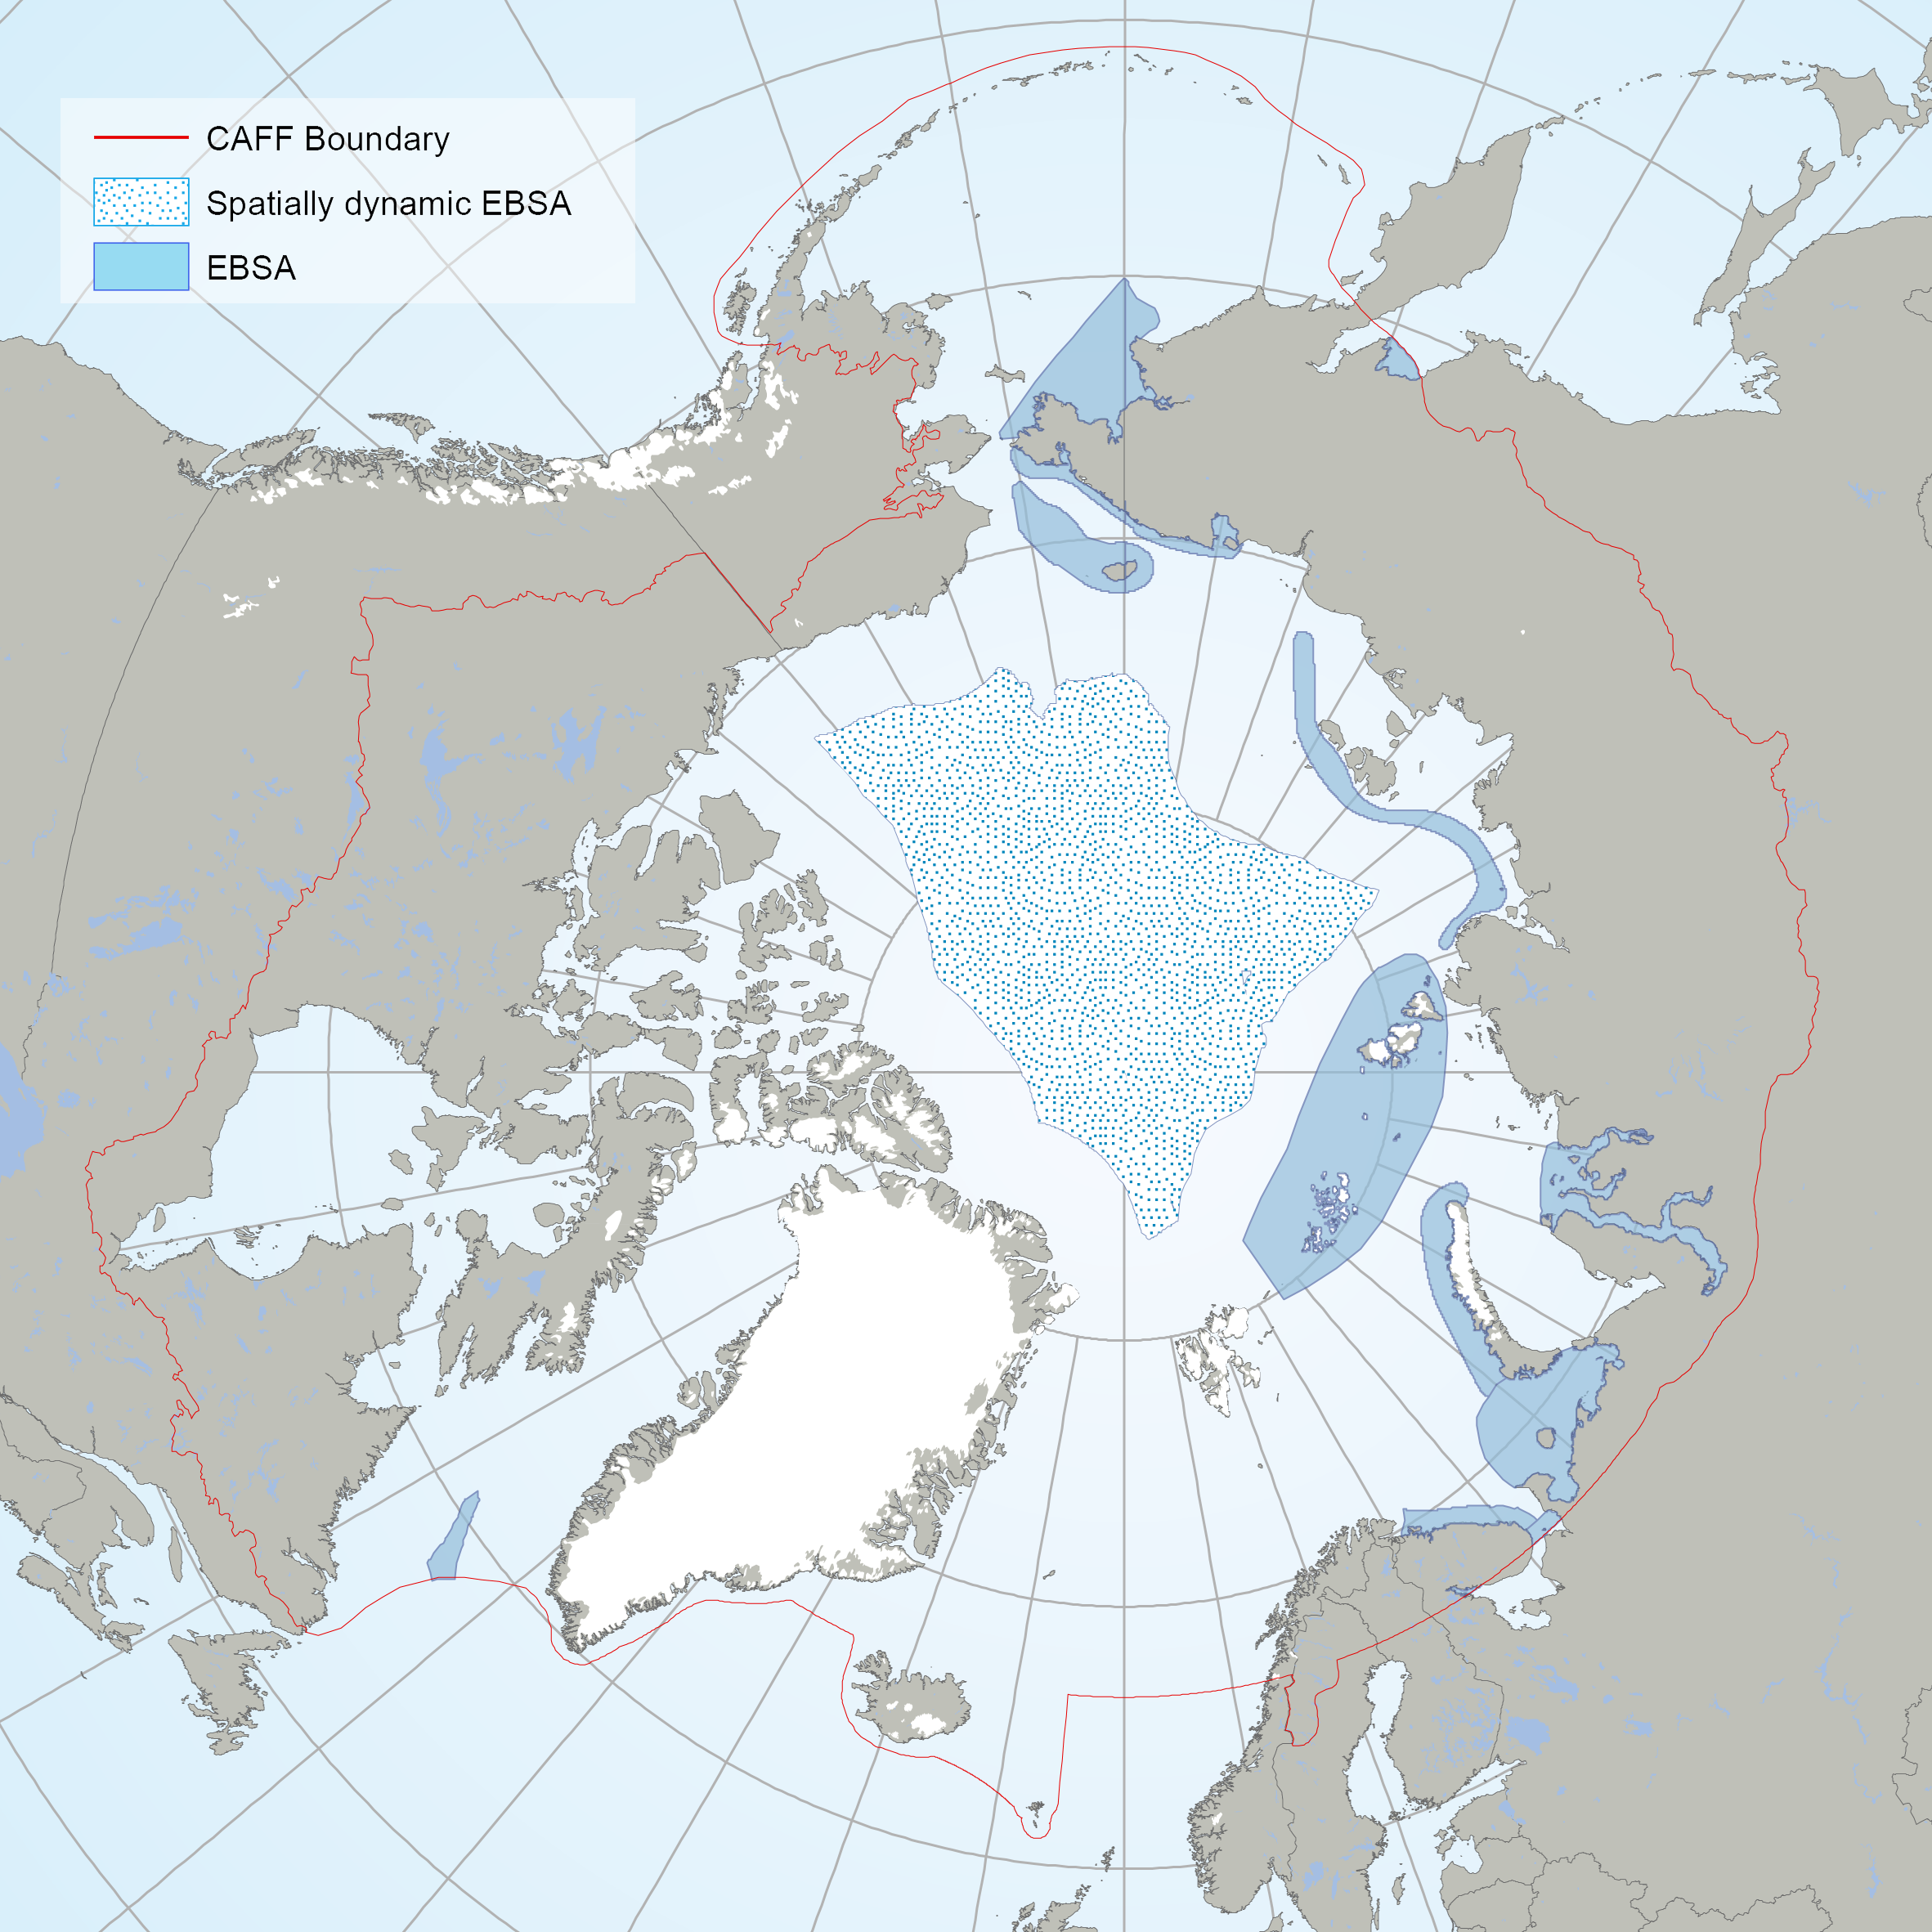
The EBSAs are special areas in the ocean that serve important purposes, in one way or another, to support the healthy functioning of oceans and the many services that it provides. The EBSAs contained din this dataset are the result of an Arctic Regional Workshop to Facilitate the Description of Ecologically or Biologically Significant Marine Areas (EBSAs) held in Finland on 3-7 march, 2014. <a href="https://www.cbd.int/ebsa/ebsas" target="_blank">Resource</a>
-

This dataset is derived from analyses of photo samples obtained by deploying drop camera photo (DCP) systems conducted during various research surveys in coastal areas of the north shore of the St. Lawrence Estuary and the Gulf between Portneuf-sur-Mer and Sept-Îles between June and October of 2019 to 2022. It contains 4866 species occurrence data of 109 different taxa for epibenthic invertebrates and submerged aquatic vegetation (including algae) at depths ranging from 0 to more than 50 meters. Additional information about this dataset is available in the “Method step description” section. The research surveys were undertaken by the Department of Fisheries and Oceans Canada as part of the baseline program of the Ocean Protection Plan. This initiative aims to acquire environmental baseline data contributing to the characterization of important coastal areas and to support evidence-based assessments and management decisions for preserving marine ecosystems. Data acquired during the research surveys additionally include: 1) fish and invertebrate species occurrence data derived from analyses of video samples collected using a stereoscopic baited remote underwater camera video systems (stereo-BRUVs) 2) fish and invertebrates catch data from beam trawl sampling (occurrence and catch weights by species), 3) substrate classification based on drop camera samples, 4) oceanographic measurements of the water column from Seabird 19plus V2 profiling CTD (conductivity, temperature, depth, photosynthetic active radiation, pH, dissolved oxygen), 5) nutrients (NO2, NO3, NH4, PO4, SiO3) and dissolve organic carbon (DOC) concentrations, and 6) current speed and direction from tilt meters. The datasets of the first two elements will also be available as independent datasets on the OBIS/GBIF portal. To obtain data from items 3-6 and/or biological data collected on fish and invertebrate taxa, please contact David Lévesque or Marie-Julie Roux. The elaboration of conservation objectives based on an ecosystem assessment approach for fishery stock assessment requires the development of sampling methods to maximize the data collection on the ecosystem, while minimizing the impact on organisms and the marine environment. This project aims at characterising the coastal ecosystem of the St. Lawrence Estuary and Gulf between Portneuf-sur-Mer and Sept-Îles (QC), including the physico-chemistry of water, phytoplankton, zooplankton, submerged vegetation, benthic habitats as well as assemblages of fish and invertebrates. Sampling was performed by combining conventional methods such as CTD profiling, zooplankton nets, and beam trawl, with non-extractive methods such as drop camera photo (DCP) and stereoscopic baited remote underwater camera video systems (stereo-BRUVs). The data collected will help define baseline ecosystem conditions in the study area; explore the links between environmental conditions, habitat structure and biological assemblages; identify important habitats for marine species; as well as the evaluation of the performance of visual sampling methods compared to conventional methods. The results will make it possible to optimize the seasonal or annual monitoring in order to better understand the direct and indirect effects of human activities in coastal environments. Method Step Description: 1. Acquisition of photo samples in sequence: The drop camera photo (DCP) system used to sample underwater pictures is a stainless steel frame in the shape of a triangular prism of 50 cm wide, 100 cm long and 76 cm high at the level of the central eyelet. The sampling area is a quadrat of 0.25 m2 (interior dimensions of 50 cm by 50 cm). The system consists of two GoPro Hero 5 cameras (4000 × 3000 pixels) and two 8000 lumens dive lights (Big Blue VL8000). The first camera captures the elements located in the quadrat when viewed from above. The second camera offers an oblique view facilitating the evaluation of the elements present in the quadrat. At all sampling stations, five to nine system deployments (replicas) capturing photos every 10 seconds for 60 to 120 seconds were performed. Surveys took place between : June 28th to July 5th 2019 July 13th to July 20th 2019 September 30th to October 9th 2019 August 10th to August 20th 2020 October 1st to October 10th 2020 April 22nd to May 5th 2021 July 27th to August 10th 2021 October 15th to October 24th 2021 June 24th to Jully 5th 2022 August 15th to August 26th 2022 2. Image analysis: A photo image analysis method with sequence (moving images) was used for the occurrence data extraction and organism counts; measurements were taken to obtain vegetation cover percentages and substrate analyzes were also carried out. Analyzes were performed with the open-source Fiji software from ImageJ. A quality/visibility rating was assigned to the analyzed image sequences. 3. Taxonomic approach: Epibenthic organisms were identified at the lowest possible taxonomic rank. A morphotype approach has been systematically used (during annotations) for the identification of sponges, hydrozoans and bryozoans, and occasionally for other organisms such as algae. Species codes were also used to distinguish certain species that could not be identified at the time of the annotations (see verbatim Identification). To eliminate observer bias, the same person analyzed all images used in this database. The organisms were identified from underwater images using a combination of identification guides and scientific papers. 4. Open nomenclature: The concept of open nomenclature has been integrated into occurrence data to support taxonomic identifications with their level of certainty, as recommended by Horton et al., 2021. The abbreviation stet. (stetit) was used when the decision not to go lower was made but an identification might be possible, whereas indet (Indeterminabilis) was used when a lower level identification was considered uncertain or impossible (see identificationqualifier). In addition, the abbreviation Confer (cf.) was used and integrated into the data tables (see occurrenceRemarks) in order to link identifications that could potentially and/or possibly be associated. 5. Remarks: Several remarks have also been incorporated (see organismRemarks, identificationRemarks and taxonRemarks), and are intended to provide additional information that may be useful to some data users; Please note that these sections could be modified or improved. 6. Quality control: The taxonomic identifications were verified through a validation process, in collaboration with various expert taxonomists. All scientific names have been checked against the World Register of Marine Species (WoRMS) to match currently recognized standards. The WoRMS match was placed in the taxonID field of the instance file. Data quality control was performed using Robistools and worms packages. All sample locations were plotted on a map for visual verification that the latitude and longitude coordinates were within the described sample area. 7. Data sharing: Only metadata and biodiversity occurrence data are shared in this dataset. The two files provided (DarwinCore format) are complementary and are linked by the "eventID" key. The "event" file includes generic event information, including date and location. The "occurrence" file includes the original identifiers of the observed organisms, identification comments and their taxonomy. A data dictionary is also provided to explain the fields used. For access to other data or images, contact David Lévesque. For more details about the project and the methodology, a technical report (Scallon-Chouinard et al., 2022) including sampling methods with drop camera photo systems (DCP) and stereoscopic baited remote underwater camera video systems (stereo-BRUVs) is currently available online (https://waves-vagues.dfo-mpo.gc.ca/library-bibliotheque/41081225.pdf); another technical report detailing photo and video image analysis methods will also be available. This project was funded by the Department of Fisheries and Oceans Canada as part of the baseline program of the Ocean Protection Plan.
-

This dataset derives from a series of beam trawl tows conducted during several research surveys in coastal areas of the St. Lawrence Estuary, between Portneuf-sur-Mer and Pointe-des-Monts, and between June and October of 2019, 2020, 2021 and 2022. It contains catch data for fish and invertebrates (occurrence and catch weights by species), in trawl tows conducted at depths ranging from 10 to 50 meters. Data were collected in various cruises: • June 28th to July 5th 2019 (NGCC Leim) • September 30th to October 9th 2019 (NGCC Leim) • October 1st to October 10th 2020 (NGCC Leim) • April 22nd to May 5th 2021 (NGCC Perley) • October 15th to October 24th 2021 (NGCC Perley) • June 24th to July 15th 2022 (NGCC LEIM) The beam trawl used to generate this data set consists of a frame (width of 2.8 m, height of 0.8 m) equipped with a 6.5 m long net with 40 mm diamond mesh, which is lined with a net (skirt) of square mesh (5 mm) at the cod-end (length 2 m) and a protective apron (75 mm mesh) on the ventral portion. Three skid chains are linked at the base of the skates. Each station corresponds to a 5 to 10 minutes tow along an isobath at a speed of about 2 knots. At each haul, the trawl catch was placed on a sorting table on the deck and the organisms were sorted and identified at the best possible taxonomic resolution. Most taxa were independently weighed. Some invertebrates taxa were subsampled, counted and weighted in order to estimate their contribution (weight and number) to the total catch. Additionally, the first 30 fish of each species were measured and weighed individually. Taxonomic names were verified on the World Register of Marine Species (WoRMS) to match recognized standards. The WoRMS match has been put in the scientificNameID field in the occurrence file. Data quality control was performed using the R packages obistools and worrms. All sampling locations were plotted on a map to perform a visual check confirming that the latitude and longitude coordinates were within the described sampling area. Data acquired during the research surveys additionally included: 1) occurrence data on epibenthic invertebrates and submerged aquatic vegetation in photo samples from a drop camera system, 2) occurrence data on fish and invertebrate taxa in video samples collected using a baited underwater video system (BUV), 3) substrate classification based on drop camera photo samples, 4) oceanographic measurements of the water column from Seabird 19plus V2 profiling CTD (conductivity, temperature, depth, photosynthetic active radiation, pH, dissolved oxygen), 5) nutrients (NO2, NO3, NH4, PO4, SiO3) and dissolve organic carbon (DOC) concentrations, and 6) current speed and direction from tilt meters. The first two items are available as independent data on the OBIS portal. To obtain data from items 3-6 and/or biological data collected on fish and invertebrate taxa, please contact David Lévesque or Marie-Julie Roux. The research surveys were undertaken by the Department of Fisheries and Oceans Canada as part of the baseline program of the Ocean Protection Plan. This initiative aimed to acquire environmental baseline data contributing to the characterization of important coastal areas and in support of evidence-based assessments and management decision-making for preserving marine ecosystems. Which contribute to the elaboration of conservation objectives based on an ecosystem assessment approach for fishery stock assessment requires the development of sampling methods to maximize the data collection on the ecosystem, while minimizing the impact on organisms and the marine environment. This project aims at characterising the coastal ecosystem of the St. Lawrence Estuary between Portneuf-sur-Mer and Godbout (QC), including the physico-chemistry of water, phytoplankton, zooplankton, submerged vegetation, benthic habitats as well as assemblages of fish and invertebrates. Sampling was performed by combining conventional methods such as CTD profiling, zooplankton nets, and beam trawl, with non-extractive methods such as dropped photo cameras and stereoscopic baited video camera systems. The data collected will help define baseline ecosystem conditions in the study area; explore the links between environmental conditions, habitat structure and biological assemblages; identify important habitats for marine species; as well as the evaluation of the performance of visual sampling methods compared to conventional methods. The results will make it possible to optimize the seasonal or annual monitoring in order to better understand the direct and indirect effects of human activities in coastal environments. This project was funded by the Department of Fisheries and Oceans Canada as part of the baseline program of the Ocean Protection Plan.