model
Type of resources
Available actions
Topics
Keywords
Contact for the resource
Provided by
Years
Formats
Representation types
Update frequencies
status
Resolution
-

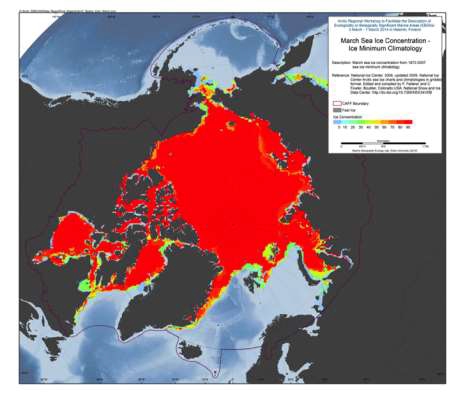
The U.S. National Ice Center (NIC) is an inter-agency sea ice analysis and forecasting center comprised of the Department of Commerce/NOAA, the Department of Defense/U.S. Navy, and the Department of Homeland Security/U.S. Coast Guard components. Since 1972, NIC has produced Arctic and Antarctic sea ice charts. This data set is comprised of Arctic sea ice concentration climatology derived from the NIC weekly or biweekly operational ice-chart time series. The charts used in the climatology are from 1972 through 2007; and the monthly climatology products are median, maximum, minimum, first quartile, and third quartile concentrations, as well as frequency of occurrence of ice at any concentration for the entire period of record as well as for 10-year and 5-year periods. NIC charts are produced through the analyses of available in situ, remote sensing, and model data sources. They are generated primarily for mission planning and safety of navigation. NIC charts generally show more ice than do passive microwave derived sea ice concentrations, particularly in the summer when passive microwave algorithms tend to underestimate ice concentration. The record of sea ice concentration from the NIC series is believed to be more accurate than that from passive microwave sensors, especially from the mid-1990s on (see references at the end of this documentation), but it lacks the consistency of some passive microwave time series. Source: <a href="http://nsidc.org/data/G02172" target="_blank">NSIDC</a> Reference: National Ice Center. 2006, updated 2009. National Ice Center Arctic sea ice charts and climatologies in gridded format. Edited and compiled by F. Fetterer and C. Fowler. Boulder, Colorado USA: National Snow and Ice Data Center. Source: <a href="http://nsidc.org/data/G02172" target="_blank">NSIDC</a>
-

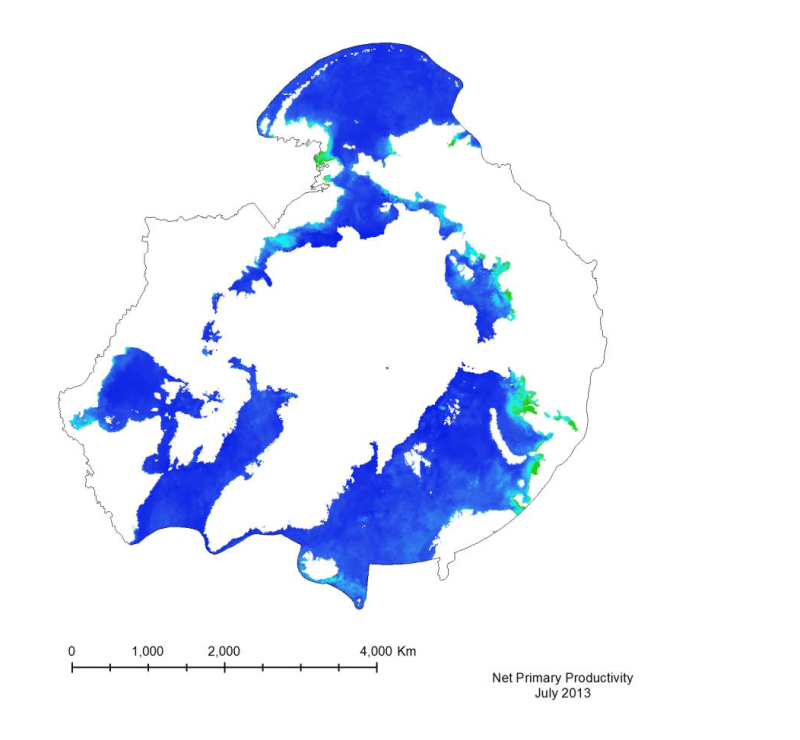
Marine primary productivity is not available from the NASA Ocean Color website. Currently the best product available for marine primary productivity is available through Oregon State University’s Ocean Productivity Project. A monthly global Net Primary Productivity product at 9 km spatial resolution has been selected for this analysis. The algorithm used to create the primary productivity is a Vertically Generalized Production Model (VGPM) created by Behrenfeld and Falkowski (1997). It is a “chlorophyll-based” model that estimates net primary production from chlorophyll using a temperature-dependent description of chlorophyll photosynthetic efficiency (O’Malley 2010). Inputs to the function are chlorophyll, available light, and photosynthetic efficiency.
-

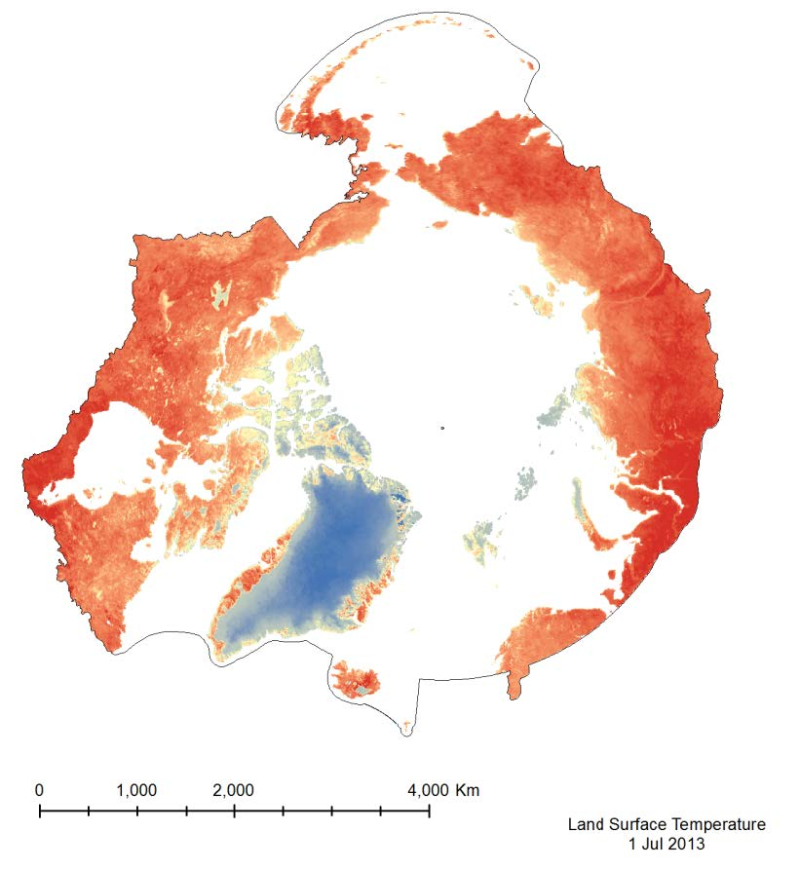
The MODIS Land Surface Temperature (LST) product provided is a monthlycomposite configured on a 0.05° Climate Model Grid (CMG). It includes both daytime andnighttime surface temperatures, taken at 11 um and 4 um (night). This product has beenscaled. To convert the raster values to a Kelvin temperature scale, multiply by a factor of 0.02.
-

LiDAR Derived Digital Elevation Models available at a 1m resolution in New Brunswick Stereographic Double Projection (NBSDP). LiDAR Derived Digital Elevation Models and Digital Surface Models available at 1m or 2m resolutions from NRCAN in Universal Transverse Mercator (UTM).
-

A digital terrain model (DTM) is a digital representation of elevations throughout the Province. DTM files contain elevation mass points, check points, spot heights and random densified points. The spacing between the elevation points is approximately 70 metres and the absolute vertical accuracy of a single elevation point is approximately 2.5 metres. The elevations are expressed as metres above mean sea level.
-

The European Ground Motion Service (EGMS) is a component of the Copernicus Land Monitoring Service. EGMS provides consistent, regular, standardised, harmonised and reliable information regarding natural and anthropogenic ground motion phenomena over the Copernicus Participating States and across national borders, with millimetre accuracy. This layer is produced based on GNSS data from various sources, with the EUREF Densification network as the main entry point. After filtering and quality control, a total of 3770 stations are used to generate the GNSS model which contains average velocities in east, north and up directions displayed on a 50-km grid. The grid dimension is determined by the average distance between well-maintained GNSS stations over continental Europe. The GNSS model is distributed to users in a single comma-separated values file. Each cell of the model is associated to a value of vertical and horizontal velocity. The product covers the Copernicus Participating States (except for DROMs) and United Kingdom.
 Arctic SDI catalogue