 Arctic SDI catalogue
Geopackage
Type of resources
Available actions
Topics
Keywords
Contact for the resource
Provided by
Years
Formats
Scale
Resolution
-

[IS] Gagnasettið er unnið í samstarfi við Landbúnaðarháskóla Íslands og sýnir þau svæði á Íslandi þar sem er mest rykmengun. Fyrir frekari upplýsingar um gagnasettið er best að hafa samband við Náttúrufræðistofnun. WMS þjónusta: https://gis.natt.is/geoserver/wms WFS þjónusta: https://gis.natt.is/geoserver/wfs Nafn á gagnasetti: copernicus:rykt_hotspots [EN] This dataset was produced in collaboration with the Agricultural University of Iceland and shows the areas in Iceland with the highest levels of dust pollution. For further information about the dataset, please contact the Natural Science Institute of Iceland. WMS service: https://gis.natt.is/geoserver/wms WFS service: https://gis.natt.is/geoserver/wfs Dataset name: copernicus:rykt_hotspots
-

[IS] Staðsetningar borkjarna og borsvarfs í Borkjarnasafni Náttúrufræðistofununnar. Náttúrufræðistofnun hefur það hlutverk að varðveita borkjarna sem falla til við jarðboranir víða um land við framkvæmdir eða í rannsóknaskyni. Borkjarnar og borsvarf veita innsýn í þann hluta berggrunnsins sem ekki er sýnilegur á yfirborði jarðar og eru nauðsynleg gögn við jarðvísindalegar rannsóknir, hvort sem um ræðir grunnrannsóknir eða hagnýtar rannsóknir við undirbúning mannvirkjagerðar eða nýtingar náttúruauðlinda. Safnið geymdi í lok árs 2024 um 100 kílómetra af borkjörnum auk borsvarfs úr borholum sem samtals eru yfir 470 km að lengd. Telur gagnagrunnur safnsins nú tæplega 11 þúsund kassa af borkjörnum úr um 1.800 borholum, sem og um 5.000 bakka af borsvarfi úr um 2.300 borholum. Í safninu er einnig talsverður fjöldi sýna sem tekin hafa verið úr borkjörnum og varðveitt aðskilin frá meginhluta kjarnanna. WMS þjónusta: https://gis.natt.is/geoserver/wms WFS þjónusta: https://gis.natt.is/geoserver/wfs Nafn á gagnasetti: NATT:drillcore_wfs_export_2, NATT:cuttings_wfs_export_2 [EN] Locations of drill cores and cuttings in the Drill Core Library of Natural Science Institute of Iceland. The Drill Core Library (DCL) of the Natural Science Institute of Iceland comprises over 100 km of drill cores and large quantities of drill cuttings from scientific and applied research drilling throughout Iceland. Drill cores and drill cuttings enable us to examine those portions of the bedrock that are not exposed at the surface. They are essential sources of data for geoscientific research, both fundamental research and applied studies for construction or utilization of natural resources. The DCL includes cores from research drilling in Surtsey in 1979 and 2017, which shed remarkable light on the inner evolution of the island after the eruption, and a core from a 2 km-deep research borehole in drilled in Reyðarfjörður in 1978. The collection also includes a vast array of cores drilled in connection with the construction of tunnels and hydroelectric power plants and other research on energy resources. WMS service: https://gis.natt.is/geoserver/wms WFS service: https://gis.natt.is/geoserver/wfs Dataset name: NATT:drillcore_wfs_export_2, NATT:cuttings_wfs_export_2
-

Íslenska: Vetrarfuglatalningar eru ein lengsta samfellda vöktun sem stunduð hefur verið hér á landi og sú sem tekur til flestra fuglategunda. Frá upphafi hafa áhugamenn unnið þetta verk í sjálfboðavinnu og á annað hundrað manns taka þátt. Talningar fara fram á föstum dögum í kringum áramót. Markmið vetrarfuglatalninga er að safna upplýsingum um fjölda og dreifingu fugla að vetrarlagi. Talningar eru staðlaðar og nýtast til vöktunar einstakra stofna. Gögnin sýna þau svæði á Íslandi þar sem fuglar eru taldir á veturna og númersvæðanna sem eru talin. Sjá niðurstöður vetrarfuglatalninga: https://www.natt.is/is/vetrarfuglatalningar-nidurstodur English: Winter bird counts are one of the longest-running continuous monitoring efforts in Iceland and the one that covers the greatest number of bird species. From the beginning, this work has been carried out by volunteers, with around a hundred people participating. The counts take place on fixed dates around the New Year. The aim of the winter bird counts is to collect information on the number and distribution of birds during the winter. The counts are standardized and are used to monitor individual populations. The data show the areas in Iceland where birds are counted during the winter, as well as the numbered survey areas included in the counts.
-

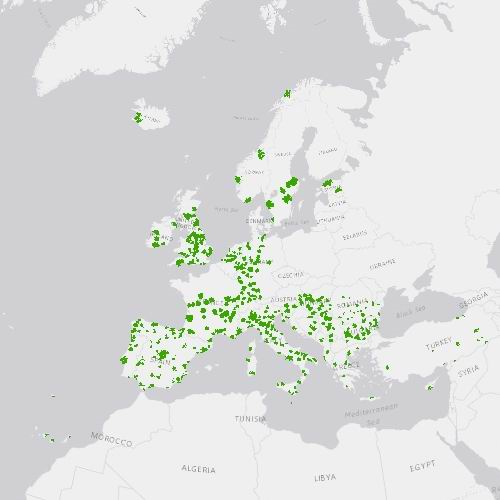
Small Woody Features are important vectors of biodiversity and provide information on fragmentation of habitats with a direct potential for restoration while also providing a link to hazard protection and green infrastructure, amongst others. VHR_IMAGE_2021 made available in the ESA Copernicus DWH was the main data source for the detection of small woody features identifiable within the given image resolution. The Small Woody Features layer contains woody linear and patchy elements but will not be further differentiated into trees, hedges, bushes and scrub. The spatial pattern shall be limited to linear structures and isolated patches on the basis of geometric characteristics. This product is a vector dataset distributed as OGC GeoPackage files, compliant with the EEA reference grid (100km x 100km).
-
The Urban Atlas provides pan-European comparable land use and land cover data for Functional Urban Areas (FUA) across EEA38 countries (EU, EFTA, Western Balkan countries as well as Türkiye) and United Kingdom. The Street Tree Layer (STL) is a separate layer from the Urban Atlas 2018 LU/LC layer produced within the level 1 urban mask for each FUA. It includes contiguous rows or a patches of trees covering 500 m² or more and with a minimum width of 10 meter over 'Artificial surfaces' (nomenclature class 1) inside FUA (i.e. rows of trees along the road network outside urban areas or forest adjacent to urban areas should not be included). Urban Atlas is a joint initiative of the European Commission Directorate-General for Regional and Urban Policy and the Directorate-General for Defence Industry and Space in the frame of the EU Copernicus programme, with the support of the European Space Agency and the European Environment Agency.
-

[IS] Vetrarfuglatalningar eru ein lengsta samfellda vöktun sem stunduð hefur verið hér á landi og sú sem tekur til flestra fuglategunda. Frá upphafi hafa áhugamenn unnið þetta verk í sjálfboðavinnu og á annað hundrað manns taka þátt. Talningar fara fram á föstum dögum í kringum áramót. Markmið vetrarfuglatalninga er að safna upplýsingum um fjölda og dreifingu fugla að vetrarlagi. Talningar eru staðlaðar og nýtast til vöktunar einstakra stofna. Sjá niðurstöður vetrarfuglatalninga: https://www.natt.is/is/vetrarfuglatalningar-nidurstodur [EN] Winter bird counts are one of the longest-running continuous monitoring efforts in Iceland and the one that covers the greatest number of bird species. From the beginning, this work has been carried out by volunteers, with around a hundred people participating. The counts take place on fixed dates around the New Year. The aim of the winter bird counts is to collect information on the number and distribution of birds during the winter. The counts are standardized and are used to monitor individual populations. See the results of the winter bird counts: https://www.natt.is/is/vetrarfuglatalningar-nidurstodur
-

[IS] Gagnasettið sýnir staðsetningar botndýra sem hafa rannsökuð við íslandsstrendur. Innan íslenskrar efnahagslögsögu eru þekktar rúmlega 2.500 tegundir sjávardýra, en vísast eru þær umtalsvert fleiri. Tegundafjölbreytni hinna ýmsu dýrafylkinga á Íslandsmiðum er afar misvel þekkt en fastlega má gera ráð fyrir að hlutföllin séu svipuð og á heimsvísu. Upplýsingar um ýmsar tegundir sjávardýra á Íslandsmiðum eru á vefsíðum um dýrahópa, sjá: https://www.natt.is/is/leit-i-biota?kingdom_group.keyword=%2522D%25C3%25BDr%20%2528Animalia%2529%2522 [EN] The dataset shows the locations of benthic invertebrates that have been studied along the coasts of Iceland. Over 2,500 marine animal species have been found in Iceland’s exclusive economic zone, but there are certainly many more. Species diversity within some animal phyla in Icelandic waters is still poorly understood. Presumably, however, species fall under different phyla in similar proportions as elsewhere in the world. Information on marine animal species in Icelandic waters can be found on animal fact sheets on the NSII website.see: https://www.natt.is/is/leit-i-biota?kingdom_group.keyword=%2522D%25C3%25BDr%20%2528Animalia%2529%2522
-

[IS] Gagnasettið sýnir staðsetningar ýmissra vefmyndavéla fá nokkrum aðilum sem settar hafa verið upp til þess að fylgjast með eldgosum í kringjum Sundhnjúksgíga. WMS þjónusta: https://gis.natt.is/geoserver/wms WFS þjónusta: https://gis.natt.is/geoserver/wfs Nafn á gagnasetti: LMI_vektor:gos_Reykjanes_webcams [EN] The dataset shows the locations of various webcams from several operators that have been installed to monitor volcanic eruptions around Sundhnjúksgígar. WMS service: https://gis.natt.is/geoserver/wms WFS service: https://gis.natt.is/geoserver/wfs Dataset name: LMI_vektor:gos_Reykjanes_webcams
-

Gögnin sýna mörk þéttbýlisstaða samkvæmt skilgreiningu Hagstofunnar.
-
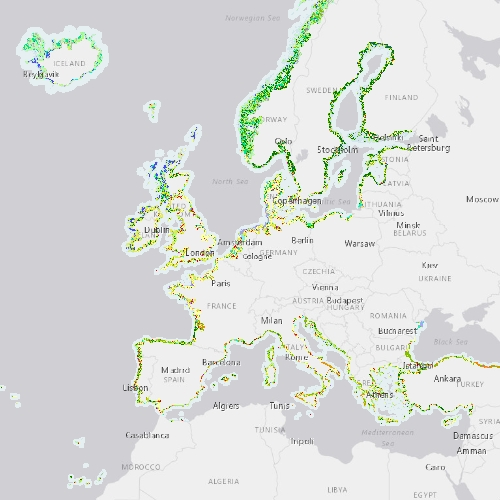
The Coastal Zones (CZ) LC/LU product for 2018 is providing a detailed Land Cover / Land Use (LC/ LU) dataset for areas along the coastline of the EEA38 countries and the United Kingdom, with reference year 2018 for the classification. This product monitors landscape dynamics in European coastal territory to an inland depth of 10 km with a total area of approximately 730,000 km², with all the relevant areas (estuaries, coastal lowlands, nature reserves). The production of the coastal zone layers was coordinated by the European Environment Agency (EEA) in the frame of the EU Copernicus programme, as part of the Copernicus Land Monitoring Service (CLMS) Local Component. The Coastal Zones product covers a buffer zone of coastline derived from EU-Hydro v1.1. Land Cover/Land Use (LC/LU) layer is extracted from Very High Resolution (VHR) satellite data and other available data. The class definitions follow the pre-defined nomenclature on the basis of Mapping and Assessment of Ecosystems and their Services (MAES) typology of ecosystems (Level 1 to Level 4) and CORINE Land Cover adapted to the specific characteristics of coastal zones. The classification provides 71 distinct thematic classes with a Minimum Mapping Unit (MMU) of 0.5 ha and a Minimum Mapping Width (MMW) of 10 m. The product is available for the 2012 and 2018 reference year including change mapping. This CZ dataset is distributed in vector format, in a single OGC GeoPackage SQLite file covering the area of interest.