Boreal ecosystems
Type of resources
Available actions
Topics
Keywords
Contact for the resource
Provided by
Formats
Representation types
Update frequencies
status
-

As part of a scientific assessment of critical habitat for boreal woodland caribou (Environment Canada 2011, see full reference in accompanying documentation), Environment Canada's Landscape Science and Technology Division was tasked with providing detailed anthropogenic disturbance mapping, across known caribou ranges, as of 2010. The attached dataset comprises the second 5-year update (first one in 2015) bringing the data up to 2020. The original disturbance mapping was based on 30-metre resolution Landsat-5 imagery from 2008-2010. Since then, anthropogenic disturbances within 51 caribou ranges across Canada were remapped every five years to create a nationally consistent, reliable and repeatable geospatial dataset that followed a common methodology. The ranges were defined by individual provinces and territories across Canada. The methods developed were focused on mapping disturbances at a specific point of time, and were not designed to identify the age of disturbances, which can be of particular interest for disturbances that can be considered non-permanent, for example cutblocks. The resultant datasets were used for a caribou resource selection function (habitat modeling) and to assess overall disturbance levels on each caribou ranges. As with the 2010 mapping project, anthropogenic disturbance was defined as any human-caused disturbance to the natural landscape that could be visually identified from Landsat 30-metre multi-band imagery at a viewing scale of 1:50,000. The same concept was followed for the 2015 and 2020 disturbance mapping and any additional disturbance features that were observed since the original mapping date, were added. The 2015 database was used as a starting point for the 2020 database. Unlike the previous iteration, features were not removed in the mapping process which was a decision made in the name of time. Interpretation was carried out based on the most recent cloud free imagery available up to mid fall for a given year. Each disturbance feature type was represented in the database by a line or polygon depending on their geometric description. Linear disturbances included: roads, railways, powerlines, seismic exploration lines, pipelines, dams, air strips, as well as unknown features. Polygonal disturbances included: cutblocks, harvest (added in 2020), mines, built-up areas, well sites, agriculture, oil and gas facilities, as well as unknown features. For each type of anthropogenic disturbance, a clear description was established (see Appendix 7.2 of the science assessment) to maintain consistency in identifying the various disturbances in the imagery by the different interpreters. Features were only digitized if they were clearly visible in the Landsat imagery at the prescribed viewing scale. In comparison to the previous mapping protocol, one enhancement to the mapping process in 2020 was the addition of CFS harvest polygons (Ref: NRCan-CFS NTEMS; Wulder 2020) into the database prior to interpretation. This considerably reduced the digitizing time for polygons and accelerated the data collection process. The CFS harvest polygons were checked before inclusion, removing some which had been generated erroneously in their process. A 2nd interpreter quality-control phase was carried out to ensure high quality, complete and consistent data collection. Subsequently, the vector data of individual linear and polygonal disturbances were buffered by a 500-metre radius, representing their extended zone of impact upon boreal caribou herds. Additionally, forest fire polygons for the past forty years (CNFDB 1981-2020) were merged into the buffered anthropogenic footprint in order to create an overall disturbance footprint. These buffered datasets were used in the calculation of range disturbance levels and for integrated risk assessment analysis.
-

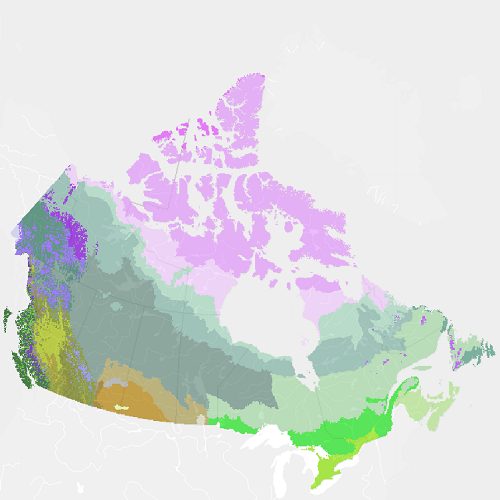
"Vegetation Zones of Canada: a Biogeoclimatic Perspective" maps Canadian geography in relation to gradients of regional climate, as expressed by potential vegetation on zonal sites. Compared to previous similar national-scale products, "Vegetation Zones of Canada" benefits from the work of provincial and territorial ecological classification programs over the last 30+ years, incorporating this regional knowledge of ecologically significant climatic gradients into a harmonized national map. This new map, reflecting vegetation and soils adapted to climates prior to approximately 1960, can serve as a broad-scale (approximately 1:5 M to 1:10 M) geospatial reference for monitoring and modeling effects of climate changes on Canadian ecosystems. "Vegetation Zones of Canada: a Biogeoclimatic Perspective" employs a two-level hierarchical legend. Level 1 vegetation zones reflect the global-scale latitudinal gradient of annual net radiation, as well as the effects of high elevation and west to east climatic and biogeographic variation across Canada. Within the level 1 vegetation zones, level 2 zones distinguish finer scale variation in zonal vegetation, especially in response to elevational and arctic climatic gradients, climate-related floristics and physiognomic diversity in the Great Plains, and maritime climatic influences on the east and west coasts. Thirty-three level 2 vegetation zones are recognized: High Arctic Sparse Tundra Mid-Arctic Dwarf Shrub Tundra Low Arctic Shrub Tundra Subarctic Alpine Tundra Western Boreal Alpine Tundra Cordilleran Alpine Tundra Pacific Alpine Tundra Eastern Alpine Tundra Subarctic Woodland-Tundra Northern Boreal Woodland Northwestern Boreal Forest West-Central Boreal Forest Eastern Boreal Forest Atlantic Maritime Heathland Pacific Maritime Rainforest Pacific Dry Forest Pacific Montane Forest Cordilleran Subboreal Forest Cordilleran Montane Forest Cordilleran Rainforest Cordilleran Dry Forest Eastern Temperate Mixed Forest Eastern Temperate Deciduous Forest Acadian Temperate Forest Rocky Mountains Foothills Parkland Great Plains Parkland Intermontane Shrub-Steppe Rocky Mountains Foothills Fescue Grassland Great Plains Fescue Grassland Great Plains Mixedgrass Grassland Central Tallgrass Grassland Cypress Hills Glaciers Please cite this dataset as: Baldwin, K.; Allen, L.; Basquill, S.; Chapman, K.; Downing, D.; Flynn, N.; MacKenzie, W.; Major, M.; Meades, W.; Meidinger, D.; Morneau, C.; Saucier, J-P.; Thorpe, J.; Uhlig, P. 2019. Vegetation Zones of Canada: a Biogeoclimatic Perspective. [Map] Scale 1:5,000,000. Natural Resources Canada, Canadian Forest Service. Great Lake Forestry Center, Sault Ste. Marie, ON, Canada.
-

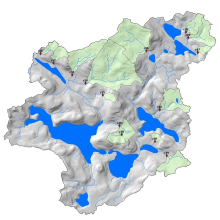
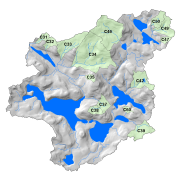
The Turkey Lakes Watershed (TLW) Study was established in 1979 by several federal government departments (Natural Resources Canada, Environment and Climate Change Canada, and Fisheries and Oceans Canada) to study the impacts of acid rain on aquatic and forest ecosystems but has since expanded to include other research on toxic contaminants, forest harvesting, habitat modification, and climate change. The TLW is a mixed hardwood forest with a 10.5 km squared area in the Canada Shield that drains into Lake Superior, and has been the focus of many interdisciplinary, whole-ecosystem studies on environmental issues. Benthic invertebrates, or insects found at the bottom of waterbodies, can be key indicators of stream health and play important roles in nutrient cycling and the food chain. In 1995, a project within the TLW aimed to evaluate how stream ecosystems respond to tree harvesting, which involved long-term surveys of benthic invertebrate communities pre- and post-harvest. Three stream catchments (c31, c33, c34) were harvested at different intensities in the summer of 1997 and were compared to multiple undisturbed catchments. Alongside the invertebrate data, corresponding stream habitat surveys, streamside litterfall traps, leaf decomposition, deposition of stream particulate matter, and standing sediment bedload data was collected during the same period. The data was collected from 1995-2009 by researchers at the Canadian Forest Service (Great Lakes Forestry Centre). This dataset is a rare and valuable resource because there are very few existing long-term datasets of benthic invertebrates from the same locations, and because this dataset is integrated with other biological and chemical datasets within the broader TLW database stored at the Open Government data repository. For an overview of other types of data available from the TLW, see https://doi.org/10.1002/hyp.14109, and for a complete list of publications that have been produced from data collected at this site, see https://www.canada.ca/en/environment-climate-change/services/turkey-lakes-watershed-study/publications.html.
-

This dataset contains annual mean stream water flow/discharge data derived from daily means for headwater streams draining forested hillslopes measured at stream catchments C31, C32, C33, C34, C35, C37, C38, C39, C42, C46, C47, C49, and C50 in the Turkey Lakes Watershed, approximately 60 km northwest of Sault Ste. Marie, Ontario, Canada. This data set is recorded as annual mean flow by calendar year (January-December in litres per second), annual mean flow by water year (October to September in litres per second), and annual number of zero flow days by water year. Daily mean flows that were used to derive this data set were recorded from 1981-2012 by the Great Lakes Forestry Centre, and are reported for 1981-2011 due to some inaccuracies throughout the 2012 data. Hydrological gauging stations employ "flow-control" 120 degree V-notch weirs (catchments 31, 33, 34, 37, 39, 42, 46, and 47), 90 degree V-notch weirs (catchments 32, 35, and 49), and 60 degrees V-notch weirs (catchment 38) to facilitate monitoring of stream discharge. Water "stage" or depth within the structure (e.g. in the pool behind the weir notch) is automatically and continuously recorded by chart recorders (Leupold & Stevens A-71 SE Water Level Recorder) from 1981-2003. Capacitance rods (Trutrack WT-HR 1000) installed in stilling wells replaced the chart recorders over the period of 2002 to 2003 and were used until 2012. The capacitance rods logged data at 1 hour intervals for the majority of their use and then averaged to a daily rate. Manual stage measurements have been taken intermittently when synoptic water chemistry samples were taken throughout the years. Stage data are then converted to a continuous record of flow using the relationship between stage and discharge measurements.
-

This dataset contains average concentrations of water chemistry collected from stream catchments C31, C32, C33, C34, C35, C37, C38, C39, C42, C46, C47, C49, and C50 in the Turkey Lakes Watershed, approximately 60 km northwest of Sault Ste. Marie, Ontario, Canada. These are average concentrations recorded from 1981-2018 in milligrams per litre (mg/L) of major ions (Ca, Mg, K, Na, SO4, Cl, NO3-N, NH4-N) and some nutrients (TP, TN) collected by the Great Lakes Forestry Centre. Samples are collected according to variable schedules such that frequency generally increased with increasing stream flow, (sampling period was shortest during spring runoff, 1-3 days, and longest during winter, 2-3 weeks). Sampling was accomplished by rinsing an appropriately cleaned 2-litre, polyethylene bottle at least 3 times with stream water followed by immersion to collect the final sample. Care was taken to not disturb the stream sediments throughout the sampling procedure. pH and conductivity testing is completed right after sampling. Other chemical analyses are completed by the Great Lakes Forestry Centre in Sault Ste. Marie within 2 weeks of collection. Sample integrity was maintained through storage in the dark at 4 degrees Celsius and analyzed at room temperature.
-

The Turkey Lakes Watershed Study (TLWS) was established in 1979 and is one of the longest running ecosystem studies in Canada. It is 10.5 km2 and is located approximately 60 km north of Sault Ste. Marie, Ontario at the northern margin of the Great Lakes – St. Lawrence forest region. Researchers from Natural Resources Canada, Environment Canada and Fisheries and Oceans Canada established the research watershed to evaluate the impacts of acid rain on terrestrial and aquatic ecosystems. Since its inception, the study has taken a multi-disciplinary approach to investigating the processes that govern ecosystem responses to natural and anthropogenic perturbations. The goal of the TLWS is to obtain a whole-ecosystem analysis of the biogeochemical processes operating at the site. This permits system models to be developed and validated. The holistic approach that has been adopted from the outset allows research to evolve and expand from its original acidification focus to include evaluations of other environmental issues. Partnerships and collaboration are part of the founding principles behind the TLWS to improve our ability to measure, model and predict effects of human activity on ecosystem function. Over time, research and monitoring have expanded to explore the effects of forest harvesting, climate change, aquatic habitat manipulations and toxic contaminants. Advancements of our scientific knowledge of forest ecosystems and a baseline of long-term environmental data enables study results to inform Canadian governments on environmental policy and forest management legislation. Hydrological, meteorological, and vegetation data collected by scientists at the Great Lakes Forestry Centre is included in this directory. Experimental sites and scientific investigations in the TLW are summarized in the compendium document. Visit our website at:
 Arctic SDI catalogue