 Arctic SDI catalogue
Climatology
Type of resources
Topics
Keywords
Contact for the resource
Provided by
Formats
Representation types
Update frequencies
status
-

Description: Seasonal climatologies (temperature, salinity, and sigma-t) of the Northeast Pacific Ocean were computed from historical observations including all available conductivity-temperature-depth (CTD), bottle, expendable bathy-thermograph (XBT), and Argo data in NOAA (http://www.argo.ucsd.edu/), Marine Environmental Data Service (MEDS), and Institute of Ocean Sciences archives over 1980 to 2010 period in spatial resolution ranging from approximately 100m to 70km. Methods: Calculations, including smooth and interpolation, were carried out in sixty-five subregions and up to fifty-two vertical levels from surface to 5000m. Seasonal averages were computed as the median of yearly seasonal values. Spring months were defined as April to June, summer months were defined as July to September, fall months were defined as October to December, and winter months were defined as January to March. Uncertainties: Uncertainties are introduced when quality controlled observational data are spatially interpolated to varying distances from the observation point. Climatological averages are calculated from these interpolated values.
-

Description: Night-time sea surface temperature (SST) was retrieved from the MODIS instrument on the Aqua satellite, with data distributed by the NASA Ocean Biology Processing Group, and averaged into monthly climatological composites. The data span the years 2003-2020; records were created at 1 km pixel resolution to be consistent with other satellite products. Methods: MODIS-Aqua night long-wave Sea Surface Temperature (SST) images were acquired from the NASA Ocean Biology Processing Group at processing Level-2 (version 2018), 1-km resolution, spanning the period 2003-01-01 to 2020-12-31. Image pixels were aligned and mapped to a regular grid using the SeaDAS program, retaining all pixels with a quality level of ‘1’ or lower, which is recommended for scientific analysis. The monthly mean value at all pixels was calculated for individual years, and used to produce maps of the monthly climatological mean and standard deviation of SST. Additionally, the number of occurrences of valid data at each pixel over the period of observation were calculated. Pixels with fewer than two occurrences over the entire period of observation were removed from these maps, and set to a NaN value in the tif files. A few small gaps between pixels (near the edges of individual images) were filled using the median value of surrounding pixels, provided there were greater than 4 values. Finally, all rasters were cropped to the Canadian Exclusive Economic Zone and assigned to the NAD83 geographic coordinate reference system (EPSG:4269), and have a final pixel resolution of approximately 0.01 degrees. The monthly mean, monthly standard deviation, and number of occurrences for all pixels are provided. Data Sources: NASA Ocean Biology Processing Group. (2017). MODIS-Aqua Level 2 Ocean Color Data Version R2018.0. NASA Ocean Biology Distributed Active Archive Center. https://doi.org/10.5067/AQUA/MODIS/L2/OC/2018 Uncertainties: Satellite values have been evaluated against global datasets, and datasets of samples in the Pacific region (see references). However, uncertainties are introduced when averaging together images over time as each pixel has a differing number of observations. Short-lived or spatially limited events may be missed.
-
Description: Seasonal mean primary production from the British Columbia continental margin model (BCCM) were averaged over the 1993 to 2020 period and depth-integrated to create seasonal mean climatology of the Canadian Pacific Exclusive Economic Zone. Methods: Total primary production is the sum of diatoms and flagellates production. Spring months were defined as April to June, summer months were defined as July to September, fall months were defined as October to December, and winter months were defined as January to March. The data available here contain a raster layer of seasonal depth-integrated primary production climatology for the Canadian Pacific Exclusive Economic Zone at 3 km spatial resolution. Uncertainties: Model results have been extensively evaluated against observations (e.g. altimetry, CTD and nutrient profiles, observed geostrophic currents), which showed the model can reproduce with reasonable accuracy the main oceanographic features of the region including salient features of the seasonal cycle and the vertical and cross-shore gradient of water properties. However, the model resolution is too coarse to allow for an adequate representation of inlets, nearshore areas, and the Strait of Georgia.
-

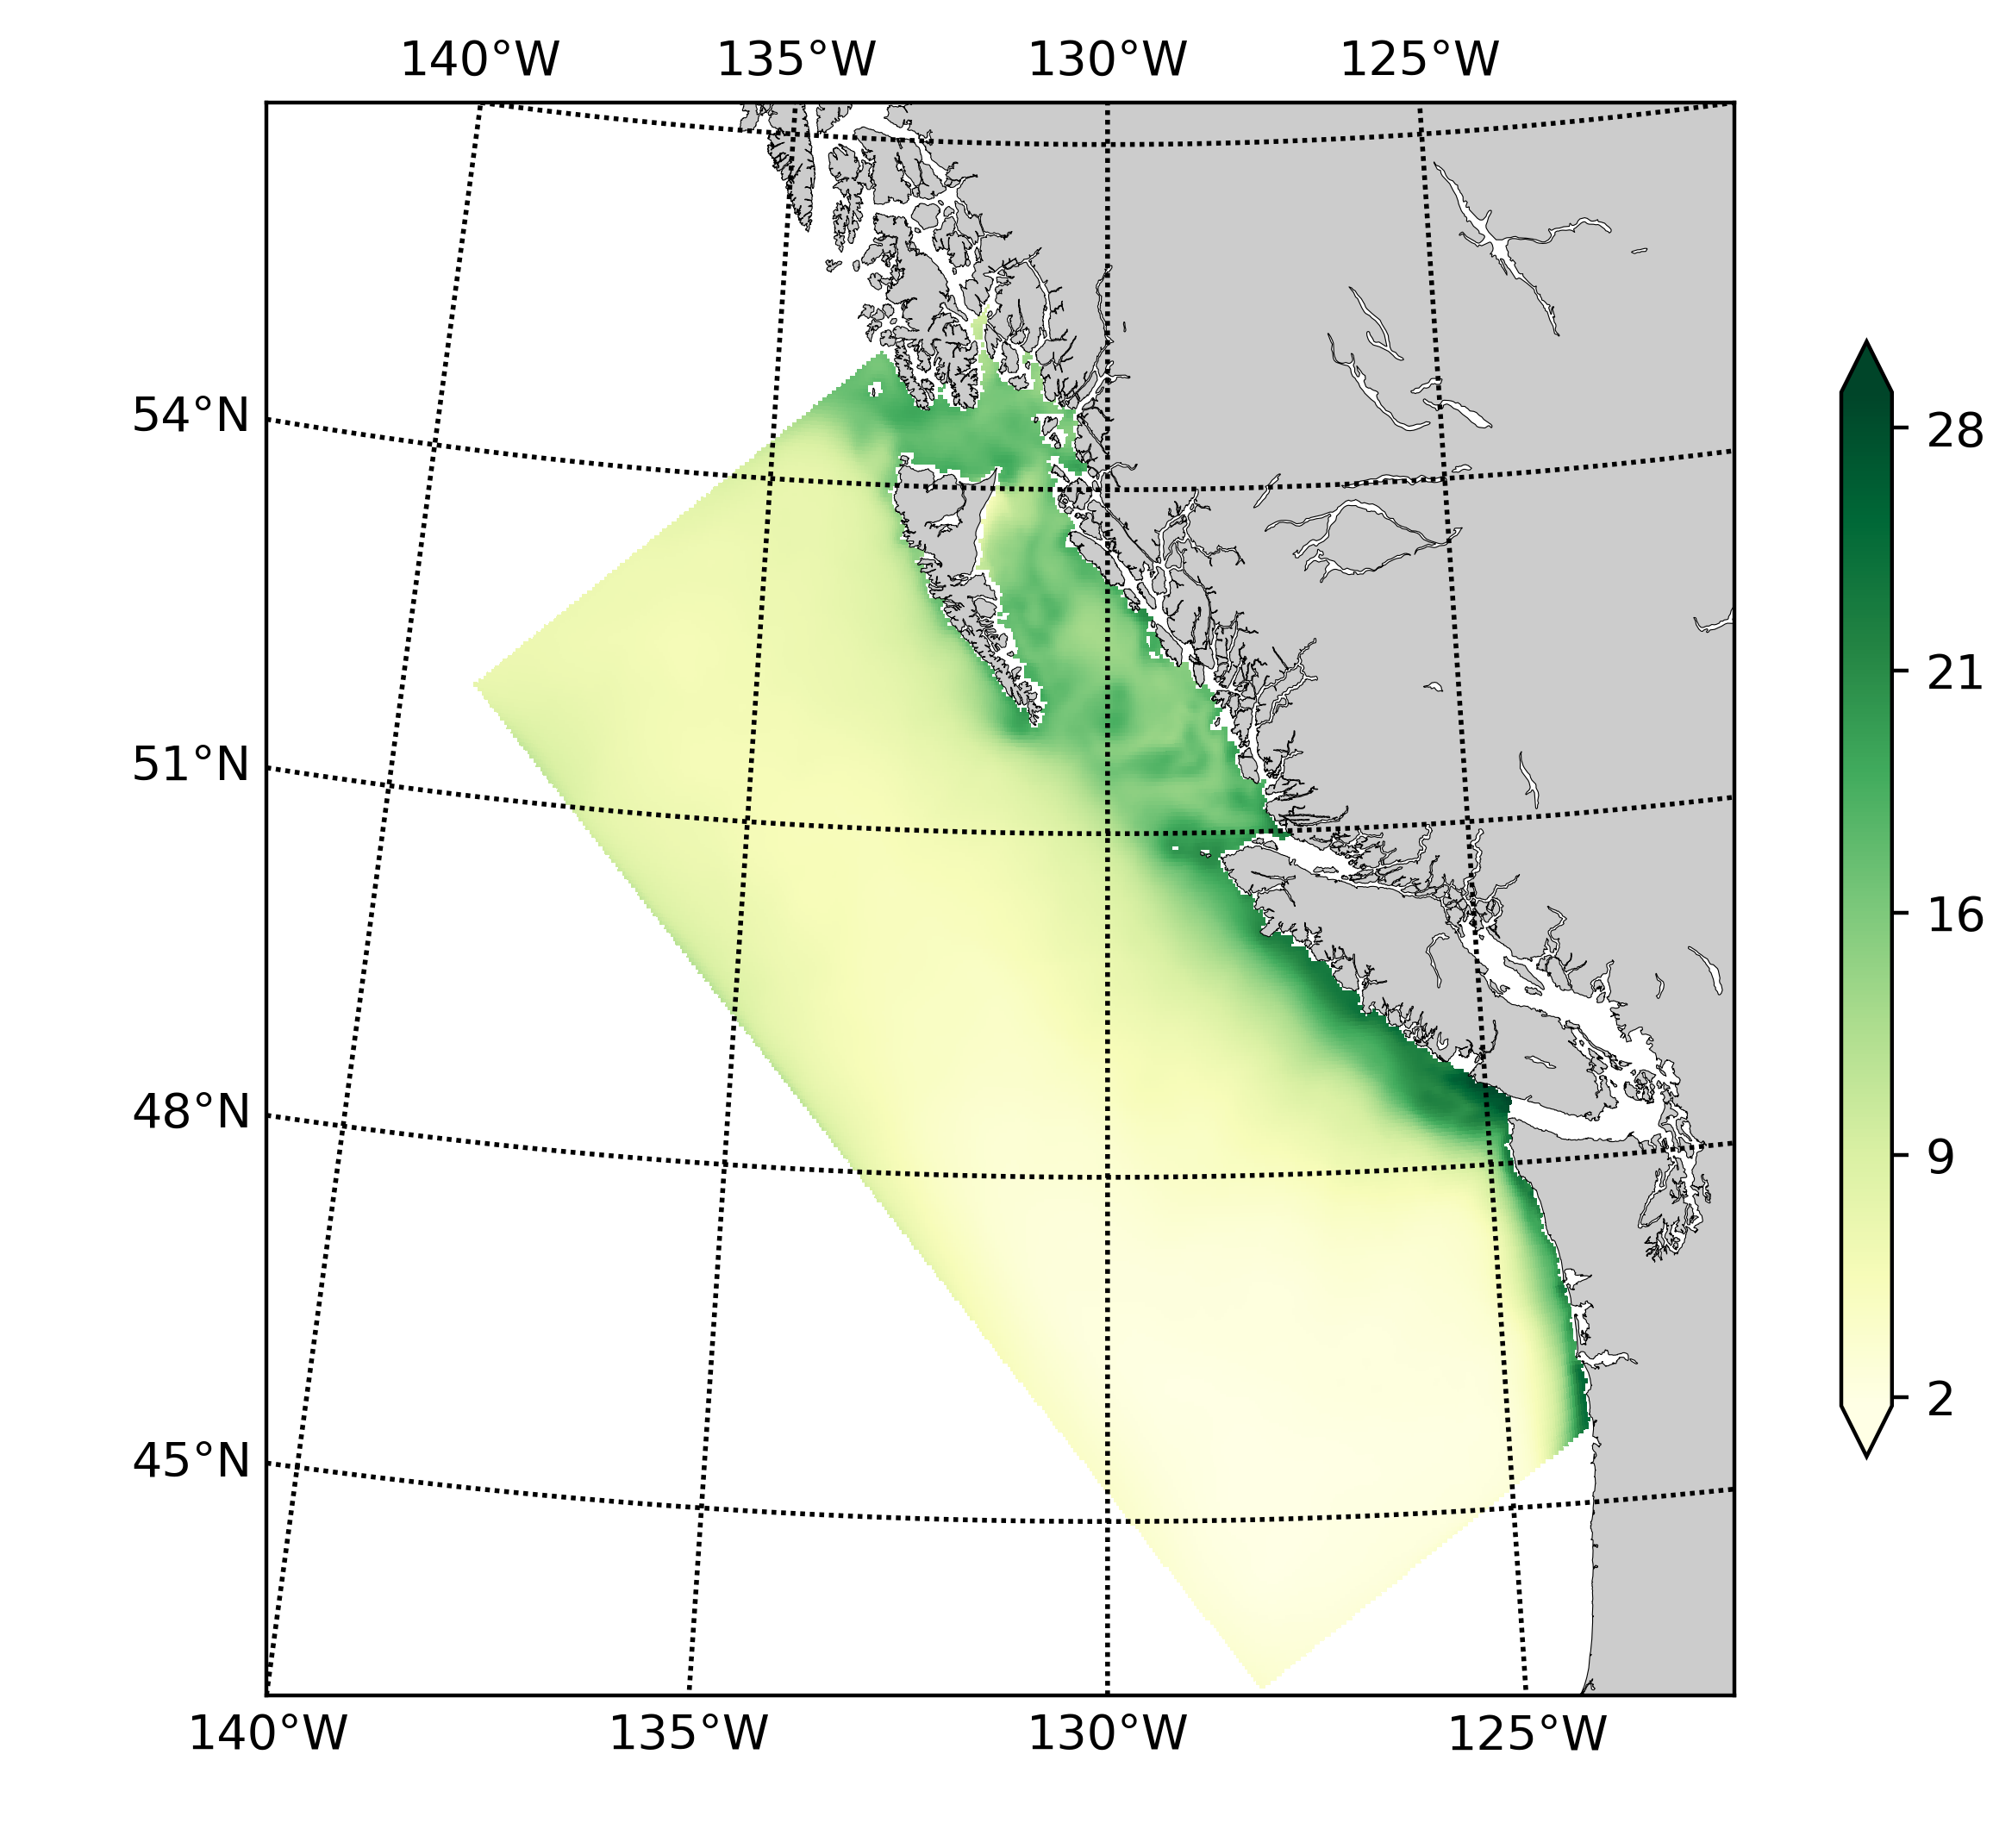
Description: Seasonal mean temperature from the British Columbia continental margin model (BCCM) were averaged over the 1981 to 2010 period to create seasonal mean climatology of the Canadian Pacific Exclusive Economic Zone. Methods: Temperatures at up to forty-six linearly interpolated vertical levels from surface to 2400 m and at the sea bottom are included. Spring months were defined as April to June, summer months were defined as July to September, fall months were defined as October to December, and winter months were defined as January to March. The data available here contain raster layers of seasonal temperature climatology for the Canadian Pacific Exclusive Economic Zone at 3 km spatial resolution and 47 vertical levels. Uncertainties: Model results have been extensively evaluated against observations (e.g. altimetry, CTD and nutrient profiles, observed geostrophic currents), which showed the model can reproduce with reasonable accuracy the main oceanographic features of the region including salient features of the seasonal cycle and the vertical and cross-shore gradient of water properties. However, the model resolution is too coarse to allow for an adequate representation of inlets, nearshore areas, and the Strait of Georgia.
-

Description: Seasonal mean total phytoplankton at the surface from the British Columbia continental margin model (BCCM) were averaged over the 1981 to 2010 period to create seasonal mean surface climatology of the Canadian Pacific Exclusive Economic Zone. Methods: Total phytoplankton is the sum of diatoms and flagellates concentration. Spring months were defined as April to June, summer months were defined as July to September, fall months were defined as October to December, and winter months were defined as January to March. The data available here contain a raster layer of seasonal surface phytoplankton climatology for the Canadian Pacific Exclusive Economic Zone at 3 km spatial resolution. Uncertainties: Model results have been extensively evaluated against observations (e.g. altimetry, CTD and nutrient profiles, observed geostrophic currents), which showed the model can reproduce with reasonable accuracy the main oceanographic features of the region including salient features of the seasonal cycle and the vertical and cross-shore gradient of water properties. However, the model resolution is too coarse to allow for an adequate representation of inlets, nearshore areas, and the Strait of Georgia.
-
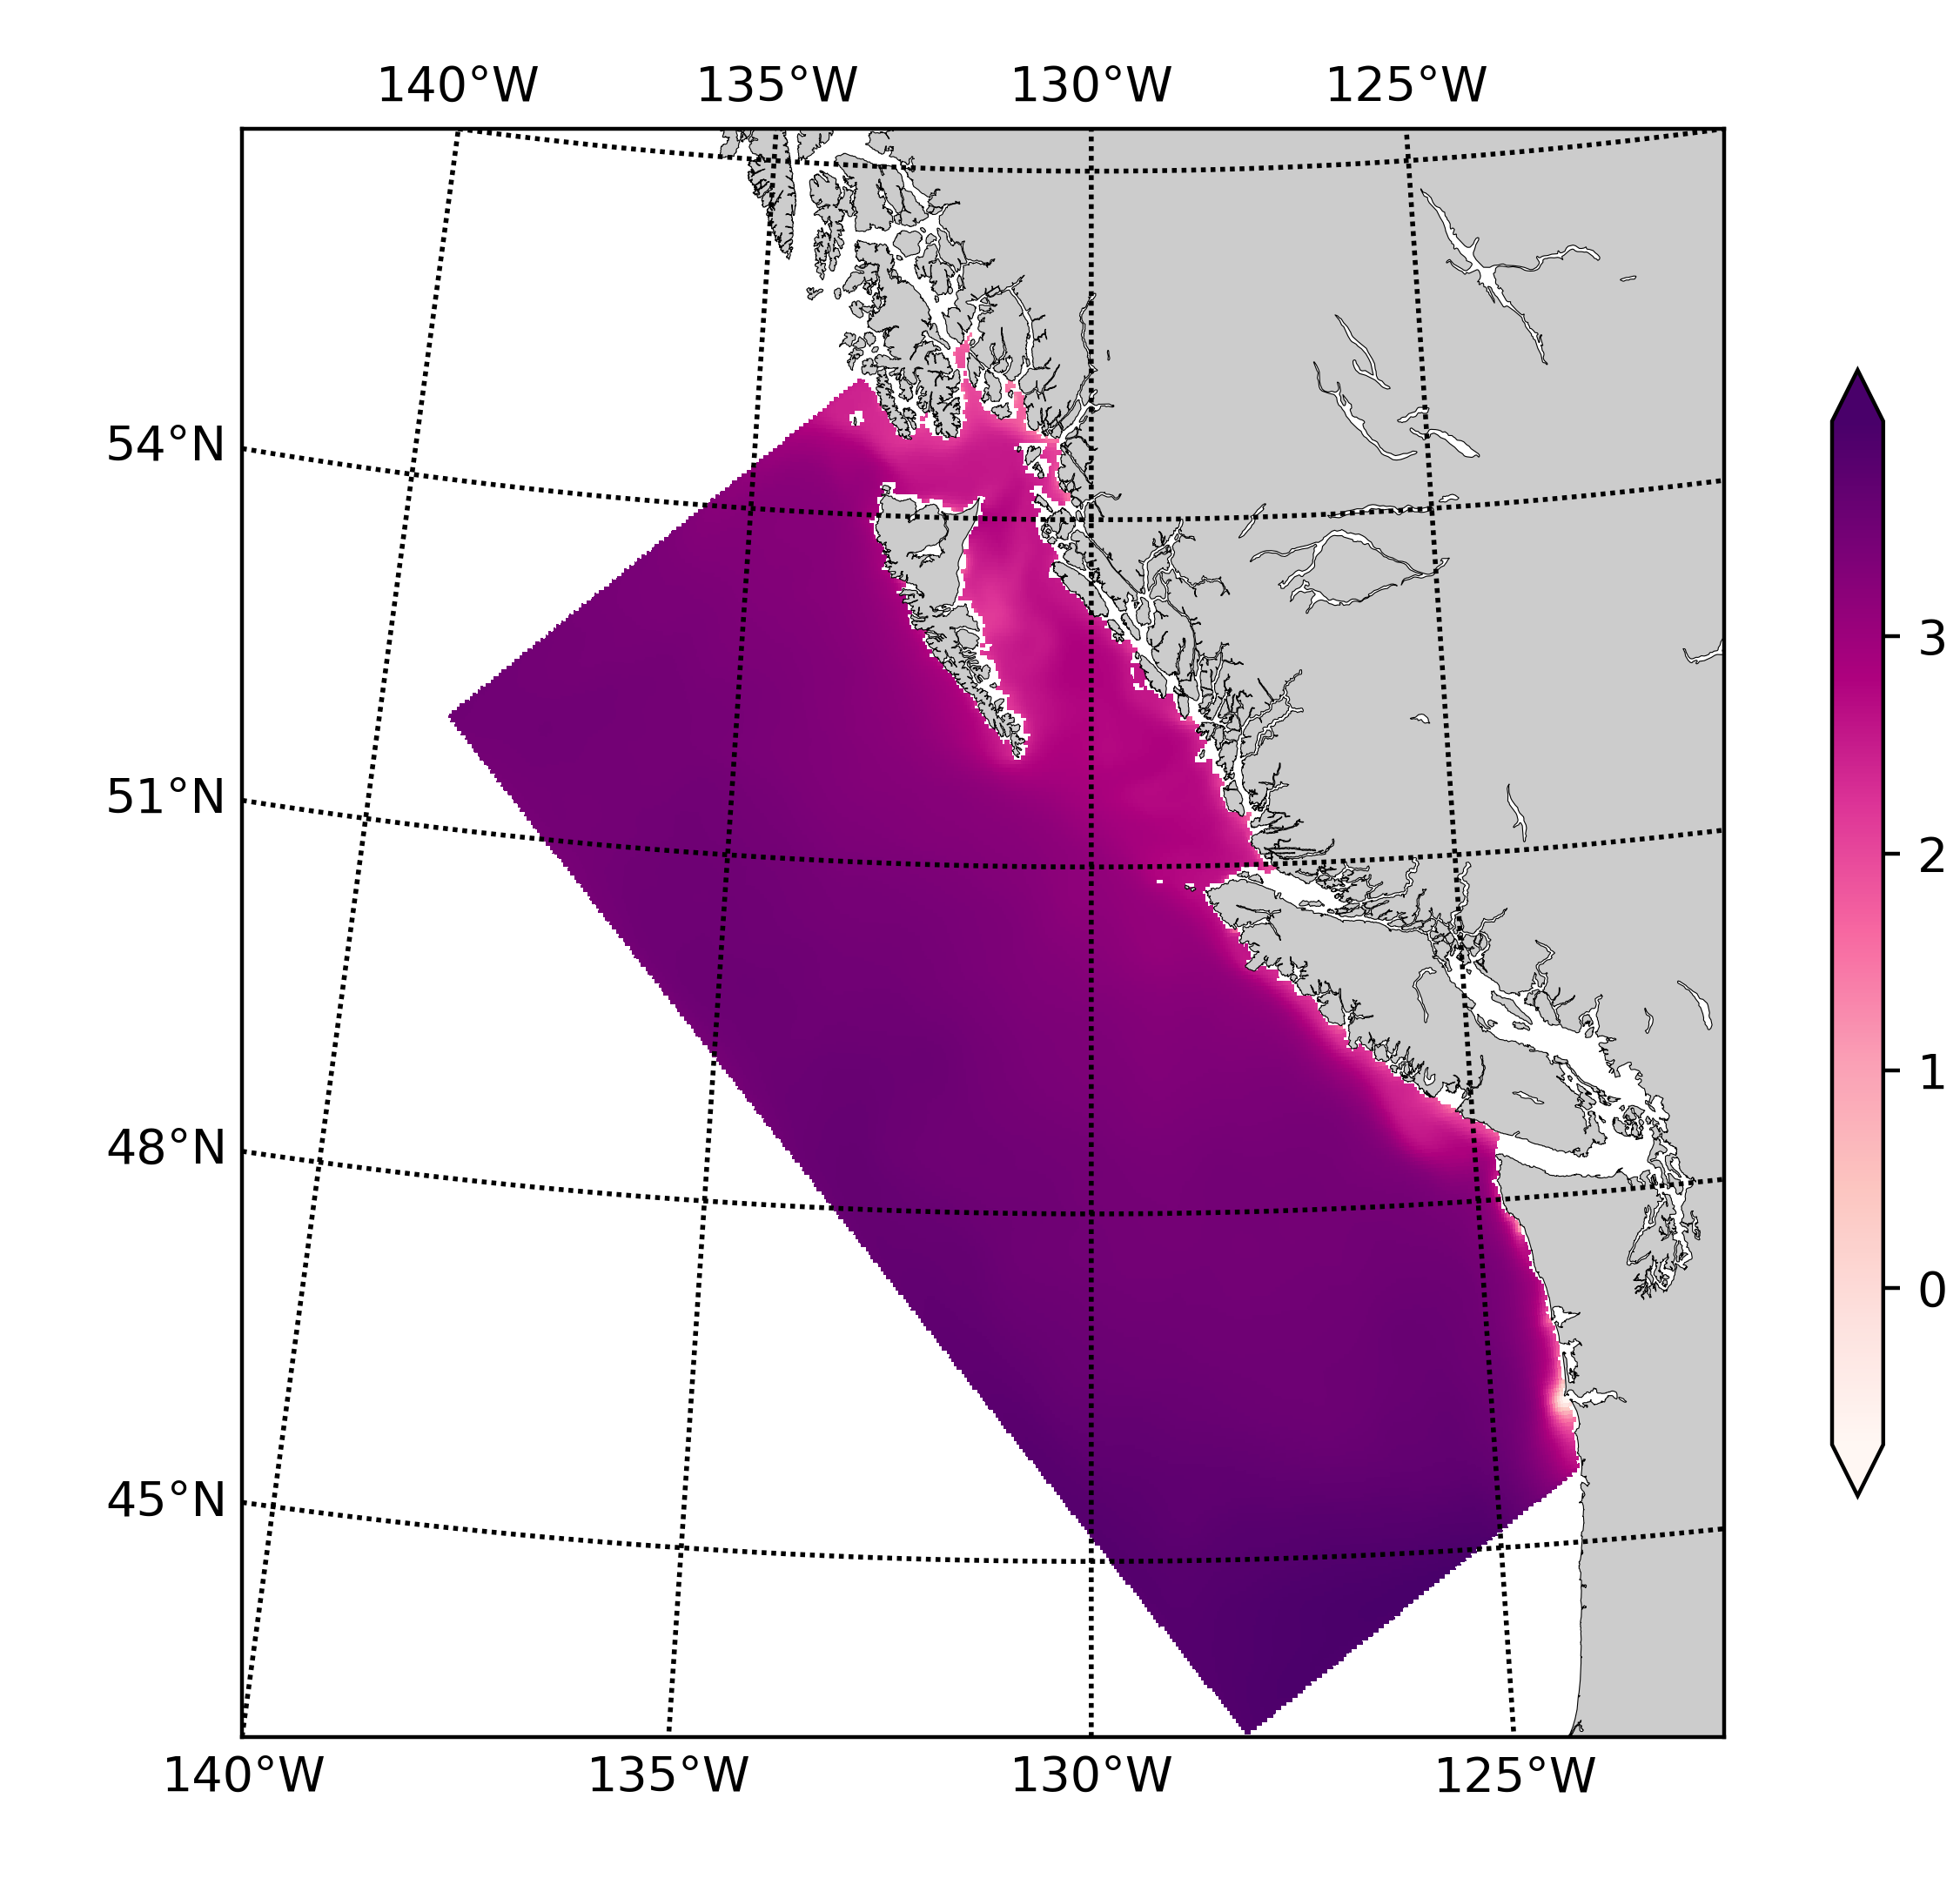
Description: Seasonal mean aragonite saturation state from the British Columbia continental margin model (BCCM) were averaged over the 1993 to 2020 period to create seasonal mean climatology of the Canadian Pacific Exclusive Economic Zone. Methods: Aragonite saturation states at up to forty-six linearly interpolated vertical levels from surface to 2400 m and at the sea bottom are included. Spring months were defined as April to June, summer months were defined as July to September, fall months were defined as October to December, and winter months were defined as January to March. The data available here contain raster layers of seasonal aragonite saturation state climatology for the Canadian Pacific Exclusive Economic Zone at 3 km spatial resolution and 47 vertical levels. Uncertainties: Model results have been extensively evaluated against observations (e.g. altimetry, CTD and nutrient profiles, observed geostrophic currents), which showed the model can reproduce with reasonable accuracy the main oceanographic features of the region including salient features of the seasonal cycle and the vertical and cross-shore gradient of water properties. However, the model resolution is too coarse to allow for an adequate representation of inlets, nearshore areas, and the Strait of Georgia.
-
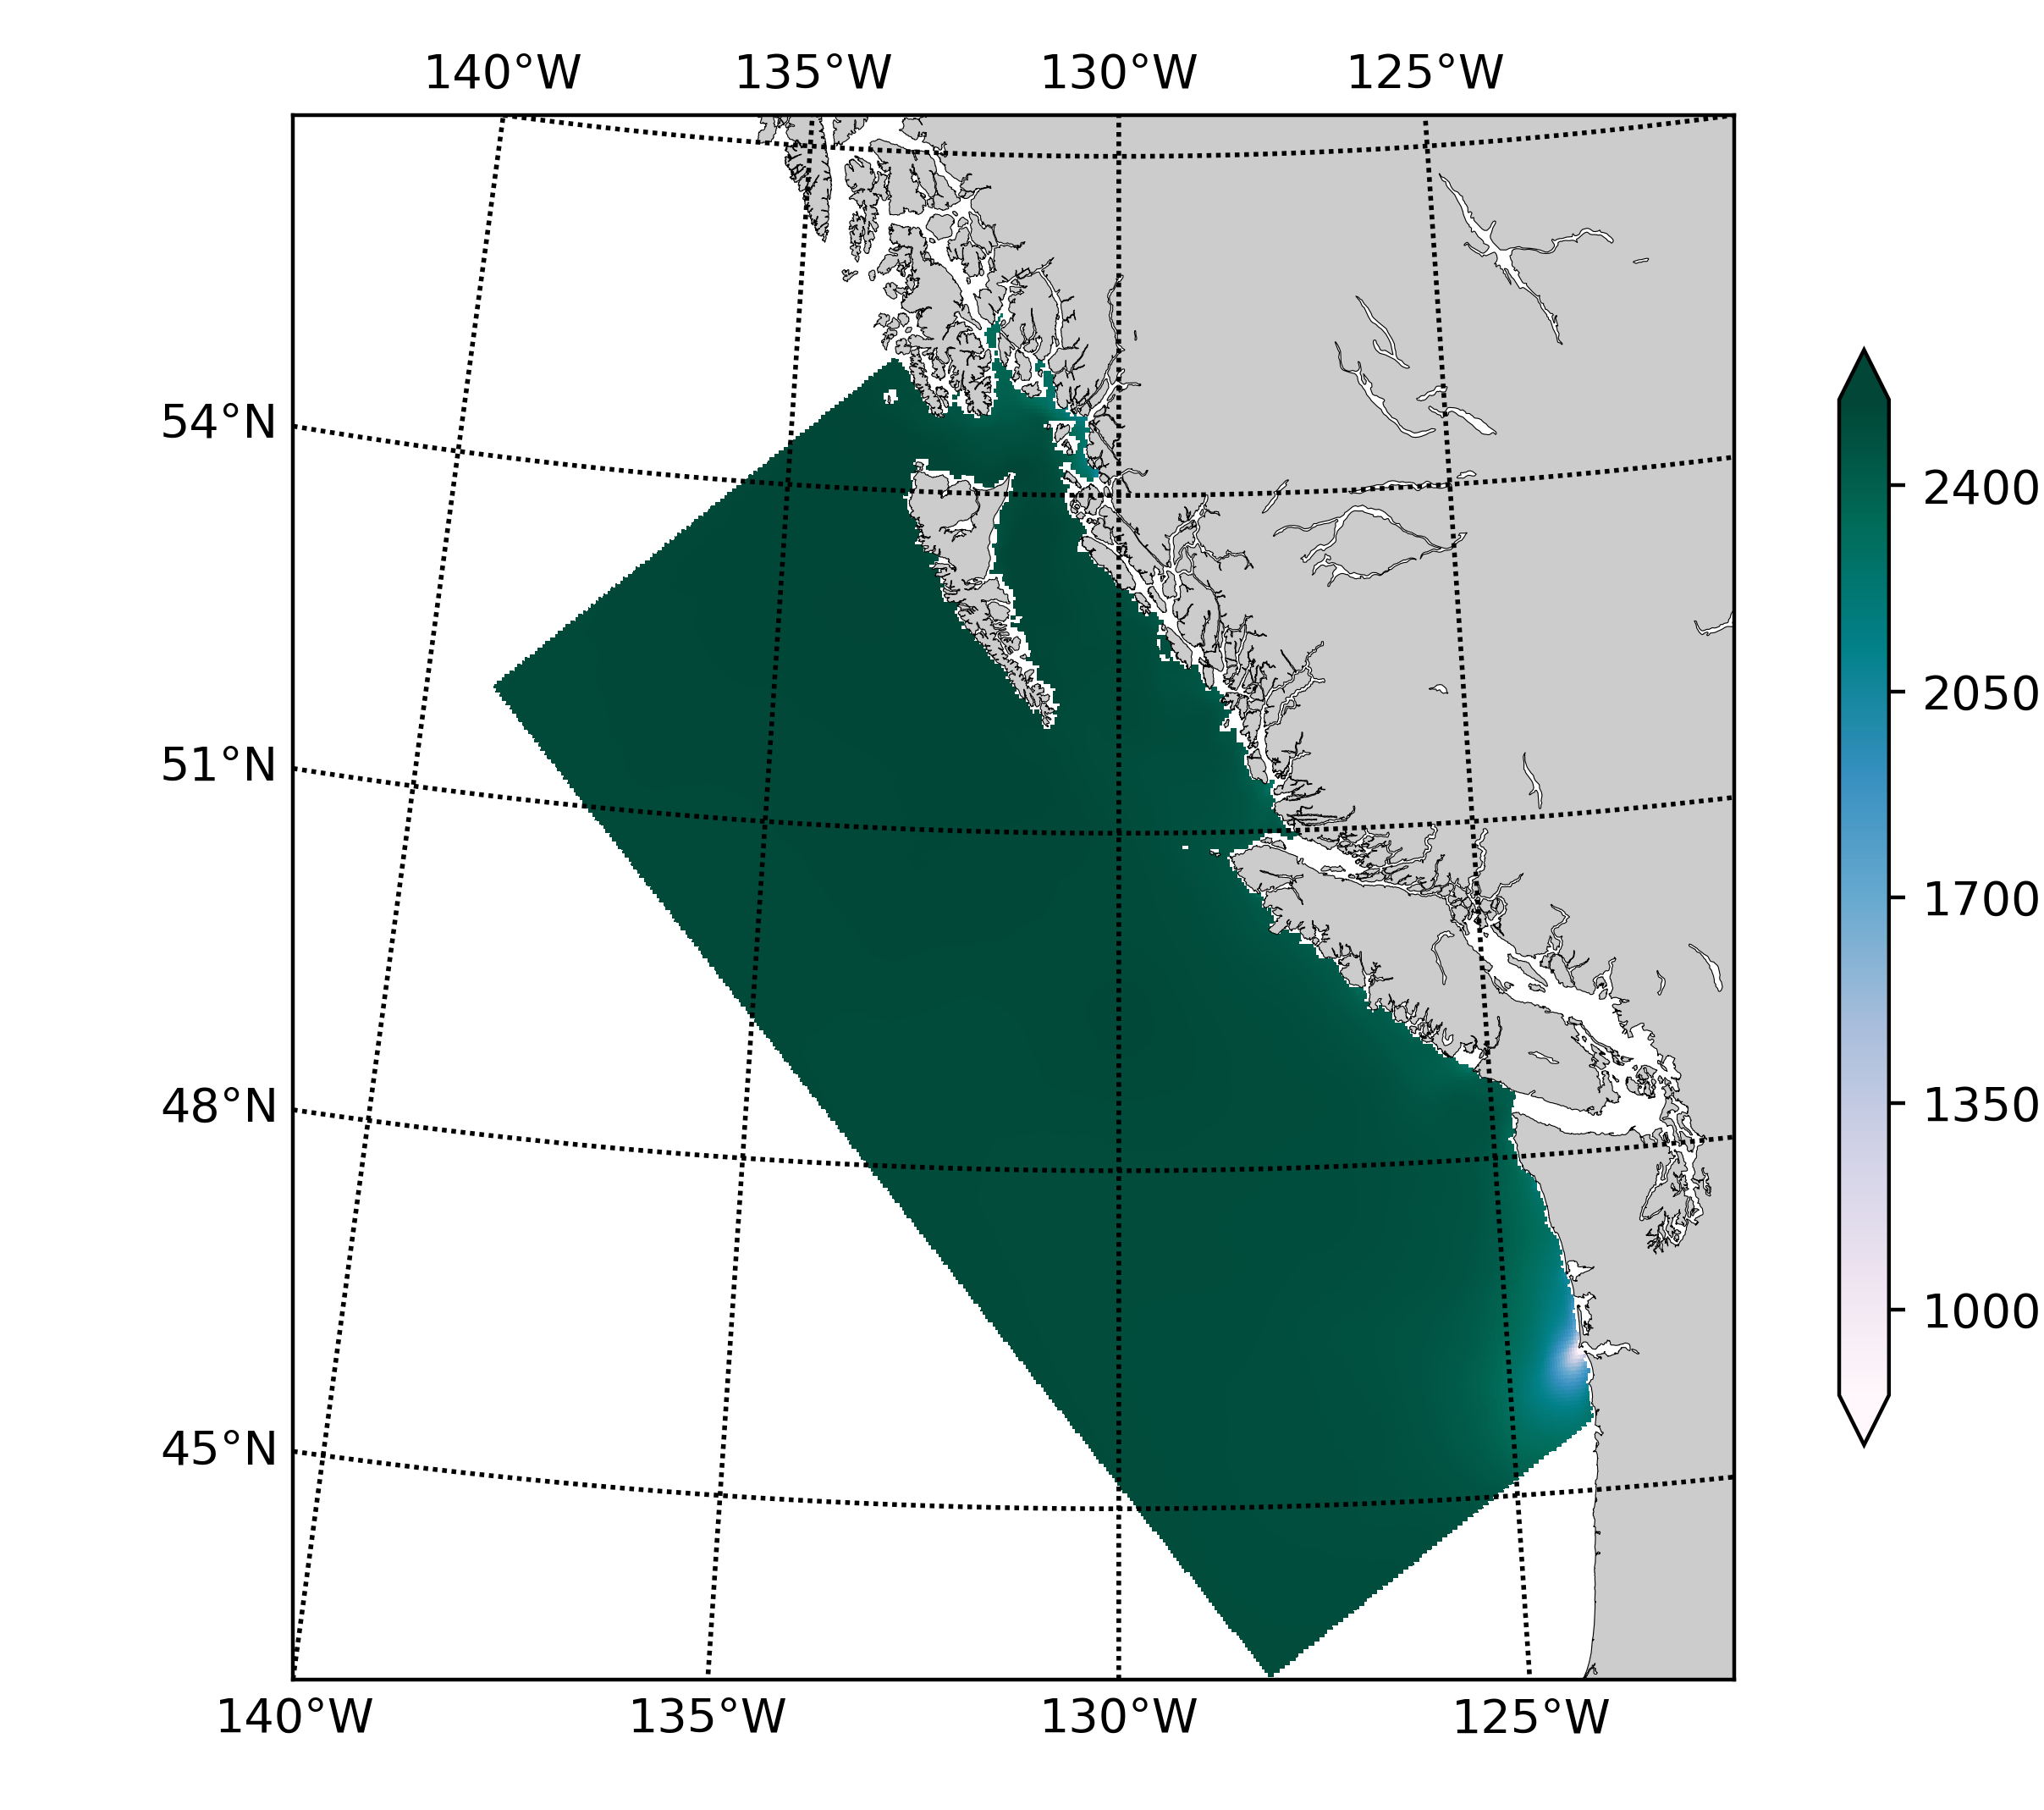
Description: Seasonal mean total alkalinity from the British Columbia continental margin model (BCCM) were averaged over the 1993 to 2020 period to create seasonal mean climatology of the Canadian Pacific Exclusive Economic Zone. Methods: Total alkalinities at up to forty-six linearly interpolated vertical levels from surface to 2400 m and at the sea bottom are included. Spring months were defined as April to June, summer months were defined as July to September, fall months were defined as October to December, and winter months were defined as January to March. The data available here contain raster layers of seasonal total alkalinity climatology for the Canadian Pacific Exclusive Economic Zone at 3 km spatial resolution and 47 vertical levels. Uncertainties: Model results have been extensively evaluated against observations (e.g. altimetry, CTD and nutrient profiles, observed geostrophic currents), which showed the model can reproduce with reasonable accuracy the main oceanographic features of the region including salient features of the seasonal cycle and the vertical and cross-shore gradient of water properties. However, the model resolution is too coarse to allow for an adequate representation of inlets, nearshore areas, and the Strait of Georgia.
-

Description: Seasonal temperature climatology of the Northeast Pacific Ocean was computed from historical observations including all available conductivity-temperature-depth (CTD), bottle, expendable bathy-thermograph (XBT), and Argo data in NOAA (http://www.argo.ucsd.edu/), Marine Environmental Data Service (MEDS), and Institute of Ocean Sciences archives over 1980 to 2010 period. Methods: Calculations, including smooth and interpolation, were carried out in sixty-five subregions and up to fifty-two vertical levels from surface to 5000m. Seasonal averages were computed as the median of yearly seasonal values. Spring months were defined as April to June, summer months were defined as July to September, fall months were defined as October to December, and winter months were defined as January to March. The data available here contain raster layers of seasonal temperature climatology for the Canadian Pacific Exclusive Economic Zone (EEZ), a subset of seasonal climatology of the Northeast Pacific Ocean, in high spatial resolution of 1/300 degree. References: Foreman, M. G. G., W. R. Crawford, J. Y. Cherniawsky, and J. Galbraith (2008). Dynamic ocean topography for the northeast Pacific and its continental margins, Geophys. Res. Lett., 35, L22606, doi: 10.1029/2008GL035152. Data Sources: NOAA, MEDS and IOS observational data Uncertainties: Uncertainties are introduced when quality controlled observational data are spatially interpolated to varying distances from the observation point. Climatological averages are calculated from these interpolated values.
-

Description: Seasonal mean salinity from the British Columbia continental margin model (BCCM) were averaged over the 1993 to 2020 period to create seasonal mean climatology of the Canadian Pacific Exclusive Economic Zone. Methods: Salinities at up to forty-six linearly interpolated vertical levels from surface to 2400 m and at the sea bottom are included. Spring months were defined as April to June, summer months were defined as July to September, fall months were defined as October to December, and winter months were defined as January to March. The data available here contain raster layers of seasonal salinity climatology for the Canadian Pacific Exclusive Economic Zone at 3 km spatial resolution and 47 vertical levels. Uncertainties: Model results have been extensively evaluated against observations (e.g. altimetry, CTD and nutrient profiles, observed geostrophic currents), which showed the model can reproduce with reasonable accuracy the main oceanographic features of the region including salient features of the seasonal cycle and the vertical and cross-shore gradient of water properties. However, the model resolution is too coarse to allow for an adequate representation of inlets, nearshore areas, and the Strait of Georgia.
-

Description: Night-time sea surface temperature (SST) was acquired from the AVHRR Pathfinder project, with data distributed by NOAA, and averaged into monthly climatological composites. The data span late 1981 through 2010 at 4 km pixel resolution. Methods: AVHRR Pathfinder version 5.3 Level 3C night Sea Surface Temperature (SST) was acquired from NOAA at 4 km spatial resolution. The monthly mean value at all pixels was calculated for individual years, then all years were combined to produce final maps of monthly mean and monthly standard deviation of SST, and the number of occurrences of valid data at each pixel over the period of observation. The quality level of all satellite observations was also acquired with this dataset, and used to remove any pixels with a quality level lower than 4. Further, pixels with fewer than two occurrences over the period 1981-2010 were removed from these maps, and set to a NaN value in the tif files. All resulting rasters were cropped to the Canadian Exclusive Economic Zone and assigned to the NAD83 geographic coordinate reference system (EPSG:4269), and have a final pixel resolution of approximately 0.0417 degrees. The monthly mean, monthly standard deviation, and number of occurrences for all pixels are provided. Uncertainties: Satellite values have been evaluated against global datasets, and datasets of samples in the Pacific region (see references). However, uncertainties are introduced when averaging together images over time as each pixel has a differing number of observations. Short-lived or spatially limited events may be missed.