zooplankton
Type of resources
Available actions
Topics
Keywords
Contact for the resource
Provided by
Years
Formats
Representation types
Update frequencies
status
-
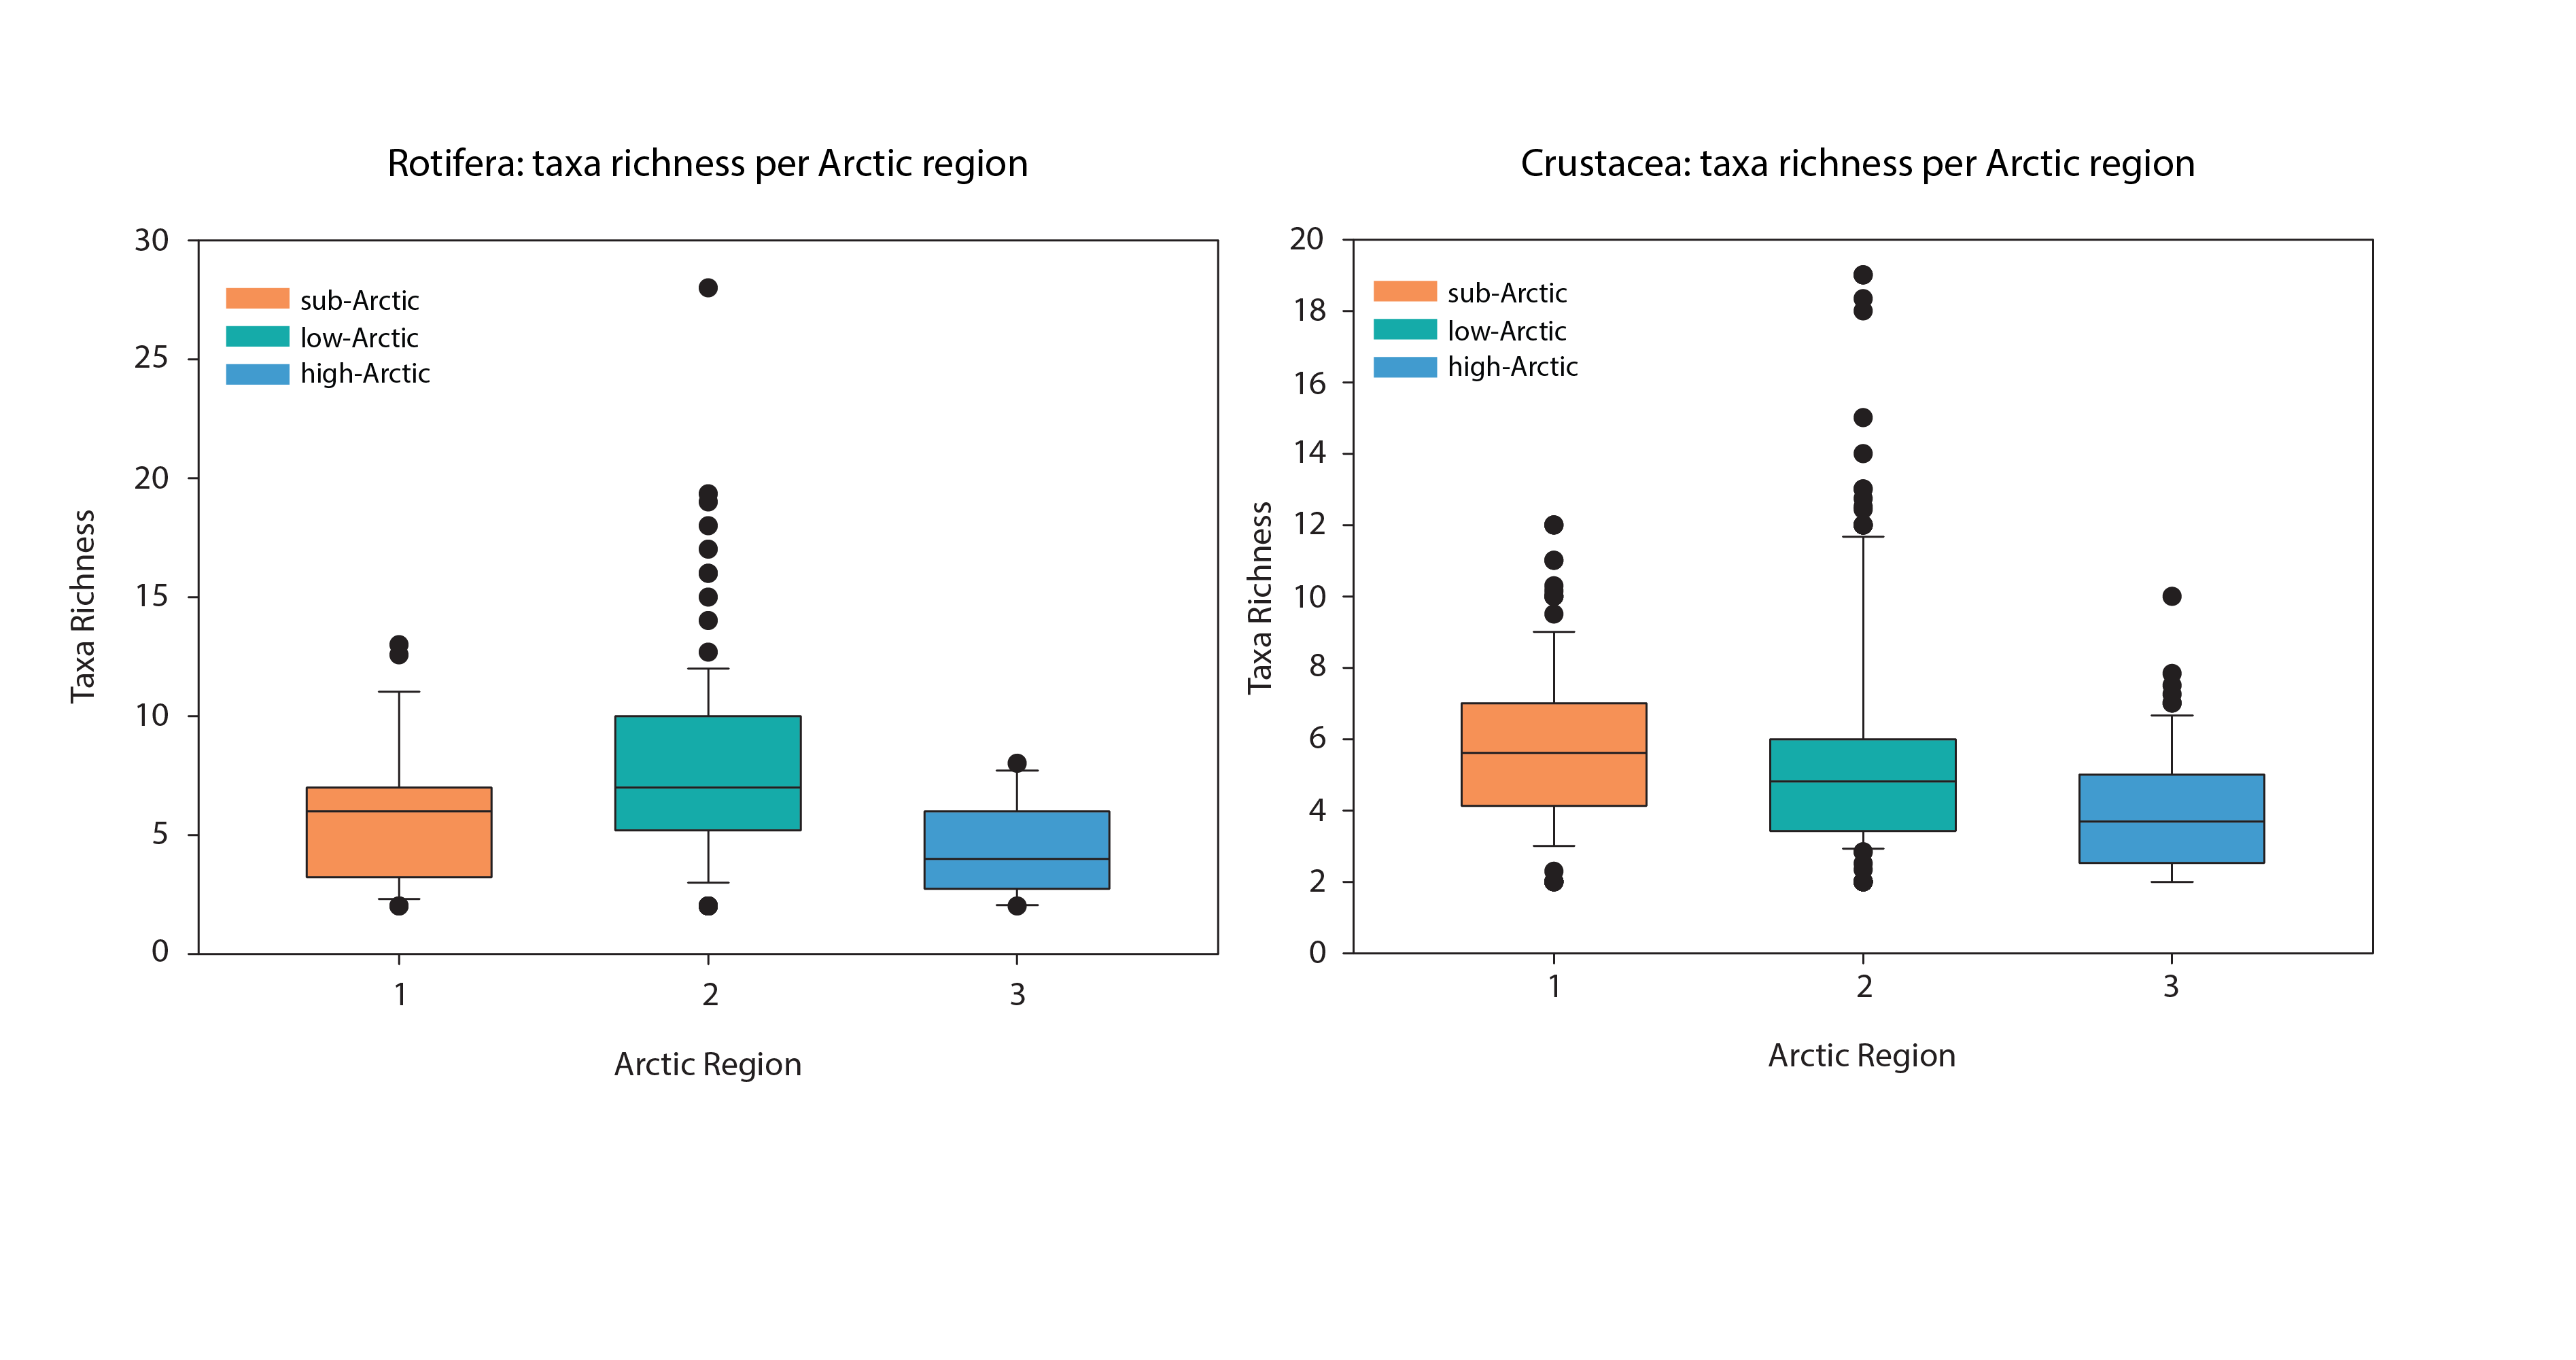
Box-plots of taxa richness (average per lake) by Arctic regions for rotifers (left) and crustaceans (right). Crustacean taxa are restricted to taxa within Calanoida, Cyclopoida and Cladocera. Samples with only a single taxon have been excluded. Boxes represent median and interquartile range. State of the Arctic Freshwater Biodiversity Report - Chapter 4 - Page 60 - Figure 4-27
-
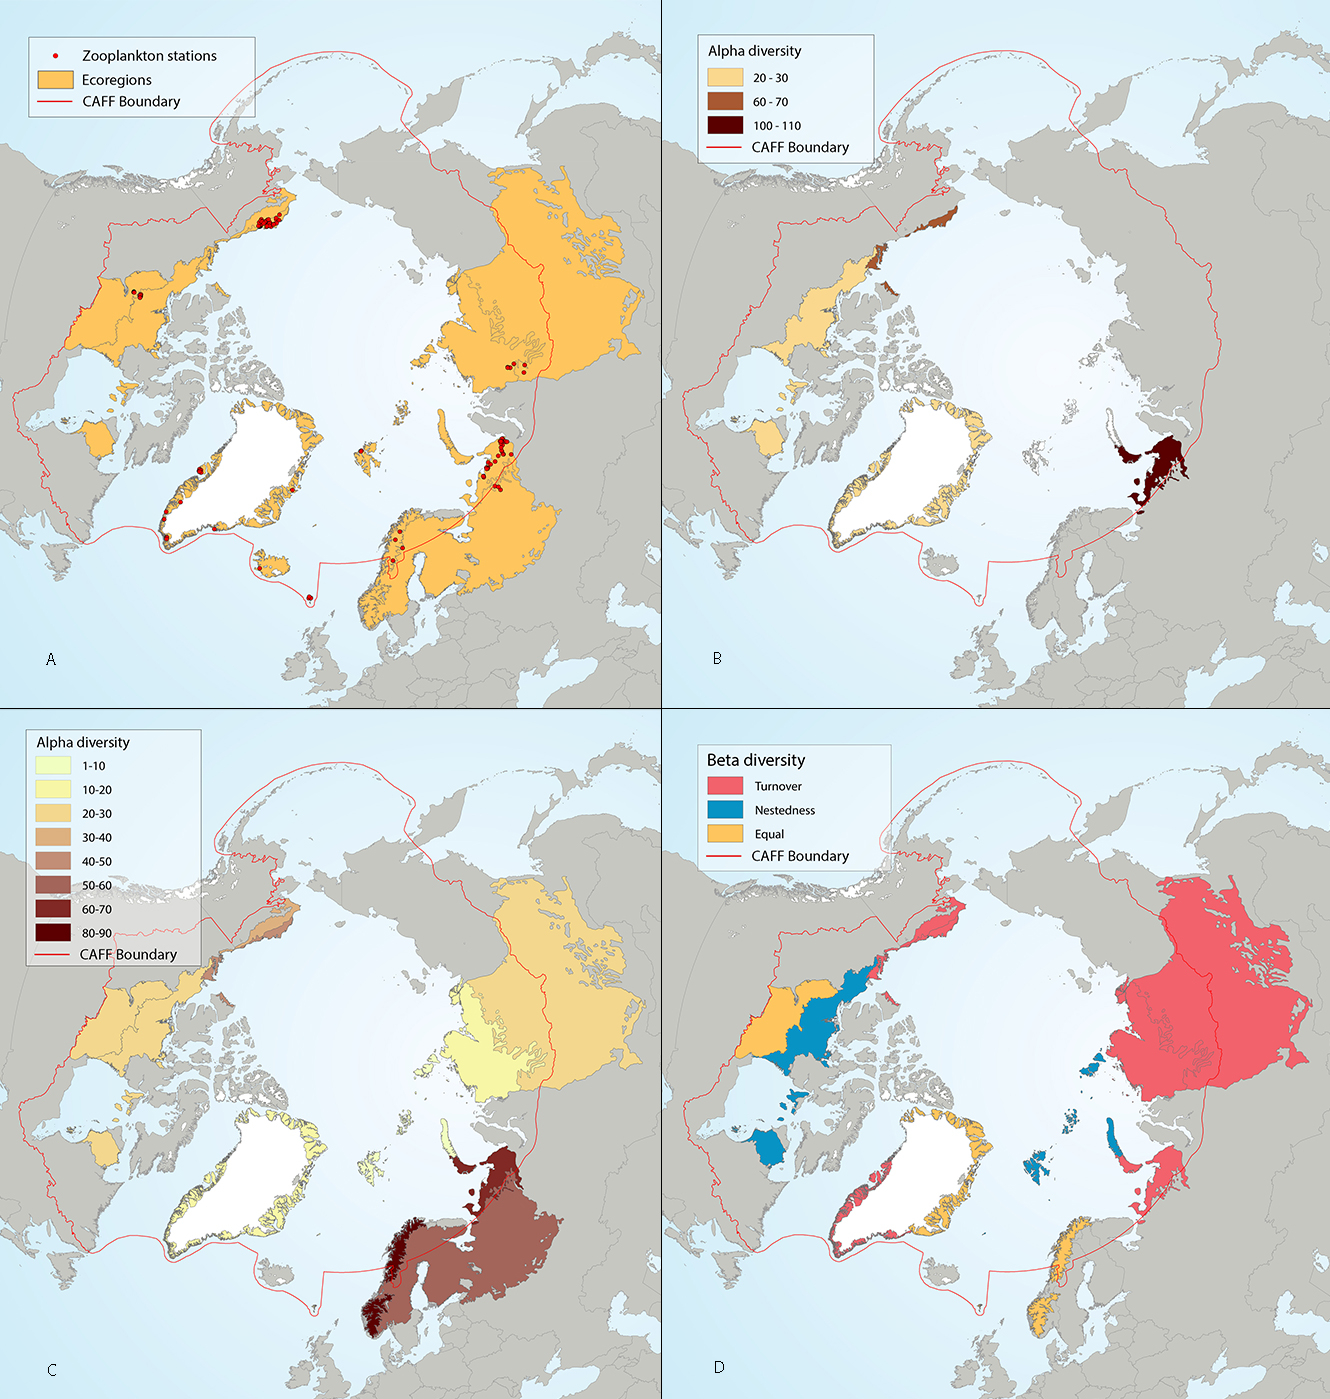
Results of circumpolar assessment of lake zooplankton, including crustaceans and rotifers, and indicating (a) the location of zooplankton stations, underlain by circumpolar ecoregions; (b) ecoregions with many zooplankton stations, colored on the basis of alpha diversity rarefied to 25 stations; (c) all ecoregions with zooplankton stations, colored on the basis of alpha diversity rarefied to 10 stations; (d) ecoregions with at least two stations in a hydrobasin, colored on the basis of the dominant component of beta diversity (species turnover, nestedness, approximately equal contribution, or no diversity) when averaged across hydrobasins in each ecoregion. State of the Arctic Freshwater Biodiversity Report - Chapter 4- Page 59 - Figure 4-26
-
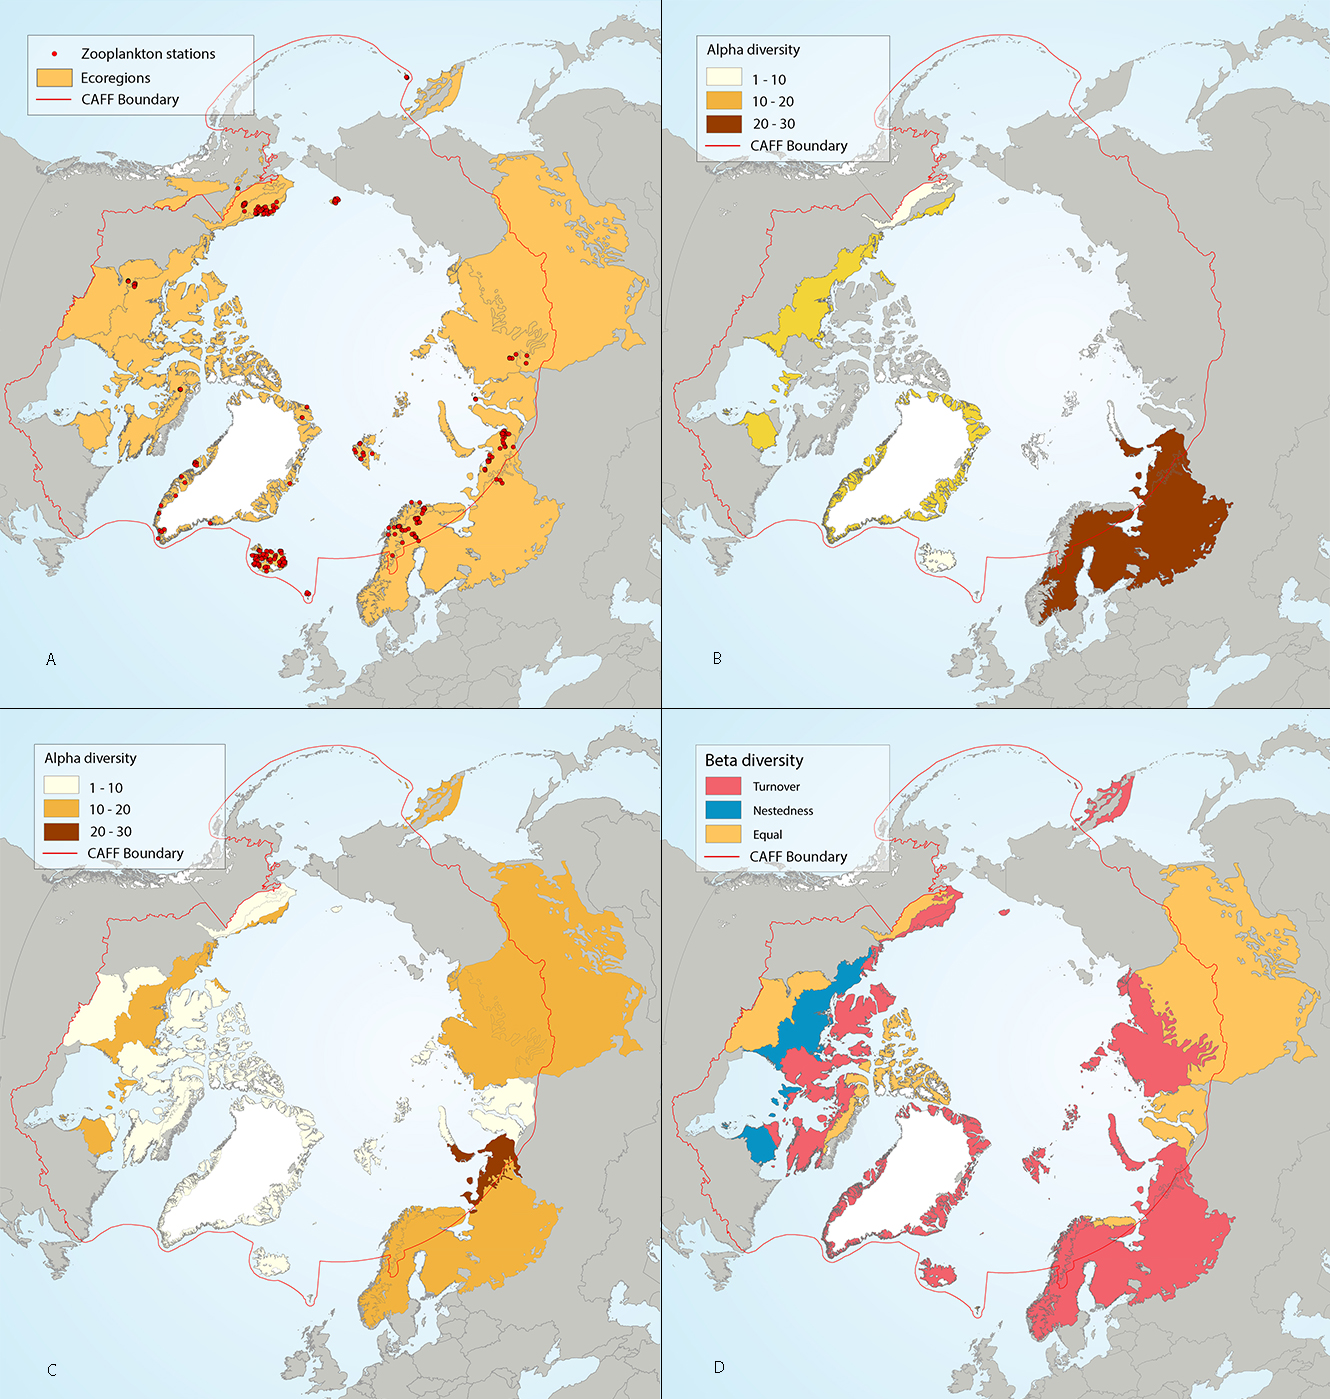
Results of circumpolar assessment of lake zooplankton, focused just on crustaceans, and indicating (a) the location of crustacean zooplankton stations, underlain by circumpolar ecoregions; (b) ecoregions with many crustacean zooplankton stations, colored on the basis of alpha diversity rarefied to 25 stations; (c) all ecoregions with crustacean zooplankton stations, colored on the basis of alpha diversity rarefied to 10 stations; (d) ecoregions with at least two stations in a hydrobasin, colored on the basis of the dominant component of beta diversity (species turnover, nestedness, approximately equal contribution, or no diversity) when averaged across hydrobasins in each ecoregion. State of the Arctic Freshwater Biodiversity Report - Chapter 4 - Page 58 - Figure 4-25
-
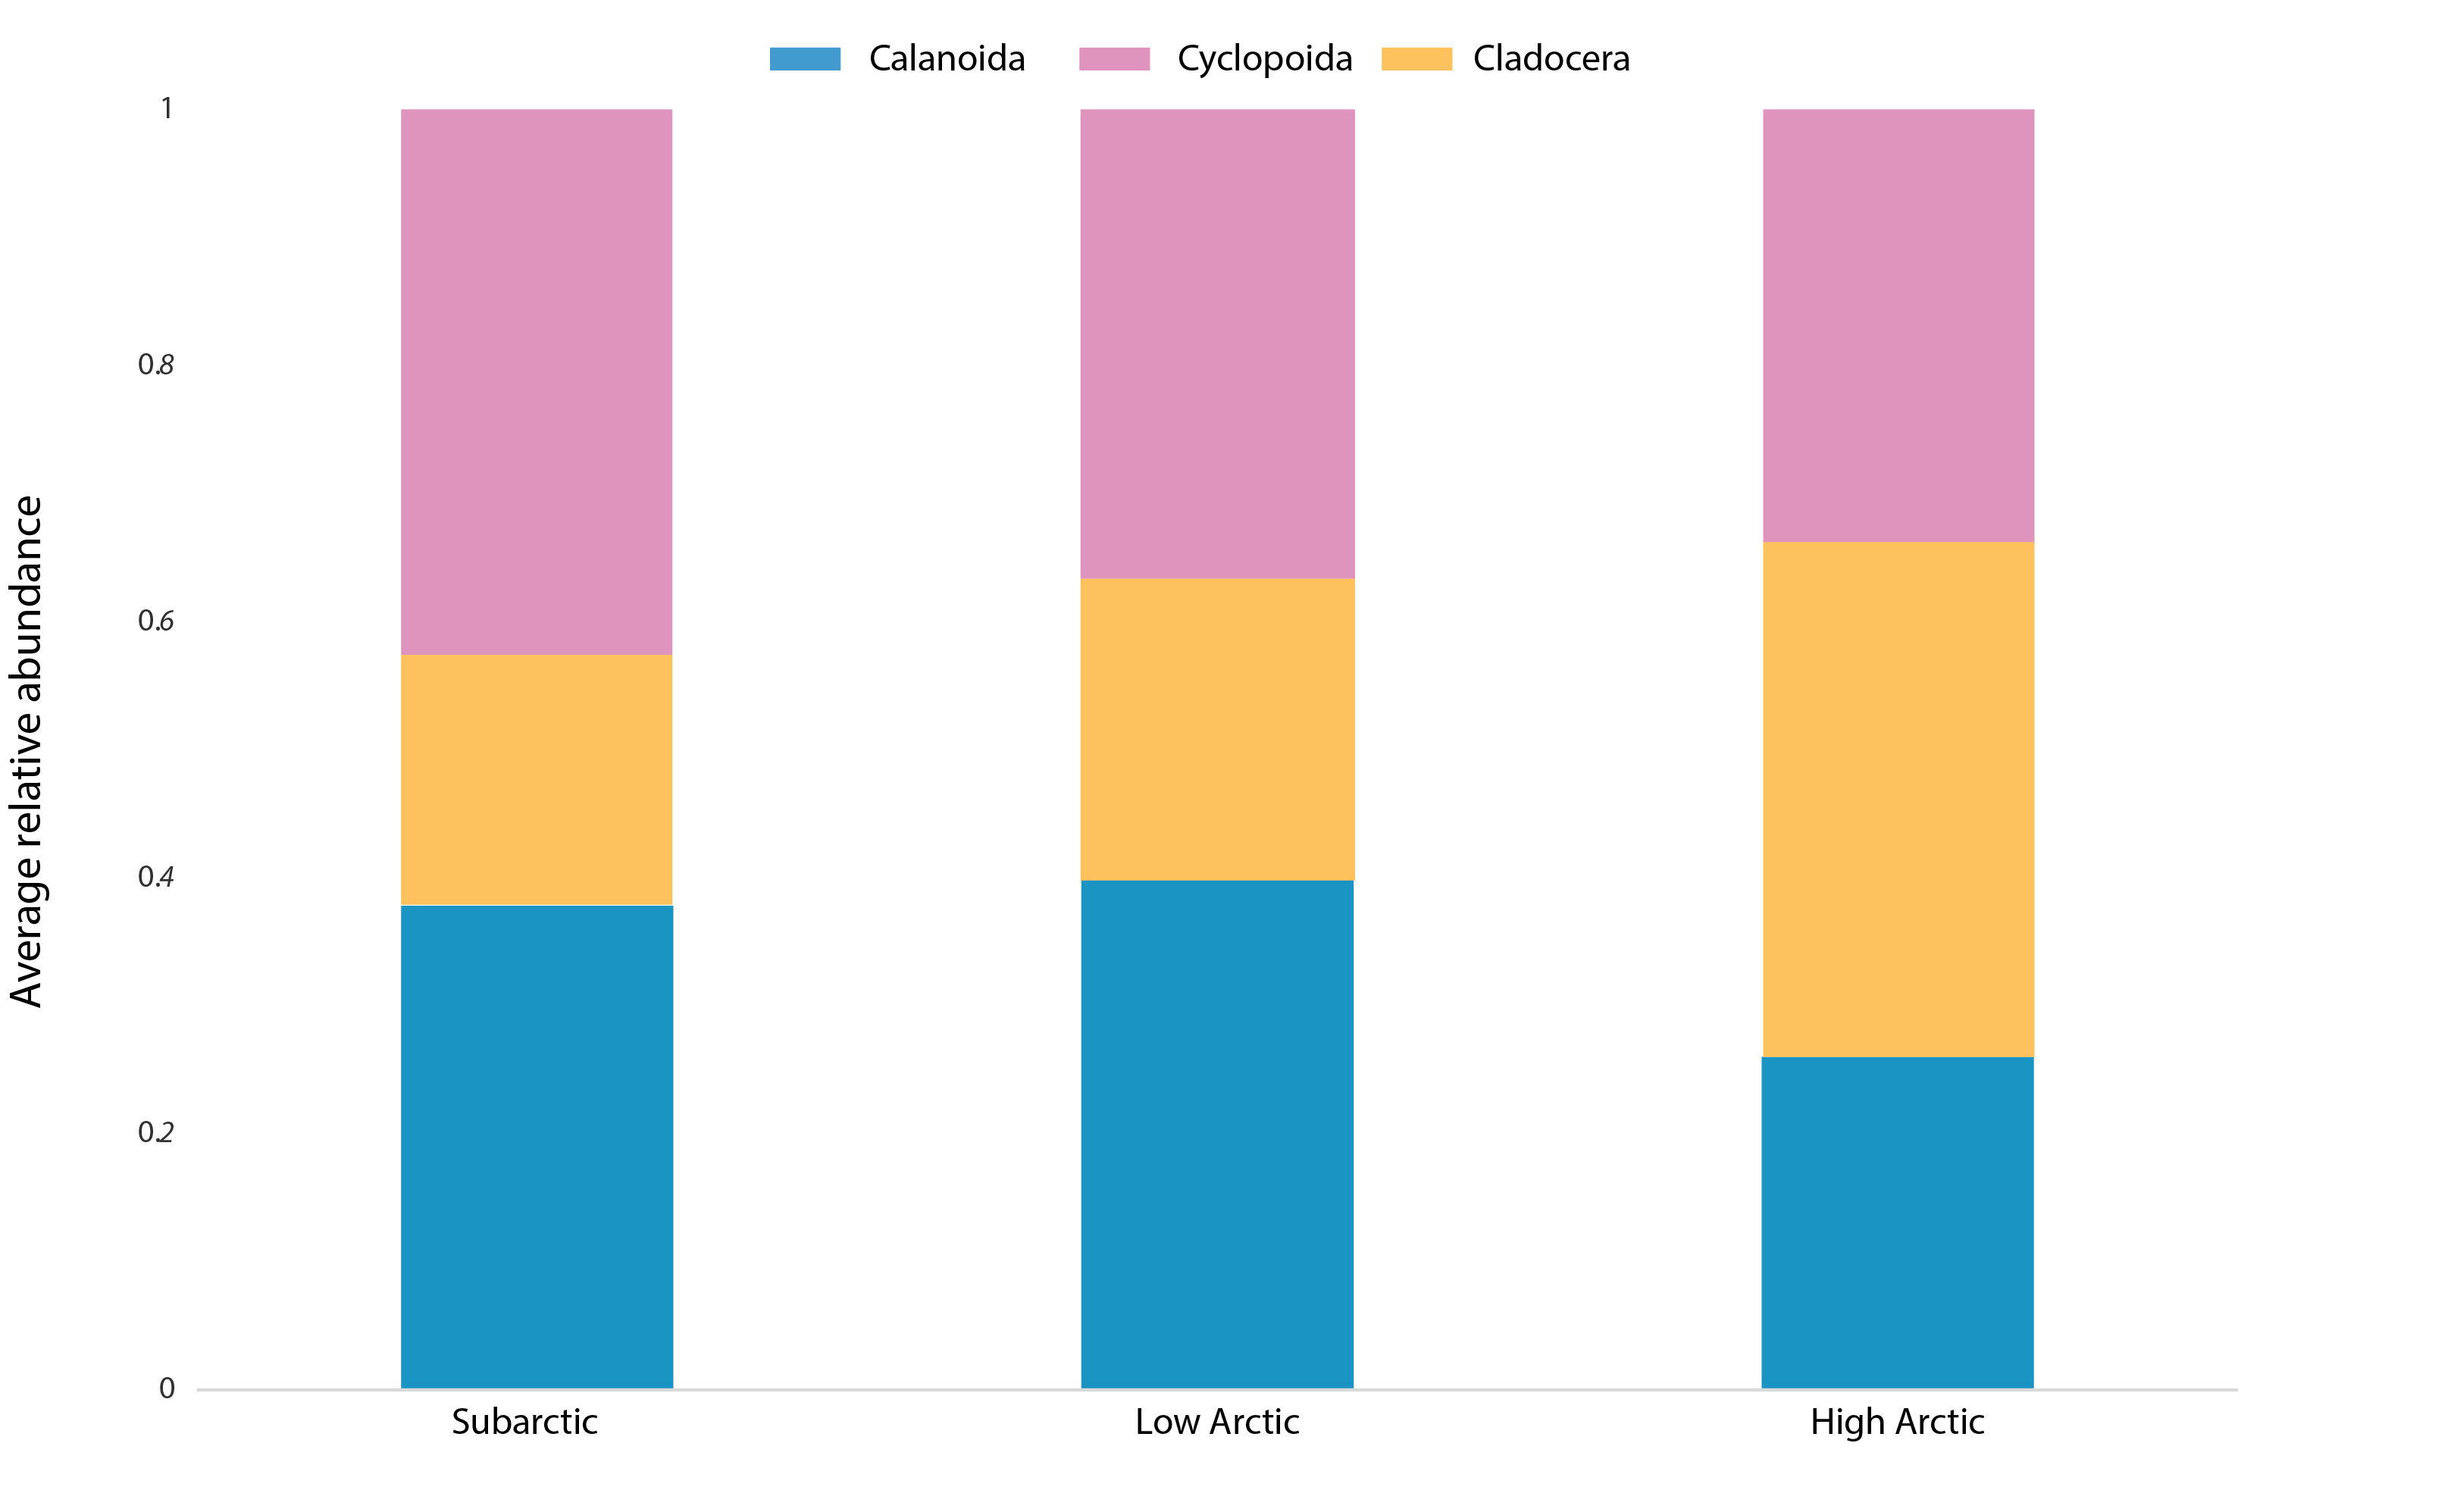
Average relative abundance of the main zooplankton groups (calanoid copepods, cyclopoid copepods, cladocerans) for the sub-Arctic (n=150), low- Arctic (n=154), and high-Arctic (n=55) regions. Samples with a single taxon have been excluded. State of the Arctic Freshwater Biodiversity Report - Chapter 4 - Page 61 - Figure 4-28
-
In the Northwest Atlantic, Pandalus borealis (northern shrimp) serve as key mid-trophic consumers and prey for higher-trophic predators, including commercially important fish species. However, the impact of changing environmental conditions on trophic interactions and lipid storage in sub-Arctic ecosystems is not well understood. We employed biochemical tracers (fatty acids and stable isotopes) to investigate the trophic ecology and stage-specific nutritional condition of P. borealis across spatial and seasonal scales. A total of 68 different fatty acids (FAs) were identified in P. borealis tissues (i.e., muscle and eggs). The relative abundances of these FAs varied among sex, tissues, seasons, and fishing areas. Results revealed that P. borealis primarily fed on diatoms and zooplankton, with opportunistic feeding on sinking phytodetritus. Lipid composition showed strong seasonality, with storage triacylglycerols being the predominant lipid class. Ovigerous females exhibited the highest lipid concentrations and essential fatty acids, emphasizing the ecological importance of eggs as high-quality lipid sources. Additionally, total lipid content in eggs increased from spring to summer, highlighting vulnerability to shifts in seasonal primary production. This study underscores the significant seasonal variability in the nutritional status of P. borealis and the need to understand lipid dynamics to assess population resilience to environmental changes. Important Note: This submission has been initially submitted to SEA scieNtific Open data Edition (SEANOE) publication service and received the recorded DOI. The metadata elements have been further processed (refined) in EMODnet Ingestion Service in order to conform with the Data Submission Service specifications.
-
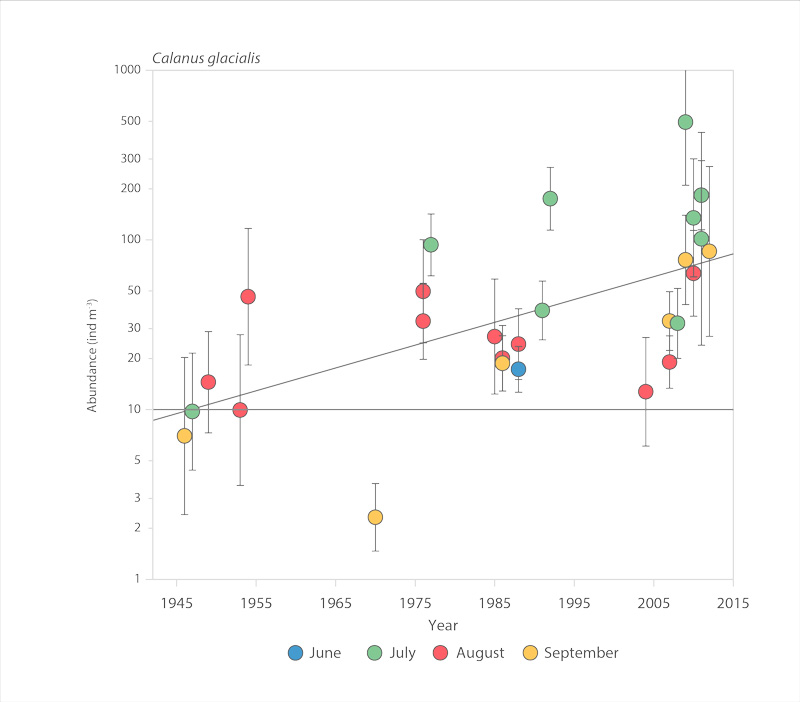
Abundance of the copepod Calanus glacialis in the Chukchi Sea, 1945-2012 (after Ershova et al. 2015b). STATE OF THE ARCTIC MARINE BIODIVERSITY REPORT - <a href="https://arcticbiodiversity.is/findings/plankton" target="_blank">Chapter 3</a> - Page 75 - Figure 3.2.6
-

Description: Seasonal climatologies for Zooplankton biomass in seven size categories were calculated for the period 1990-2019. The data used were a subset of the Fisheries and Oceans Canada, Institute of Ocean Sciences Zooplankton Database. This dataset is incomplete and is regularly updated as analysis takes place. Methods: Data-Interpolating Variational Analysis (DIVA) was used for spatial. Seasonal averages were computed as the mean of yearly seasonal means. Spring months were defined as April to June, summer months were defined as July to September, fall months were defined as October to December, and winter months were defined as January to March. The data available here contain raster layers of seasonal Zooplankton climatology for the Canadian Pacific Exclusive Economic Zone (EEZ), with high spatial resolution of 1/300 degree. Uncertainties: Uncertainties are introduced when observational data are spatially interpolated to varying distances from the observation point. Climatological averages are calculated from these interpolated values. Caution should be used for data in inlets and nearshore as the interpolation does not perform well in these areas, data in some inlets have been masked.
-
Bivalve aquaculture has direct and indirect effects on plankton communities, which are highly sensitive to short-term (seasonal, interannual) and long-term climate changes, although how these dynamics alter aquaculture ecosystem interactions is poorly understood. Here, we investigate seasonal patterns in plankton abundance and community structure spanning several size fractions from 0.2 µm up to 5 mm, in a deep aquaculture embayment in northeast Newfoundland, Canada. Using flow cytometry and FlowCam imaging, we observed a clear seasonal relationship between fraction sizes driven by water column stratification (freshwater input, nutrient availability, light availability, water temperature). Plankton abundance decreased proportionally with increasing size fraction, aligning with size spectra theory. Within the bay, greater mesozooplankton abundance, and a greater relative abundance of copepods, was observed closest to the aquaculture lease. No significant spatial effect was observed for phytoplankton composition. While the months of August to October showed statistically similar plankton composition and size spectra slopes (i.e., food chain efficiency) and could be used for interannual variability comparisons of plankton composition, sampling for longer periods could capture long-term phenological shifts in plankton abundance and composition related to various processes, including climate change. Conclusions provide guidance on optimal sampling to monitor and assess aquaculture pathways of effects. Cite this data as: Sharpe H, Lacoursière-Roussel A, Gallardi D (2024). Ecological insight of seasonal plankton succession to monitor shellfish aquaculture ecosystem interactions. Version 3.2. Fisheries and Oceans Canada. Sampling event dataset. https://doi.org/10.25607/2ujdvh
-

The Lake Simcoe lake monitoring program provides measurements of chemical and physical water quality limits such as total phosphorus, nitrogen, chlorophyll a, pH, alkalinity, conductivity, dissolved organic and inorganic carbon, silica, other ions, water transparency, temperature and dissolved oxygen. Samples are collected biweekly during the spring, summer and fall. *[pH]: potential of hydrogen
-

Identification of ecological and biological significant areas (EBSA) in the Estuary and the Gulf of St. Lawrence according to six groups of the food chain : primary production (Lavoie et al, 2007), secondary production (Plourde et McQuinn, 2010), meroplankton (Ouellet, 2007), benthic invertebrates (Chabot et al, 2007), demersal fishes (Castonguay et Valois, 2007) and pelagic fishes (McQuinn et al, 2012). The distribution area of each group has been evaluated using five criteria in order to determine the EBSA (DFO, 2004): 1. Uniqueness: Ranked from areas whose characteristics are unique, rare, distinct, and for which alternatives do not exist to areas whose characteristics are widespread with many areas which are similar. 2. Aggregation: Ranked from areas where most individuals of a species are aggregated to areas where individuals of the species are widespread 3. Fitness consequence: Ranked from areas where the life history activity(ies) undertaken make a major contribution to the fitness of the population or species present to areas where the life history activity(ies) undertaken make only marginal contributions to fitness. 4. Resilience: Ranked from areas where the habitat structures or species are highly sensitive, easily perturbed, and slow to recover to areas where the habitat structures or species are robust, resistant to perturbation, or readily return to the pre-perturbation state. 5. Naturalness: Ranked from areas which are pristine and characterized by native species to areas which are highly perturbed by anthropogenic activities and/or with high abundances of introduced or cultured species. Castonguay, M. and Valois, S. 2007. Zones d’importance écologique et biologique pour les poissons démersaux dans le nord du Golfe du Saint-Laurent. DFO Can. Sci. Advis. Sec. Res. Doc. 2007/014. iii + 34 p. Chabot, D., Rondeau A., Sainte-Marie B., Savard L., Surette T. et Archambault P. 2007. Distribution des invertébrés benthiques dans l’estuaire et le golfe du Saint-Laurent. DFO Can. Sci. Advis. Sec. Res. Doc. 2007/018. iii + 118 p. DFO, 2004. Identification of Ecologically and Biologically Significant Areas. DFO Can. Sci. Advis. Sec. Ecosystem Status Rep. 2004/006. Lavoie, D., Starr, M., Zakardjian, B. and Larouche, P. 2007. Identification of ecologically and biologically significant areas (EBSA) in the Estuary and Gulf of St. Lawrence: Primary production. DFO Can. Sci. Advis. Sec. Res. Doc. 2007/079. iii + 29 p. McQuinn, I.H., Bourassa, M-N., Tournois, C., Grégoire, F., and Baril, D. 2012. Ecologically and biologically significant areas in the Estuary and Gulf of St. Lawrence: small pelagic fishes. DFO Can. Sci. Advis. Sec. Res. Doc. 2012/087. iii + 76 p. Ouellet P. 2007. Contribution à l’identification de zones d’importance écologique et biologique (ZIEB) pour l’estuaire et le golfe du Saint-Laurent : La couche des oeufs et des larves de poissons et de crustacés décapodes. DFO Can. Sci. Advis. Sec. Res. Doc. 2007/011. iii + 76 p. (Mise à jour novembre 2010) Plourde, S. et McQuinn, I.A. 2010. Zones d’importance écologique et biologique dans le golfe du Saint-Laurent : zooplancton et production secondaire. DFO Can. Sci. Advis. Sec. Res. Doc. 2009/104. iv + 27 p.
 Arctic SDI catalogue