 Arctic SDI catalogue
Population distribution
Type of resources
Available actions
Topics
Keywords
Contact for the resource
Provided by
Formats
Representation types
Update frequencies
status
-

A population ecumene is the area of inhabited lands or settled areas generally delimited by a minimum population density. This ecumene shows the areas of the densest and most extended population within census divisions. Census divisions are the provincially legislated areas (such as county, municipalité régionale de comté, and regional district) or their equivalents. Census divisions are intermediate geographic areas between the province or territory level and the municipality (census subdivision). For further information, consult the Statistics Canada’s 2016 Illustrated Glossary (see below under Data Resources). The assemblage of dissemination area population density data from the 2016 Census of Population are used to form the ecumene within census divisions. Areas included in the ecumene are dissemination areas where the population density is greater than or equal to 0.4 persons per square kilometre or about one person per square mile. In some areas to capture more population within the ecumene the criteria was extended to 0.2 persons per square kilometre. The ecumene areas were generalized in certain areas to enhance the size of some isolated ecumene areas in northern Canada. This map can be used as an “ecumene” overlay to differentiate the sparsely populated areas from the ecumene in conjunction with census division data or other small-scale maps. This ecumene shows a more meaningful distribution of the population for Canada.
-
A population ecumene is the area of inhabited lands or settled areas generally delimited by a minimum population density. Two population data sets from the 2016 Census of Population were used to build two specialized ecumene maps. The census division ecumene was built from dissemination area population density data and the census subdivision ecumene was built from the dissemination block population density data. For information on census divisions, census subdivisions, dissemination areas, and dissemination blocks consult the Statistics Canada’s 2016 Illustrated Glossary (see below under Data Resources). Areas included in the ecumene (for either the census division or census subdivision) are areas where the population density is greater than or equal to 0.4 persons per square kilometre or about 1 person per square mile. In some areas to capture more population within the ecumene the criteria was extended to 0.2 persons per square kilometre. The ecumene areas were generalized in certain regions either to enhance the size of some isolated ecumene areas or to remove small internal uninhabited areas within the ecumene. Either of these ecumene resources can be used as an “ecumene” map overlay to differentiate the sparsely populated areas from the ecumene in conjunction with the appropriate census geography or other small-scale and large-scale maps.
-

A population ecumene is the area of inhabited lands or settled areas generally delimited by a minimum population density. This ecumene shows the areas of the densest and most extended population within census subdivisions. A census subdivision (CSD) is the general term for municipalities (as determined by provincial or territorial legislation) or areas treated as municipal equivalents for statistical purposes (e.g., Indigenous Peoples reserves and communities and unorganized territories). Municipal status is defined by laws in effect in each province and territory in Canada. For further information, consult the Statistics Canada’s 2016 Illustrated Glossary (see below under Data Resources). The assemblage of dissemination block population density data from the 2016 Census of Population are used to form the ecumene areas within census subdivisions. Areas included in the ecumene are dissemination blocks where the population density is greater than or equal to 0.4 persons per square kilometre or about one person per square mile. In some areas to capture more population within the ecumene the criteria was extended to 0.2 persons per square kilometre. The ecumene areas were generalized in certain areas to remove small uninhabited areas within the ecumene areas in census subdivisions. This map can be used as an “ecumene” overlay to differentiate the sparsely populated areas from the ecumene in conjunction with census subdivision data or other large-scale maps. This ecumene shows a more meaningful distribution of the population for Canada.
-
The RVI/CVI database is derived from the CanEcumene 3.0 GDB (Eddy, et. al. 2023) using a selection of socio-economic variables identified in Eddy and Dort (2011) that aim to capture the overall state of socio-economic conditions of communities as ‘human habitats’. This dataset was developed primarily for application in mapping socio-economic conditions of communities and regions for environmental and natural resource management, climate change adaptation, Impact Assessments (IAs) and Regional Assessments (RAs), and Cumulative Effects Assessment (CEA). The RVI/CVI is comprised of five sub-indicators: 1) population change, 2) age structure, 3) education levels, 4) employment levels, and 5) real estate values. Index values are based on percentile ranks of each sub-indicator, and averaged for each community, and for three ranked groups: 1) all of Canada, 2) by province, and 3) by population size. The data covers the Census periods of 2001, 2006, 2011 (NHS), 2016, and 2021. The index is mapped in two ways: 1) as ‘points’ for individual communities (CVI), and 2) as ‘rasters’ for spatial interpolation of point data (RVI). These formats provide an alternative spatial framework to conventional StatsCan CSD framework. (For more information on this approach see Eddy, et. al. 2020). ============================================================================================ Eddy, B.G., Muggridge, M., LeBlanc, R., Osmond, J., Kean, C., and Boyd, E. 2023. The CanEcumene 3.0 GIS Database. Federal Geospatial Platform (FGP), Natural Resources Canada. https://gcgeo.gc.ca/viz/index-en.html?keys=draft-3f599fcb-8d77-4dbb-8b1e-d3f27f932a4b Eddy B.G., Muggridge M, LeBlanc R, Osmond J, Kean C, Boyd E. 2020. An Ecological Approach for Mapping Socio-Economic Data in Support of Ecosystems Analysis: Examples in Mapping Canada’s Forest Ecumene. One Ecosystem 5: e55881. https://doi.org/10.3897/oneeco.5.e55881 Eddy, B.G.; Dort, A. 2011. Integrating Socio-Economic Data for Integrated Land Management (ILM): Examples from the Humber River Basin, western Newfoundland. Geomatica, Vol. 65, No. 3, p. 283-291. doi:10.5623/cig2011-044.
-
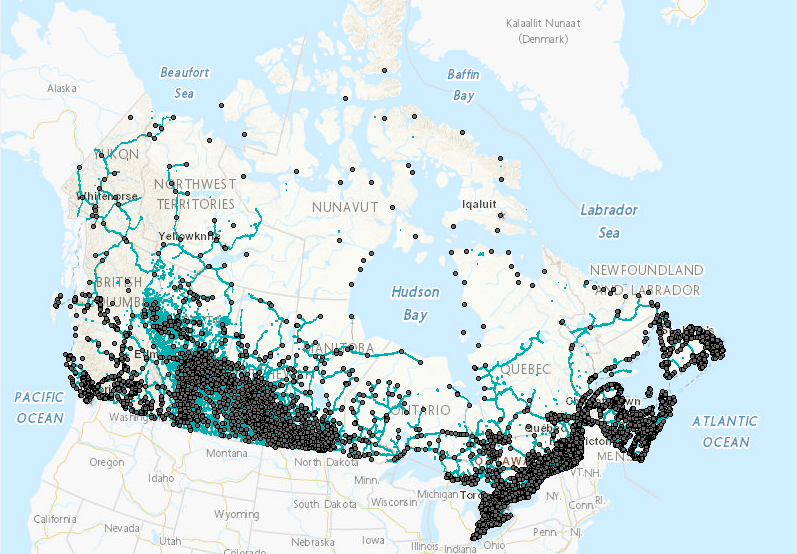
“Ecumene” is a term used by geographers, meaning “inhabited lands.” Populated places in the ecumene database are referenced using natural boundaries, as opposed to administrative or census boundaries, and provide a more suitable means for integrating socio-economic data with ecological and environmental data in a region. The Canadian Ecumene GeoDatabase 3.0 includes the custom boundaries for more than 3,000 populated areas across Canada, many of which were derived from remote-sensing “night-lights” imagery. Each ecumene place has a corresponding set of attributes pertaining to place name, province, ecozone, indigenous communities, and other descriptive information, as well as an initial custom set of demographic variables derived from Statistics Canada Census and National Household Survey data for 2001, 2006, 2011 and 2016. A number of additional layers are also included that map the extents of Canada's ecumene in alternate ways, using transportation and utility networks, nightlights imagery, and population density. (NOTE: In the list below, the V2 Shape, KML, and TIFF files have not changed for the CanEcumene 3.0) Provided layer: The Canadian Ecumene (CanEcumene) 3.0 GIS Database ============================================================================================ Database Citation (Update): Eddy, B.G., Muggridge, M., LeBlanc, R., Osmond, J., Kean, C., and Boyd, E. 2023. The CanEcumene 3.0 GIS Database. Federal Geospatial Platform (FGP), Natural Resources Canada. https://open.canada.ca Methods Publication Citation: Eddy B, Muggridge M, LeBlanc R, Osmond J, Kean C, Boyd E (2020) An Ecological Approach for Mapping Socio-Economic Data in Support of Ecosystems Analysis: Examples in Mapping Canada’s Forest Ecumene. One Ecosystem 5: e55881. https://doi.org/10.3897/oneeco.5.e55881
-

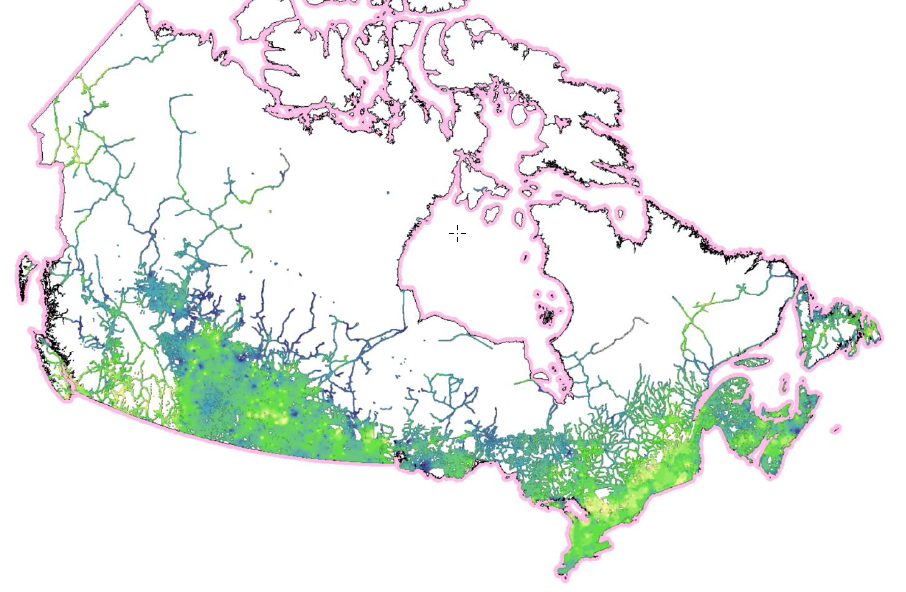
The Labour Force Distribution (LFD) maps are derived from the CanEcumene 2.0 Geodatabase using custom tabulations of census-based labour force data. These LFD maps were calculated for each of the five major natural resource sectors in Canada: Forestry, Fisheries, Agriculture, Minerals, and Petroleum and Coal. The measure used is the labour force of each sector as a proportion of the goods-producing sectors in the economy. Labour force proportions were first calculated at the individual community level, and then interpolated on a regional level using GIS (see Eddy et. al. 2020 for more detail). In effect, these maps show the strong importance of Canada’s natural resource sectors in various regions of the country. The darker the tone in each map indicates a region’s higher degree of dependency on a given sector for their economic livelihood.
-

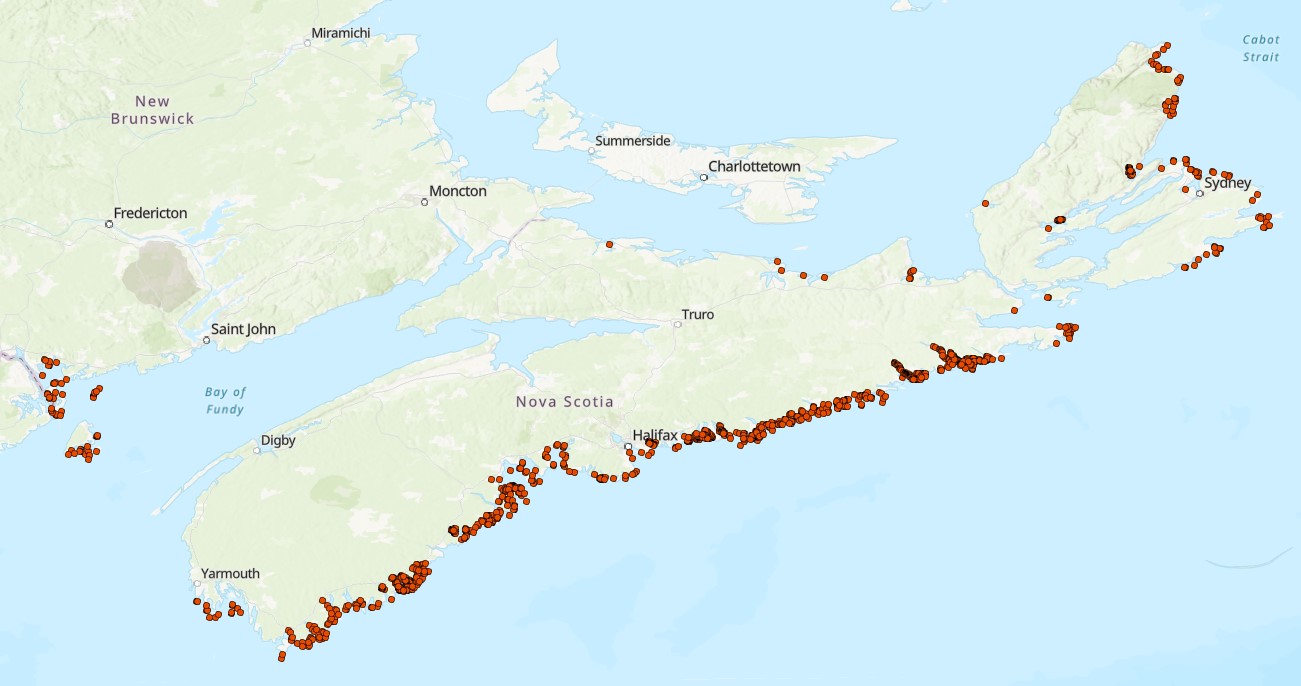
To assess the current distribution of kelp beds and other macroalgae in Nova Scotia and Southwest New Brunswick, subtidal drop camera surveys were performed from 2022-2023 at 140 sites. For each site, a GoPro HERO 10 camera was towed along a deep (7-12m) and shallow (3-5m) depth contour until 20 images were acquired per depth. Where possible, species were identified from photos, with particular care given to kelps (defined here as orders Laminariales and Tilopteridales) and fucoids (order Fucales). Crust-forming algae was not counted. Percent cover was calculated using a 10x10 point grid overlaid on each image and recording the dominant cover type at each point. The depth (in meters) of each photo after correcting for tide height ranged from ~0.5m to ~12m. Depths were corrected to chart datum (lowest astronomical tide) using tide predictions from the nearest tide station, taken from tides.gc.ca. Sampling was performed between July and October. Cite this data as: Krumhansl K, Brooks C, Lowen B, DiBacco C, (2025). Camera Surveys of the Subtidal Flora of Nova Scotia and Southwest New Brunswick 2022-2023. Version 1.7. Fisheries and Oceans Canada. Samplingevent dataset. https://ipt.iobis.org/obiscanada/resource?r=camera_surveys_of_the_subtidal_flora_of_nova_scotia_2022-2023&v=1.7 For additional information please see: Krumhansl K.A., Brooks C.M., Lowen B., O’Brien J., Wong M., DiBacco C. Loss, resilience and recovery of kelp forests in a region of rapid ocean warming. Annals of Botany 2024 Mar 8; 133(1):73-92. Brooks C.M., Krumhansl K.A. 2023. First record of the Asian Antithamnion sparsum Tokida, 1932 (Ceramiales, Rhodophyta) in Nova Scotia, Canada. BioInvasions Records 12(3):745-725.
-

The United States population of California Sea Lions (Zalophus californianus) range from southeast Alaska to the Pacific coast of central Mexico. While this population does not breed in Canada, some sub-adult and adult males migrate northwards to British Columbia (BC) during the non-breeding season with an arrival in August–October and a departure in April–May. The population in coastal BC was assessed in 1985 and again in 2023 from dedicated over-winter aerial surveys. The most recent assessment used counts from 2020–2021surveys that were restricted to southern BC as few animals have been documented further north. Additional observations of California Sea Lions were collected while surveying sites for Steller Sea Lions. These opportunistic counts increased from approximately 1,000 animals in the mid-2000s to several thousand individuals in more recent years. Historically occupied sea lion rookeries and haul-out sites were surveyed with nearby areas monitored for potential shifts in distribution. This dataset contains counts that have been collected from sightings of individuals from 1971 through 2021and replaces a previous dataset limited to the 2016/2017 survey season.
-

The Steller sea lion (Eumetopias jubatus) is the largest species of sea lion with males weighing as much as 1,100 kg and females as much as 350 kg. In Canada, the Steller can be spotted along the rocky coast of British Columbia (BC). These highly mobile marine mammals typically travel alone or in small groups, but they congregate in large numbers at traditional rookeries and haul-outs during the mating and pupping season. Females generally live longer (up to 30 years) than males (usually up to 20 years). The population was severely depleted in Canada but following its protection in 1970, the size of the adult population has more than doubled. Trends in the abundance of Steller sea lions in BC have been assessed based on a series of standardized, province-wide aerial surveys conducted during the breeding season (27-June to 06-July) between 1971 and 2021. Additional ad-hoc surveys during the fall, winter, and spring periods were completed to assess sea lion distribution outside of the breeding season. Surveys targeted historically occupied rookeries and haul-out sites with nearby areas also monitored for potential shifts in distribution. Both datasets contain counts that have been collected from sightings of individuals from 1971 through 2021. The updated standard breeding season survey counts data file consolidates and extends two previous datasets – one covering 1971 through 2013 and the other covering the summer portion of the 2016/2017 surveys. The non-breeding season count data was previously limited to the fall-winter portion of the 2016/2017 surveys and the updated data covers the entire study period to date.
-
This is a collection of eelgrass (Zostera marina) presence and absence records collected between 2009-2025 in coastal waters in Nova Scotia, Canada. The data collection has been collated by the Coastal Benthic Ecology Lab (CBEL) at the Bedford Institute of Oceanography, Fisheries and Oceans Canada (DFO) under the supervision of Dr. Melisa Wong. Records include those from various research groups at DFO, Nova Scotia provincial departments, academia, and non-profit organizations. Data were collected using various methods including field measurements of eelgrass presence or absence via boat, snorkel and drop camera video transects, surface observations, and various sample collections (including plants, core, sediment, trawl, pop net, seine, etc.). Please see specific record references for associated metadata and detailed descriptions of the methods for eelgrass occurrence data collection. Where available, water depth (m) and substrate type (rock, soft, or mixed) are provided. The substrate type (hard substrate, mixed, mud, rocky, sand, or various combinations) used for the species distribution model published by O’Brien et al. 2022 is also provided where available. The data owner, data source (i.e., reference(s)), and use of the data in the species distribution model of O’Brien et al. 2022 are provided. All records from sources external to DFO are included under data sharing agreements or permission from the data owner. Cite this data as: Wong, M.C., Fraser, M., Thomson, J. A., O’Brien, J. Data of eelgrass (Zostera marina) occurrences in Nova Scotia. Published: April 2026. Coastal Ecosystems Science Division, Maritimes Region, Fisheries and Oceans Canada, Dartmouth NS.