 Arctic SDI catalogue
Salt water fish
Type of resources
Topics
Keywords
Contact for the resource
Provided by
Years
Formats
Representation types
Update frequencies
status
Service types
-
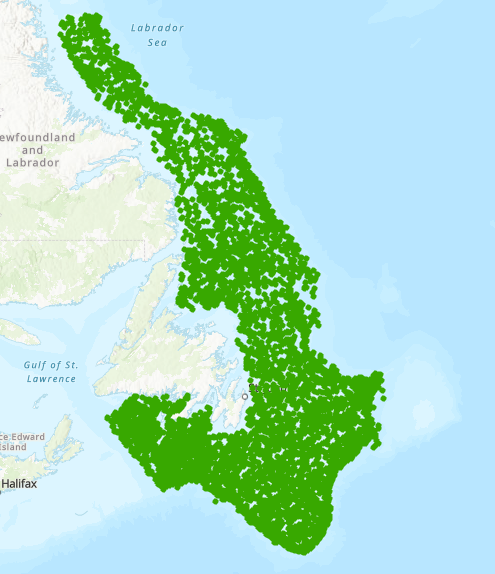
This data is from the Newfoundland and Labrador Region Multispecies Trawl survey, specific to Snow Crab from 2018-25, with only successful tows included in the database. Details of annual survey coverage and an overview of the survey program can be found in Rideout et al. (2025) and references therein. This trawl survey follows a depth-stratified random design, designated by type = 1 (Survey). From 2021-23, a comparative fishing program (i.e., direct side-by-side paired comparison between old and new vessels) was undertaken to determine differences in catchability due to vessel changes and associated modifications to the trawl gear with the retirement of the CCGS Alfred Needler and CCGS Teleost (called ‘old vessels’) and the introduction of the CCGS Capt. Jacques Cartier and CCGS John Cabot (called ‘new vessels’). During this period other set types are in the dataset (6 and 7) from paired tows and all station allocation may not have been stratified random. The DFO NL Region comparative fishing success varied by year, NAFO division, and vessel combinations and resulted in conversion factors to adjust the catches of Snow Crab in the old vessels time series into the same units as the new vessels. Methodologies and conversion factors are described in Wheeland et al. (2024), Trueman et al. (2025), Trueman et al. (2026), and Pantin et al. (in prep). Conversion factors have been applied to the numbers of Snow Crab caught, where conversion factors exist, and are in the converted_number column. An NA in the converted_number column indicates that conversion factors do not exist for this vessel/area combination and therefore direct comparisons cannot be made between old vessels and new vessels. Weights are those recorded at sea and do not have conversion factors applied. Analyses by the DFO NL Snow Crab group apply a length-weight relationship to the converted numbers to determine converted weights, which is not in this dataset. All reasonable attempts are made to standardize fishing time during trawl surveys, however there is always some variation in the actual time on bottom. The species weights and numbers in this dataset are not standardized for tow distance/duration. Spatial coverage of this survey has varied over time, therefore, not all divisions, or depths within divisions, are sampled every year or season. Biological measurements are described in Pantin et al. (2025). Tows that caught zero Snow Crab are denoted in the dataset by a ‘number’ of 0. References: McCallum, B. R., and S. J. Walsh. 1996. Groundfish survey trawls used at the Northwest Atlantic Fisheries Centre, 1971-present. NAFO Sci. Coun. Studies, 29: 93-104. Pantin, J., D. Mullowney, K. Baker, K. Lefort, W. Coffey, F. Cyr, H. Munro, and Koen-Alonso, M. 2025. An Assessment of Newfoundland and Labrador Snow Crab (Chionoecetes opilio) in 2023. DFO. Can. Sci. Advis. Sec. Res. Doc. 2025/080. iv + 152 p. Pantin, J., Charmley, K., Mullowney, D., Baker, K., Lefort, K., Coyne, J., Munro, H., and Koen-Alonso, M. In prep. An Assessment of Newfoundland and Labrador Snow Crab (Chionoecetes opilio) in 2024. DFO Can. Sci. Advis. Sec. Res. Doc. year/nnn. Rideout, R.M., Wheeland, L., Perreault, A., Regular, P., Skanes, K., Simms, L., and Makrides, J. 2025. Canadian (Newfoundland and Labrador Region) Multi-Species Research vessel Bottom Trawl Survey Report for Surveys Conducted in 2024. NAFO SCR Doc. 25/028: 1-68. Trueman, S., Wheeland, L., Benoît, H., Munro, H., Nguyen, T., Novaczek, E., Skanes, K., and Yin, Y. 2025. Results of Comparative Fishing Between the CCGS Teleost and CCGS Alfred Needler with the CCGS John Cabot and CCGS Capt. Jacques Cartier in the Newfoundland and Labrador Region in 2021 and 2022. DFO Can. Sci. Advis. Sec. Res. Doc. 2025/021. v + 237 p. Trueman, S., Wheeland, L., Pantin, J., Baker, K., and Mullowney, D. 2026. On the relative catchability of Snow Crab in the Newfoundland and Labrador Multispecies trawl surveys. DFO Can. Sci. Advis. Sec. Res. Doc. 2026/008. iv + 41 p. Wheeland, L., Skanes, K. and Trueman, S. 2024. Summary of Comparative Fishing Data Collected in Newfoundland & Labrador from 2021-2022. Can. Tech. Rep. Fish. Aquat. Sci. 3579: iv + 132 p.
-

Salmon have a complex hierarchical population structure extending from groups of salmon at individual spawning sites all the way up to taxonomic species. These independently functioning aggregates are defined as Conservation Units (CUs) in the Wild Salmon Policy. A stock management unit (SMU) is a group of one or more CUs that are managed together with the objective of achieving a joint status. There are 69 SMUs containing 468 CUs. In 2022, eight SMUs units did not have enough information to provide an assessment. Sixty-one units were assigned a forecast. There are ongoing requests to represent salmon information for these areas. Salmon are assessed and managed at different levels for different needs. The layers in this dataset include administrative areas, stock management units, and conservation units. The data included is a shapefile containing a single feature class layer represented in point and polygon form, as well as a csv table (attributes) to present Stock Management Unit information in a simple, visual way.
-

The Science Branch of Fisheries and Oceans Canada (DFO) in the Newfoundland and Labrador (NL) region has been conducting multispecies research vessel (RV) surveys using a stratified random survey design since the early 1970s. The DFO RV survey dataset represents the longest time series of species data in the NL region, making it ideal for mapping the average relative densities of species over time. Average relative density maps depict the interpolated densities (calculated from kg/tow) of fish species or functional groups. These densities are averaged over each time series (Engel and Campelen) and include data from all available seasons, so they represent persistent areas of relatively high and low densities for that species or functional group for the duration of the time series, independent of season. These maps are well suited as decision support tools related to conservation areas and marine spatial planning. These maps can also inform other processes that require information on areas important to marine fish, such as environmental assessments. Spring, fall, and winter data from the DFO RV survey between 1981 and 2017, inclusive, were used for the analysis. Due to a gear change from an Engel 145 Hi-Lift Otter Trawl to a Campelen 1800 Shrimp Trawl in 1995, the time series is treated as two separate datasets. NAFO Divisions 2J3KLNOP were sampled during the Engel time series and Division 2H was added for the Campelen time series. The data were filtered prior to use so that only core strata (areas consistently sampled across years) were included, resulting in most deep water and inshore sets being excluded in this analysis. Weight per tow (kg/tow; standardized for tow length for each gear type) data for fish, shrimp, and crab species were extracted from the database, and all successful sets from regular multispecies surveys were used for analyses. Eight fish functional groups (groups of species of similar size and diet) were identified based on the RV survey dataset: small benthivores, medium benthivores, large benthivores, piscivores, plank-piscivores, planktivores, shrimp, and forage fish. Data for each functional group were mapped three ways: all species, dominant species (i.e. top 90% biomass), and non-dominant species. In total, 40 dominant species and/or at-risk species (i.e. COSEWIC endangered, threatened, special concern; SARA; DFO/NAFO depleted) were mapped individually. To identify the average relative density, independent of seasonality, the spring, fall, and winter survey sets were compiled into a composite dataset using a log transformation on the biomass (kg/tow). For functional groups, these values were then standardized across each group. Absences (0 kg/tow catch values) were included. A continuous raster with a 4x4km resolution was generated through ordinary kriging. The raster was clipped to an 8-km buffer of the RV survey extent and the zero values were then removed. The results of this process are maps depicting the average relative density of fish functional groups and selected individual species during both the Engel (1981-1995) and Campelen (1995-2017) time series. Note that the original units (e.g. kg/tow) are no longer relevant due to data processing. Cell values are not comparable between groups or species; when mapping, all numeric values should be removed from the labels and legend, with relative qualifiers (“high” and “low”) used instead. More detailed information can be found in Wells et al. (2021). References: Wells, N.J., Pretty, C., Warren, M., Novaczek, E. and Koen-Alonso, M. 2021. Average Relative Density of Fish Species and Functional Groups in the Newfoundland and Labrador Shelves Bioregion from 1981-2017. Can. Tech. Rep. Fish. Aquat. Sci. 3427: viii + 76 p.
-
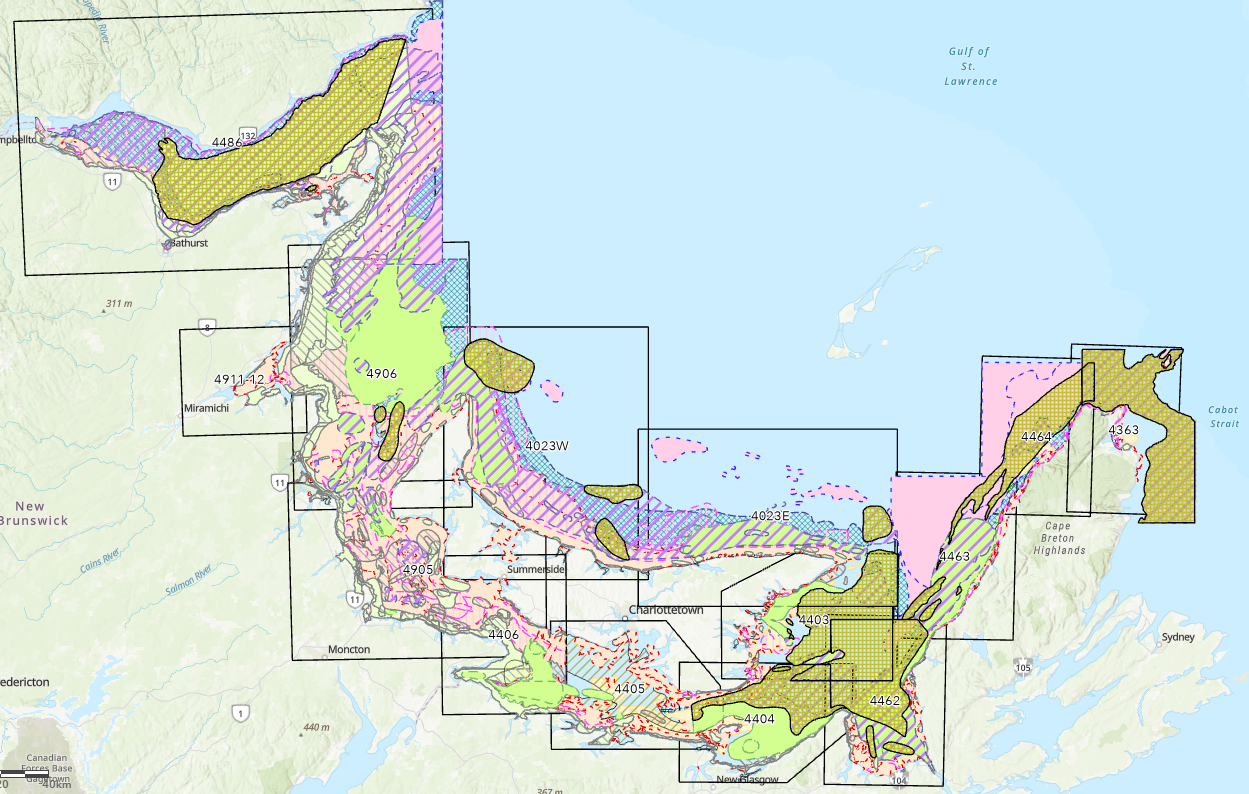
In 1998, Fisheries and Oceans Canada (DFO) published an atlas called "Traditional Fisheries Knowledge for the Southern Gulf of St. Lawrence". The document is composed of a series of maps that contain useful information primarily on nearshore fisheries and fish habitat in the eastern shore of New Brunswick, Prince Edward Island and the Gulf Shore of Nova Scotia. It was used as a working tool to assist in the development of integrated coastal zone management plans, resource management plans, and more. Between 1994 and 1997, data collectors and fishery officers interviewed local fishers and industry representatives. The purpose of these interviews was primarily to gain information on local fishing activities and the location of fisheries' resources and their habitats. The data and information was vetted through a process of verification with scientists, fishers, locals, industry representatives, and government officials. Maps were then compiled for 14 commercially important fish species and made publicly available to consult. These include lobster, rock crab, scallop, snow crab, toad crab, herring, mackerel, American plaice, cod, witch flounder (grey sole), hake, halibut, winter flounder, and unspecified groundfish. This data resource also includes the other 27 species originally not included in the atlas.
-

2014 to 2023 pelagic fish abundance in the Estuary and the Gulf of St. Lawrence. The abundance is expressed as a number of individuals per normalized trawl set. Each species is individually represented in the northern Gulf and in the southern Gulf. Input data are from the annual August (North) and September (South) multidisciplinary surveys. The pelagic species represented are: Arctic Cod, Atlantic Argentine, Atlantic Herring, Atlantic Mackerel, Atlantic Soft Pout, Capelin, Lumpfish, Pollock, Rainbow Smelt, Sand Lances, Silver Hake, Threespine Stickleback and White Barracudina. Purpose Since 1990, the Department of Fisheries and Oceans has been conducting an annual multidisciplinary survey in the Estuary and northern Gulf of St. Lawrence using a standardized protocol. In the southern Gulf of St. Lawrence, these bottom trawl surveys has been carrying out each September since 1971. These missions are an important source of information about the status of the marine ressources. The objectives of the surveys are multiple: to estimate the abundance and biomass of groundfish and invertebrates, to identify the spatial distribution and biological characteristics of these species, to monitor the biodiversity of the Estuary and Gulf and finally, to describe the environmental conditions observed in the area at the moment of the sampling. The southern Gulf surveys are realized using the following standardized protocol: Hurlbut,T. and D.Clay (eds) 1990. Protocols for Research Vessel Cruises within the Gulf Region (Demersal Fish) (1970-1987). Can. MS Rep. Fish. Aquat. Sci. No. 2082: 143p. The sampling protocols used for the Estuary and northern Gulf surveys are described in details in the following publications: Bourdages, H., Archambault, D., Bernier, B., Fréchet, A., Gauthier, J., Grégoire, F., Lambert, J., et Savard, L. 2010. Résultats préliminaires du relevé multidisciplinaire de poissons de fond et de crevette d’août 2009 dans le nord du golfe du Saint-Laurent. Rapp. stat. can. sci. halieut. aquat. 1226 : xii+ 72 p. Bourdages, H., Archambault, D., Morin, B., Fréchet, A., Savard, L., Grégoire, F., et Bérubé, M. 2003. Résultats préliminaires du relevé multidisciplinaire de poissons de fond et de crevette d’août 2003 dans le nord du golfe du Saint-Laurent. Secr. can. consult. sci. du MPO. Doc. rech. 2003/078. vi + 68 p. Annual reports are available at the Canadian Science Advisory Secretariat (CSAS), (http://www.dfo-mpo.gc.ca/csas-sccs/index-eng.htm). Bourdages, H., Brassard, C., Desgagnés, M., Galbraith, P., Gauthier, J., Légaré, B., Nozères, C. and Parent, E. 2017. Preliminary results from the groundfish and shrimp multidisciplinary survey in August 2016 in the Estuary and northern Gulf of St. Lawrence. DFO Can. Sci. Advis. Sec. Res. Doc. 2017/002. v + 87 p.
-

During the period of 1987 to 1994, Robin J. LeBrasseur and N. Brent Hargreaves lead a juvenile salmon predation research project in Alberni Inlet and Barkley Sound BC. This dataset contains the research survey catch data and individual fish examinations data.
-

The Species at Risk (SAR) Program is responsible for carrying out DFO’s mandate under the Species at Risk Act (SARA) to protect, recover and conserve all listed aquatic SAR in Canada. Critical habitat is identified for species listed as Endangered or Threatened under the Species at Risk Act (SARA). This mapping tool is for general guidance only. “Mapped” representations of waterbodies and watercourses are based on authoritative provincial geospatial products, guidance and standards. Due to the nature of dynamic systems and the resolution/accuracy of these data sets, areas within which critical habitat is found as displayed on the mapping tool may not align exactly with natural watercourses. If discrepancies occur, refer to the relevant species recovery strategy and/or action plan for additional information on critical habitat. If additional guidance is required, please contact the Fish and Fish Habitat Protection Program: https://www.dfo-mpo.gc.ca/pnw-ppe/contact-eng.html Critical habitat is defined under section 2 of SARA as: "the habitat that is necessary for the survival or recovery of a listed wildlife species and that is identified as the species' critical habitat in the recovery strategy or in an action plan for the species". Section 49(1)(a) of SARA requires that a species' Recovery Strategy/Action Plan include an identification of the species' critical habitat to the extent possible, based on the best available information, including information provided by the Committee on the Status of Endangered Wildlife in Canada (COSEWIC). SARA makes it illegal to destroy any part of the critical habitat of SAR and may impose restrictions on development and construction. Critical habitats were assembled by SARA regional biologists and recovery teams. They are designed to support the protection and recovery of species listed as Endangered or Threatened under the Species at Risk Act. They are also described and displayed in species' Recovery Documents and Action Plans.
-

Description: Spatial information on the distribution of juvenile Pacific salmon is needed to support Marine Spatial Planning in the Pacific Region of Canada. Here we provide spatial estimates of the distribution of juvenile fish in the Strait of Georgia for all five species of Pacific salmon. These estimates were generated using a spatiotemporal generalized linear model and are based on standardized fishery-independent survey data from the Strait of Georgia mid-water juvenile salmon mid-water trawl survey from 2010 to 2020. We provide predicted catch per unit effort (CPUE), year-to-year variation in CPUE, and prediction uncertainty for both summer (June–July) and fall (September–October) at a 0.5 km resolution, covering the majority of the strait. These results show that the surface 75 m of the entire Strait of Georgia is habitat for juvenile salmon from June through early October, but that distributions within the strait differ across species and across seasons. While there is interannual variability in abundances and distributions, our analysis identifies areas that have consistently high abundances across years. The results from this study illustrate juvenile habitat use in the Strait of Georgia for the five species of Pacific salmon and can support ongoing marine spatial planning initiatives in the Pacific region of Canada. Methods: Juvenile Salmon Survey Data This analysis is based on surveys conducted between 2010 and 2020. Sets that lasted between 12 and 50 minutes and at depths less than or equal to 60 m (head rope depth) were included. The resulting survey dataset consists of 1588 sets. The analysis included all five species of Pacific salmon. For pink salmon, only even year surveys were included as they have a two-year life cycle and are effectively absent from the Strait in odd years. Geostatistical model of salmon abundance and Predictions We estimated the spatial distribution and abundance of each species of Pacific Salmon using geostatistical models fit with sdmTMB (Anderson et al. 2022). For each species, we modelled the number of individuals caught in a set, at a location and time using a negative binomial observation model with a log link. Predictions were made for each survey season (summer and fall) in each year from 2010 to 2020 over a 500 m by 500 m grid based on a 3 km buffer around the outer concave hull of the trawl coordinates. The concave hull was calculated using the ‘sf_concave_hull’ function from the sf package using a concavity ratio of 0.3, and excluding holes. Predictions were made as catch per unit effort (CPUE, for 60 minutes) for tows conducted in the surface waters (i.e., head rope at 0 m). Continuous estimates are provided at a 0.5 km resolution throughout the Strait of Georgia. These estimates consist of 1) mean catch per unit effort (CPUE), 2) year-to-year coefficient of variation (CV) of CPUE as a measure of the temporal variability, 3) binned biscale measures of mean vs. CV of CPUE to distinguish areas where abundance is consistently high vs. areas where it is high on average, but with high year-to-year variability, and 4) mean standard error in CPUE as a measure of uncertainty. See Thompson and Neville for full method details. Uncertainties: Although the models had relatively low uncertainty and the estimated spatial patterns reflected the spatial and temporal variation in CPUE in the surveys, it is important to understand the limitations of these model predictions. Because juvenile salmon are often aggregated, there is high variability in the CPUE in the survey data. Our model predictions represent the geometric mean CPUE and so are an average expectation, but do not reproduce the high inter-tow variability that is present in the survey data. Spatially, our predictions have low uncertainty in areas that are central within the standard survey track line. However, uncertainty is higher on the margins of the survey area, where there are fewer sets to inform those predictions. Data Sources: Juvenile salmon survey database from Salmon Marine Interactions Program, REEFF, ESD, Pacific Biological Station. Data is also available through Canadian Data Report of Fisheries and Aquatic Sciences publications.
-
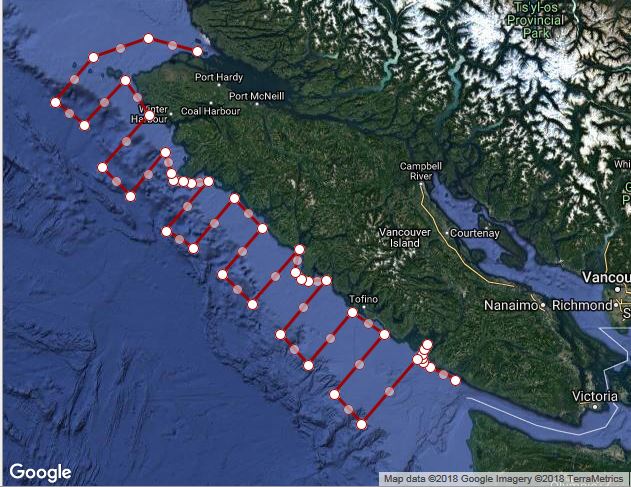
During the period of 1990 to 1993, Robin J. LeBrasseur and N. Brent Hargreaves led a juvenile salmon migration research project off the west coast of Vancouver Island BC. This included the development of surface beam trawl gear that could be deployed from a large trawl vessel (CCGS W.E. Ricker) and operated in an offshore environment. This dataset contains the research survey catch data and individual fish examinations data.
-

The Species at Risk (SAR) Program is responsible for carrying out DFO’s mandate under the Species at Risk Act (SARA) to protect, recover and conserve all listed aquatic SAR in Canada. As part of this mandate, this spatial database has been developed to identify areas in which aquatic species listed under SARA may be found. Distribution and range information are identified for species listed as Endangered, Threatened or Special Concern under SARA. Distribution (range) polygons and lines were assembled by regional SARA biologists using the best available information, including COSEWIC status reports, recovery potential assessments, academic literature, and expert opinion. These spatial data support the protection, recovery and conservation of species listed as Endangered, Threatened or Special Concern under SARA. Species distributions are also described and displayed in Recovery Strategies, Action Plans and/or Management Plans. Discrepancies may exist between the distribution data shown in a species’ SARA recovery document and the current spatial data. Please contact DFO for more information on any data discrepancies.