 Arctic SDI catalogue
landscape
Type of resources
Available actions
Topics
Keywords
Contact for the resource
Provided by
Years
Formats
Representation types
Update frequencies
status
Service types
Resolution
-

High Resolution land cover characteristics for the 2018 reference year. Small woody landscape features are important vectors of biodiversity and provide information on fragmentation of habitats with a direct potential for restoration while also providing a link to hazard protection and green infrastructure, amongst others. VHR_IMAGE_2018 made available in the ESA Copernicus DWH will be the main data source for the detection of small woody features identifiable within the given image resolution. The Small Woody Features (SWFs) layer contains woody linear and patchy elements but will not be further differentiated into trees, hedges, bushes and scrub. The spatial pattern shall be limited to linear structures and isolated patches on the basis of geometric characteristics.
-
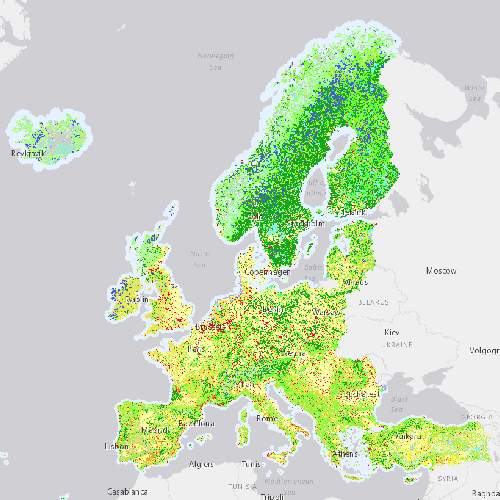
Corine Land Cover 2000 (CLC2000) is one of the datasets produced within the frame the Corine Land Cover programme referring to land cover / land use status of year 2000. The Corine Land Cover (CLC) is a European programme, coordinated by the European Environment Agency (EEA), providing consistent and thematically detailed information on land cover and land cover changes across Europe. CLC products are based on the classification of satellite images by the national teams of the participating countries - the EEA member and cooperating countries (EEA39). National CLC inventories are further integrated into a seamless land cover map of Europe. The resulting European database relies on standard methodology and nomenclature with following base parameters: 44 classes in the hierarchical 3-level CLC nomenclature; minimum mapping unit (MMU) for status layers is 25 hectares; minimum width of linear elements is 100 metres. Change layers have higher resolution, i.e. minimum mapping unit (MMU) is 5 hectares for Land Cover Changes (LCC), and the minimum width of linear elements is 100 metres. The CLC programme provides important data sets supporting the implementation of key priority areas of the Environment Action Programmes of the European Community as e.g. protecting ecosystems, halting the loss of biological diversity, tracking the impacts of climate change, monitoring urban land take, assessing developments in agriculture and implementing the EU Water Framework Directive. run by the European Commission and the European Environment Agency, which provides environmental information from a combination of air- and space-based observation systems and in-situ monitoring.
-

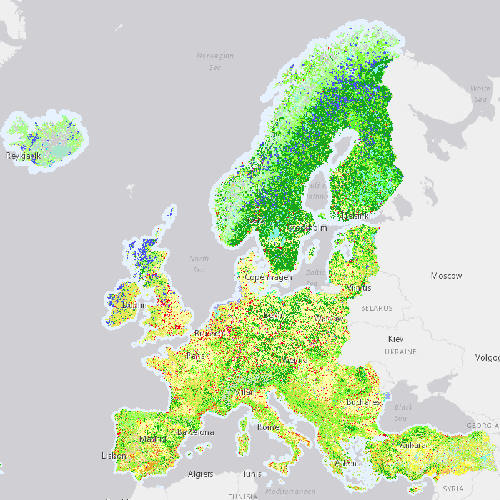
Corine Land Cover Change 2006-2012 (CHA0612) is one of the Corine Land Cover (CLC) datasets produced within the frame the Copernicus Land Monitoring Service referring to changes in land cover / land use status between the years 2006 and 2012. CHA is derived from satellite imagery by direct mapping of changes taken place between two consecutive inventories, based on image-to-image comparison. CLC datasets are based on the classification of satellite images produced by the national teams of the participating countries - the EEA members and cooperating countries (EEA39). National CLC inventories are then further integrated into a seamless land cover map of Europe. The resulting European database relies on standard methodology and nomenclature with following base parameters: 44 classes in the hierarchical 3-level CLC nomenclature; minimum mapping unit (MMU) for status layers is 25 hectares; minimum width of linear elements is 100 metres. Change layers have higher resolution, i.e. minimum mapping unit (MMU) is 5 hectares for Land Cover Changes (CHA), and the minimum width of linear elements is 100 metres. The CLC service delivers important data sets supporting the implementation of key priority areas of the Environment Action Programmes of the European Union as e.g. protecting ecosystems, halting the loss of biological diversity, tracking the impacts of climate change, monitoring urban land take, assessing developments in agriculture or dealing with water resources directives. part of the European Copernicus Programme coordinated by the European Environment Agency, providing environmental information from a combination of air- and space-based observation systems and in-situ monitoring.
-

Corine Land Cover 2000 (CLC2000) is one of the datasets produced within the frame the Corine Land Cover programme referring to land cover / land use status of year 2000. The Corine Land Cover (CLC) is a European programme, coordinated by the European Environment Agency (EEA), providing consistent and thematically detailed information on land cover and land cover changes across Europe. CLC products are based on the classification of satellite images by the national teams of the participating countries - the EEA member and cooperating countries (EEA39). National CLC inventories are further integrated into a seamless land cover map of Europe. The resulting European database relies on standard methodology and nomenclature with following base parameters: 44 classes in the hierarchical 3-level CLC nomenclature; minimum mapping unit (MMU) for status layers is 25 hectares; minimum width of linear elements is 100 metres. Change layers have higher resolution, i.e. minimum mapping unit (MMU) is 5 hectares for Land Cover Changes (LCC), and the minimum width of linear elements is 100 metres. The CLC programme provides important data sets supporting the implementation of key priority areas of the Environment Action Programmes of the European Community as e.g. protecting ecosystems, halting the loss of biological diversity, tracking the impacts of climate change, monitoring urban land take, assessing developments in agriculture and implementing the EU Water Framework Directive. run by the European Commission and the European Environment Agency, which provides environmental information from a combination of air- and space-based observation systems and in-situ monitoring.
-
Corine Land Cover 2012 (CLC2012) is one of the Corine Land Cover (CLC) datasets produced within the frame the Copernicus Land Monitoring Service referring to land cover / land use status of year 2012. CLC service has a long-time heritage (formerly known as "CORINE Land Cover Programme"), coordinated by the European Environment Agency (EEA). It provides consistent and thematically detailed information on land cover and land cover changes across Europe. CLC datasets are based on the classification of satellite images produced by the national teams of the participating countries - the EEA members and cooperating countries (EEA39). National CLC inventories are then further integrated into a seamless land cover map of Europe. The resulting European database relies on standard methodology and nomenclature with following base parameters: 44 classes in the hierarchical 3-level CLC nomenclature; minimum mapping unit (MMU) for status layers is 25 hectares; minimum width of linear elements is 100 metres. Change layers have higher resolution, i.e. minimum mapping unit (MMU) is 5 hectares for Land Cover Changes (LCC), and the minimum width of linear elements is 100 metres. The CLC service delivers important data sets supporting the implementation of key priority areas of the Environment Action Programmes of the European Union as e.g. protecting ecosystems, halting the loss of biological diversity, tracking the impacts of climate change, monitoring urban land take, assessing developments in agriculture or dealing with water resources directives. part of the European Copernicus Programme coordinated by the European Environment Agency, providing environmental information from a combination of air- and space-based observation systems and in-situ monitoring.
-

Land cover imagery for the moist mixed grassland ecoregion of Saskatchewan with a resolution of 10m. Classification was based on machine learning analysis and remote sensing data of Sentinel-1 and Sentinel-2 imagery in Google Earth Engine platform. The goal of this land cover was to distinguish native from tame grasslands, and is classified into several classes: native grassland, tame grassland, mixed grassland, cropland, woody plants, water, and urban area. Download: Here The Prairie Landscape Inventory (PLI) working team of Habitat Unit in the Fish and Wildlife Branch, Ministry of Environment aims to develop improved methods of assessing land cover and land use for conservation. Native grassland, in particular, has been one of the most hard to map at risk ecosystems because of difficulty for imagery classification methods to distinguish native from tame grasslands. Improved classification methods will provide valuable information for habitat suitability, identifying high biodiversity potential and invasion risk potential. The classification map has seven (7) classes: 1. Cropland This class represents all cultivated areas with crop commodities: corn, pulse, soybeans, canola, grains, summer-fallow. 2. Native grassland This class represents the native grassland areas of the Moist Mixed Grassland ecoregion, which are composed of at least 75% native grass species, such as the needle grasses, wheatgrasses along with June grass and blue grama grass. Also includes additional sedge species, forbs, and some non-vascular species. Unbroken grassland that is invaded by species like Kentucky bluegrass, crested wheatgrass or smooth brome, such that native cover is less than 75%, is not considered native for the purpose of this project. 3. Mixed grassland This class represent a heterogenic grassland with a mix of less than 75% native grass species or less than 75% tame species. 4. Tame grassland This class represents the tame grassland areas of the Moist Mixed Grassland ecoregion, which are composed of at least 75% seeded or planted species with introduced grasses and forb species such as crested wheatgrass, smooth brome, alfalfa, sweet clover. 5. Water This class represents permanent water locations such as lakes and rivers. 8. Woody plants This class represents the sites dominated by woody vegetation including shrubs and trees with typically more than 20% canopy cover. 9. Urban area This class was masked using urban/developed area class of the Annual Crop Inventory 2020 (Agriculture Agri-Food Canada), and limited within the urban municipality polygons. Colour Classes: Value Label Red Green Blue 1 Cropland 255 255 190 2 Native grassland 168 168 0 3 Mixed grassland 199 215 158 4 Tame grassland 245 202 122 5 Water 190 232 255 8 Woody plants 137 205 102 9 Urban area 128 128 128 Accuracy metrics This model has an overall accuracy of 70.3 per cent. The table below summarizes the user’s accuracy, producer’s accuracy, and F1-score of the model on the validation dataset. Class User’s accuracy (%) Producer’s accuracy (%) F1-score Cropland 74.7 87.1 0.81 Native grassland 61.7 78.3 0.69 Mixed grassland 57.7 26.1 0.36 Tame grassland 66.9 69.8 0.68 Water 96.3 84.4 0.90 Woody plants 81.1 73.2 0.77
-

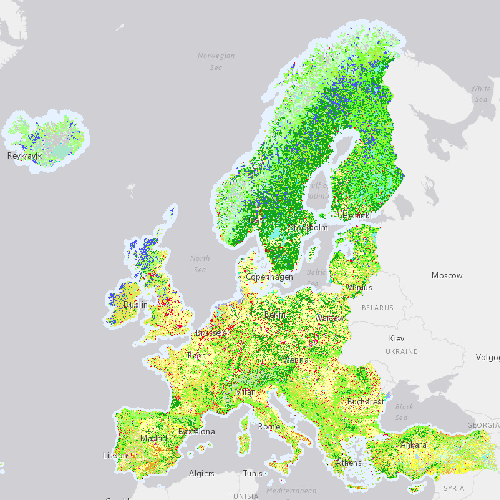
Small Woody Features are important vectors of biodiversity and provide information on fragmentation of habitats with a direct potential for restoration while also providing a link to hazard protection and green infrastructure, amongst others. VHR_IMAGE_2021 made available in the ESA Copernicus DWH was the main data source for the detection of small woody features identifiable within the given image resolution. The Small Woody Features layer contains woody linear and patchy elements but will not be further differentiated into trees, hedges, bushes and scrub. The spatial pattern shall be limited to linear structures and isolated patches on the basis of geometric characteristics. This product is a vector dataset distributed as OGC GeoPackage files, compliant with the EEA reference grid (100km x 100km).
-
Corine Land Cover 2018 (CLC2018) is one of the Corine Land Cover (CLC) datasets produced within the frame the Copernicus Land Monitoring Service referring to land cover / land use status of year 2018. CLC service has a long-time heritage (formerly known as "CORINE Land Cover Programme"), coordinated by the European Environment Agency (EEA). It provides consistent and thematically detailed information on land cover and land cover changes across Europe. CLC datasets are based on the classification of satellite images produced by the national teams of the participating countries - the EEA members and cooperating countries (EEA39). National CLC inventories are then further integrated into a seamless land cover map of Europe. The resulting European database relies on standard methodology and nomenclature with following base parameters: 44 classes in the hierarchical 3-level CLC nomenclature; minimum mapping unit (MMU) for status layers is 25 hectares; minimum width of linear elements is 100 metres. Change layers have higher resolution, i.e. minimum mapping unit (MMU) is 5 hectares for Land Cover Changes (LCC), and the minimum width of linear elements is 100 metres. The CLC service delivers important data sets supporting the implementation of key priority areas of the Environment Action Programmes of the European Union as e.g. protecting ecosystems, halting the loss of biological diversity, tracking the impacts of climate change, monitoring urban land take, assessing developments in agriculture or dealing with water resources directives. part of the European Copernicus Programme coordinated by the European Environment Agency, providing environmental information from a combination of air- and space-based observation systems and in-situ monitoring.
-

Corine Land Cover Change 2012-2018 (CHA1218) is one of the Corine Land Cover (CLC) datasets produced within the frame the Copernicus Land Monitoring Service referring to changes in land cover / land use status between the years 2012 and 2018. CLC service has a long-time heritage (formerly known as "CORINE Land Cover Programme"), coordinated by the European Environment Agency (EEA). It provides consistent and thematically detailed information on land cover and land cover changes across Europe. CLC datasets are based on the classification of satellite images produced by the national teams of the participating countries - the EEA members and cooperating countries (EEA39). National CLC inventories are then further integrated into a seamless land cover map of Europe. The resulting European database relies on standard methodology and nomenclature with following base parameters: 44 classes in the hierarchical 3-level CLC nomenclature; minimum mapping unit (MMU) for status layers is 25 hectares; minimum width of linear elements is 100 metres. Change layers have higher resolution, i.e. minimum mapping unit (MMU) is 5 hectares for Land Cover Changes (CHA), and the minimum width of linear elements is 100 metres. The CLC service delivers important data sets supporting the implementation of key priority areas of the Environment Action Programmes of the European Union as e.g. protecting ecosystems, halting the loss of biological diversity, tracking the impacts of climate change, monitoring urban land take, assessing developments in agriculture or dealing with water resources directives. part of the European Copernicus Programme coordinated by the European Environment Agency, providing environmental information from a combination of air- and space-based observation systems and in-situ monitoring.
-
Corine Land Cover 2006 (CLC2006) is one of the Corine Land Cover (CLC) datasets produced within the frame the Copernicus Land Monitoring Service referring to land cover / land use status of year 2006. CLC service has a long-time heritage (formerly known as "CORINE Land Cover Programme"), coordinated by the European Environment Agency (EEA). It provides consistent and thematically detailed information on land cover and land cover changes across Europe. CLC datasets are based on the classification of satellite images produced by the national teams of the participating countries - the EEA members and cooperating countries (EEA39). National CLC inventories are then further integrated into a seamless land cover map of Europe. The resulting European database relies on standard methodology and nomenclature with following base parameters: 44 classes in the hierarchical 3-level CLC nomenclature; minimum mapping unit (MMU) for status layers is 25 hectares; minimum width of linear elements is 100 metres. Change layers have higher resolution, i.e. minimum mapping unit (MMU) is 5 hectares for Land Cover Changes (LCC), and the minimum width of linear elements is 100 metres. The CLC service delivers important data sets supporting the implementation of key priority areas of the Environment Action Programmes of the European Union as e.g. protecting ecosystems, halting the loss of biological diversity, tracking the impacts of climate change, monitoring urban land take, assessing developments in agriculture or dealing with water resources directives. part of the European Copernicus Programme coordinated by the European Environment Agency, providing environmental information from a combination of air- and space-based observation systems and in-situ monitoring.